Munich Personal RePEc Archive
At What Levels of Financial
Development Does Information Sharing
Matter?
Asongu, Simplice and Nwachukwu, Jacinta
January 2017
Online at
https://mpra.ub.uni-muenchen.de/81189/
A G D I Working Paper
WP/17/017
At What Levels of Financial Development Does Information Sharing Matter?
Published in: Financial Innovation, 3(11), pp. 1-30.
Simplice A. Asongu
African Governance and Development Institute, P.O. Box 8413 Yaoundé, Cameroon. E-mail: [email protected]
Jacinta C. Nwachukwu
School of Economics, Finance and Accounting, Faculty of Business and Law,
2017 African Governance and Development Institute WP/17/017
Research Department
At What Levels of Financial Development Does Information Sharing Matter?
Simplice A. Asongu & Jacinta C. Nwachukwu
January 2017
Abstract
The purpose of this study is to investigate how increasing information sharing bureaus affect
financial access. For this reason, we have employed contemporary and non-contemporary
interactive Quantile Regressions in 53 African countries for the period 2004-2011. Information
sharing bureaus are proxied with public credit registries and private credit offices. Financial
development dynamics involving depth (at overall economic and financial system levels),
efficiency (at banking and financial system levels), activity (from banking and financial system
perspectives) and size are used. Two key findings are established. First, the effect of increasing
private credit bureaus is not clearly noticeable on financial access, probably because private
credit agencies are still to be established in many countries. Second, increasing public credit
registries improves financial allocation efficiency and activity (or credit) between the 25th and
75th quartiles for the most part. As a main policy implication, countries in the top (or highest
levels of financial development) and bottom (or lowest levels of financial development) ends of
the financial efficiency and activity distributions are unlikely to benefit from enhanced financial
allocation efficiency owing to increasing public credit registries.
JEL Classification: G20; G29; O16; O55; C52
1. Introduction
The purpose of this study is to assess how increasing information sharing offices affects financial
access when existing levels of financial development are taken into account. Consistent with
recent literature, less than 20 percent of African households have access to financial services (see
IFAD, 2011; Asongu et al., 2017). According to the narrative, a great part of the population on
the continent depends on the informal sector for financial services. Some factors limiting access
to finance include: low population densities in many areas, poor facilities in transport and limited
communication infrastructure. In regions where financial services from the formal sector are
available, low-income households and small businesses are for the most part unable to meet
some basic lending requirements like strict documentation and collateral provision. Even in
situations where such conditions are met, cost barriers (like substantial transactions fees) and
high minimum deposit of savings could still overwhelmingly restrict financial access.
The above concerns have led to issues of surplus liquidity or excess cash in African
formal financial institutions (see Saxegaard, 2006; Fouda, 2009; Asongu, 2014a, p.70). The
authors have suggested measures to curb both the voluntary and involuntary holding of excess
liquidity by banks. First, voluntary holding of excess cash can be reduced by: (i) helping banks
to track their positions at the central bank to prevent them from keeping reserves above statutory
limits; (ii) consolidating institutions that are favourable to interbank lending and (iii) improving
infrastructure to prevent remote bank branches from holding excess reserves essentially due to
transportation problems. Second, involuntary keeping of surplus cash can be kept at minimum
by: (i) reducing the incapacity of banks to lend in scenarios where interest rates are regulated, (ii)
creating conducive conditions for commercial banks to invest surplus liquidity in bond markets;
(iii) increasing investment avenues for regional banks via promotion of regional stock exchange
markets and (iv) reducing lending contraction of banks through instruments that encourage
competition and mitigate information asymmetry. This line of inquiry is closest to the last point
of the first strand.
Over the past decade, information sharing bureaus have been introduced across the
African continent in order to enhance financial access by limiting information asymmetry.
Unfortunately, recent empirical literature has been based on the assumption that information
sharing agencies may not be increasing financial access as theoretically anticipated (see Triki &
sharing bureaus have been negative for the most part on financial development dynamics of
depth, allocation efficiency and activity. Moreover, as we shall demonstrate in the literature
review which follows, there has been very limited scholarly focus on the role of information
sharing agencies on financial access in the African continent.
This study addresses highlighted gaps by investigating whether increasing information
sharing bureaus could enhance financial access when it matters. The interest in considering
initial levels of financial development arises because the findings of Asongu et al (2016) have
been based on the average values of financial development. It is important to show countries
with low, intermediate and high levels of financial development in the modelling exercise
because blanket policies based on the mean values of the financial access may not succeed unless
they are contingent on initial levels of financial development and tailored differently across
countries with high, intermediate and low initial levels of financial access (see Henderson et al.,
2013). In the light of the above insights, the Quantile regression empirical strategy is adopted
because existing studies on information sharing have examined the relationship between
information sharing bureaus and financial development by involving parameter estimates at the
conditional mean of financial development variables (Triki & Gajigo, 2014; Asongu et al.,
2016).
The emphasized research gaps are addressed by answering the following question: how
does increasing information sharing bureaus affect financial access when its existing level
matters in Africa? It is important to address this research inquiry because the findings should
inform policy makers on how financial access barriers can be lifted to enable households and
small corporations to maximise their savings and earnings for more productivity, more
employment and higher economic growth. Hence, the contribution of this study is to complement
existing literature by investigating how increases in information sharing offices influence
financial development when existing levels are considered in the modelling exercise. One of the
main results stemming from the econometric analysis is that increasing public credit registries
improves financial efficiency in the middle of the financial development distribution. This result
is intuitive because for poorly developed financial systems, increasing information sharing
bureaus may in some respect decrease the pace of development, whereas for more developed
The rest of the study is structured as follows. Section 2 discusses the background,
theoretical underpinnings and empirical literature. The data and methodology are covered in
Section 3. The empirical results are presented and discussed in Section 4. Section 5 concludes
with future research directions.
2. Background, Theoretical Underpinnings and Empirical Literature
2.1 Background
Information sharing bureaus or credit reference agencies (private credit bureaus and/or
public credit registries) are institutions that collect information on the obligations of commercial
and individual borrowers from various sources, namely: direct investigation and public sources
(for businesses), banks and credit card companies (for individuals) and retail lenders
(Tchamyou & Asongu, 2017). Once the data is collected, the information is consolidated after
cross-checking for a comprehensive credit report. Such a report is useful for potential creditors.
Data from a credit history report can encompass both positive and negative information: (i)
positive information (entailing details on all opened and closed credits and repayment behaviour)
and (ii) negative information (which is default data for the most part).
Information sharing bureaus are essential to enhance financial access in any economy
because they enable the mitigation of information asymmetry that restricts lenders from offering
credits. On the one hand, adverse selection issues are attenuated with information from credit
histories. On the other, moral hazard issues are also controlled by limiting default rates and
increasing repayment rates. Ultimately, the incremental volume in lending is essential for sectors
with limited financial access like micro, small and medium corporations.
Prior to 2008, information sharing bureaus were confined to a few countries in the
Organisation for Economic Cooperation and Development and Latin America (see Mylenko,
2008). However, the growth of information and communication technology has considerably
increased the presence of such information credit offices in Sub-Saharan Africa, North Africa
and the Middle and Eastern Europe. In Sub-Saharan, with the exception of South Africa, very
few countries possessed well functioning information sharing bureaus before 2008. Some nations
like Mozambique, Nigeria and Rwanda have instituted credit offices with the prime objective of
boosting banking sector supervision. Greater articulation is made on higher lending rates and due
accurate information most of the time. Before 2008, numerous initiatives were implemented
throughout Africa in order to institute private credit bureaus given demands for data by
supervisors to consolidate risk management practices on the one hand and on the other from
financial institutions. In response, many countries introduced information sharing bureaus,
namely: Ghana, Nigeria, Tanzania, Uganda and Zambia.
2.2 Theoretical highlights
As documented by Claus and Grimes (2003), two principal strands exist in the literature
on theoretical underpinnings for a linkage between financial intermediaries and information
sharing. The first strand shows liquidity provision by financial institutions while the second
focuses on the capacity of financial intermediaries to modify the risk characteristics of assets.
Both strands are founded on the essential economic role of financial intermediation which is to
augment efficiency in allocation by reducing the cost of conveying mobilised deposits from
depositors to borrowers. The theories underlying the mission of financial intermediation are
based on the literature of imperfect information in the market. Accordingly, the primary task of
financial intermediation is to reduce transaction and information costs arising from information
asymmetry between lenders and borrowers. Therefore, the establishment of information sharing
bureaus is a channel through which the reduction of information can be consolidated. The
underpinnings are consistent with pioneering literature on the relevance of information sharing in
financial intermediary efficiency, notably, on: models of credit rationing (see Williamson, 1986;
Stiglitz & Weiss, 1981; Jaffee & Russell, 1976), ex-post and ex-ante information asymmetry
(Diamond & Dybvig, 1983), communication on potential borrowers to investors by banks
(Leland & Pyle, 1977) and diversification with financial intermediaries (Diamond, 1984).
The association between information sharing bureaus and financial access can be seen
from the view of adverse selection (from lenders) on the one hand and the perspective of moral
hazard (from borrowers) on the other. Information sharing agencies provide lenders of financial
institutions with borrower information and credit histories which enable the reduction of
substantial interest rates that were previously the consequence of adverse selection on the part of
financial institutions. When borrowers are granted credit, they automatically become liable to
moral hazard because their economic activities related to granted credit could be concealed in
therefore the responsibility of credit bureaus to discipline borrowers on the severe consequences
of not complying with their periodic financial obligations. It is within this framework that
information sharing bureaus reduce moral hazard in borrowers, essentially by educating them on
the perils of debt defaults and resorting to the informal financial sector as a sustainable
alternative to the formal banking sector.
2.3 Empirical literature
A considerable bulk of empirical studies on information sharing has been oriented
towards the impact of creditors’ rights to more data on the one hand and the impact of reducing
information asymmetry among creditors on the other. The former orientation has for the most
part focused on the influence that stronger creditors’ rights have on, inter alia: capital structure (El Ghoul et al., 2012); bankruptcy (Cleassens & Klapper, 2005; Djankov et al., 2011) and more
risk-taking by financial institutions (Houston et al., 2010; Acharya et al., 2011). This last
orientation has revolved around investigating how sharing information consolidates credit
availability (Djankov et al., 2007; Brown et al., 2009; Triki & Gajigo, 2014), mitigates rates of
default (Jappelli & Pagano, 2002), reduces credit cost (Brown et al., 2009 ), affects syndicated
bank loans (Ivashina, 2009; Tanjung et al., 2010), impacts antitrust intervention (Coccorese,
2012) and affects corrupt-lending (Barth et al., 2009).
It is apparent from the above literature that inquiries have for the most part been
dedicated to developed countries which have comparatively less severe barriers to financial
access. Accordingly, while a substantial body of studies has been oriented toward the
Organisation of Economic Cooperation countries on the one hand and on the other, emerging
nations in Asia and Latin America, very little scholarly work has been devoted to Africa: a
continent with substantially higher constraints to financial access (Asongu et al., 2017).
Macroeconomic evidence on the influence of reducing information asymmetry has been
investigated by Galindo and Miller (2001) who concluded that developed countries with credit
registries are associated with lower levels of financial restrictions in comparison to their less
developed counterparts with credit bureaus. Specifically, public credit registries that are
performing well contribute considerably to reducing the sensitivity of decisions in investment for
A combination of private credit bureaus and public credit offices were employed by Love
and Mylenko (2000) with firm-based data from the World Bank Business Environment Survey.
They investigated whether financial access constraints are negatively related to credit registries.
The findings show that private credit bureaus are linked to higher financial access whereas
public credit registries have no significant impact on decreasing constraints in financial access.
Barth et al (2009) have investigated the effect of (i) information sharing and (ii) borrower
and lender competition on ‘lending corruption’ through information sharing bureaus using the World Bank Business Environment Survey from fifty-six nations. The data set consisted of 4000
corporations and private credit in one hundred and twenty-nine nations. Two main findings are
established. First, corrupt-lending is reduced by competition in banking and reducing
information asymmetry. Second, competition among firms and the legal environment have had
considerable effect on corrupt-lending.
Triki and Gajigo (2014) have investigated two principal issues, namely (i) the impact of
information sharing bureaus on corporations’ access to finance and (ii) the effect of public credit
registries’ design on the rate of constraint on financial access. The following key findings are apparent. First, access to finance is comparatively greater in countries with higher private credit
bureaus relative to countries with public credit registries or no information sharing office.
Second, there is considerable heterogeneity in financial access and on the design of information
sharing bureaus with public credit agencies.
Information sharing thresholds have been investigated by Asongu et al (2016). It was
established that information sharing bureaus have negative effects on financial depth, with the
impact from public credit registries comparatively more noticeable. Private credit bureaus have a
higher negative impact on banking system efficiency whereas public credit registries have an
insignificant effect. Information sharing bureaus have negative effects on financial activity, with
the impact from public credit registries being comparatively higher. The positive influence of
private credit bureaus on financial size is comparatively low.
3. Data and Methodology
3.1 Data
As has been said, this study examines a panel of 53 African countries with data for the
Database of the World Bank. The periodicity is constrained by data availability. Consistent with
Asongu et al. (2013), four financial development variables are used, namely: depth, efficiency,
activity and size. First, financial depth embodies (i) overall-economic depth (M2/GDP)1
representing the monetary base plus demand, savings and time deposits and (ii) financial system
deposits (Fdgdp). Distinguishing these two measurements is important because a substantial bulk
of the monetary base in developing nations does not circulate within the formal banking sector.
Second, financial allocation efficiency measures the ability of financial intermediaries to
transform mobilised deposits into credit for economic agents. Two measurements of efficiency
are used, namely (i) banking-system-efficiency (with bank credit on bank deposits: Bcbd’) and
(ii) financial-system-efficiency (‘financial system credit on financial system deposits: Fcfd’).
Third, financial activity is measured as the ability of financial institutions to provide credit to
economic agents. Two indicators are also used for this dimension of financial development,
namely (i) banking system activity (with ‘private domestic credit by deposit banks: Pcrb’) and
(ii) financial system activity (with ‘private credit by domestic banks and other financial institutions: Pcrbof”). Fourth, financial size is the as the ratio of ‘deposit bank assets’ to ‘total
assets’ (‘deposit bank assets on central bank assets plus deposit bank assets’: Dbacba). It is important to note that financial ratios which are dependent variables are mostly dimensions
identified by the Financial Development and Structure Database of the World Bank.
Consistent with recent information asymmetry literature, information sharing bureaus are
measured with public credit bureaus and private credit registries (Triki & Gajigo, 2014; Asongu
et al., 2016). Asongu et al. (2016) have documented six distinguishing characteristics between
public credit bureaus and private credit registries, notably: purpose, coverage, status, ownership,
data sources used and access. First, whereas private credit registries are made-up of public
institutions that are constituted within the framework of supervising the banking sector, public
credit bureaus are created in response to the need of and demand for information on borrowers in
the banking market. Hence, data from private credit registries, usually employed to examine the
credit-worthiness of clients, could also be acknowledged as a collateral benefit or by-product of
private credit registries. Second, while the coverage engendered by private credit registries is
restricted in terms of information (or data) type and history provided, public credit bureaus
extend beyond the scope of large corporations and include small and medium size enterprises
1
(SMEs) that are characterised with richer data and longer histories. Third, whereas public credit
bureaus are fundamentally focused on profit-making, private credit registries are not primarily
established for profit-making. Fourth, on the issue of ownership, whereas private credit registries
belong to governments and/or central banks, the ownership of public credit bureaus revolve
outside highlighted establishments (central banks and governments) to include lenders, lenders’ associates and independent third parties. Fifth, while the data used by private credit registries is
sourced from non-bank and bank financial establishments, data from public credit bureaus
entails: private credit registries, tax authorities, courts and utilities to sources employed by
private credit registries for information. Sixth, access to private credit registries (public credit
bureaus) is restricted to providers of information (open to all lender types).
The control variables are also consistent with the recent information asymmetry literature
(Asongu et al., 2016), namely: inflation, public investment, GDP growth, trade and foreign aid.
The selected covariates have also been substantially documented in the financial development
literature (Osabuohein et al., 2013; Huang, 2005; Asongu, 2014b).
First, foreign aid like remittances (Aggarwal et al., 2011; Efobi et al., 2014) could
increase financial development if it is not associated with activities that decrease their flow
within a country such as funds captured by developed countries for consultancy services and
deposited by corrupt officials from developing countries in tax havens that are under the
jurisdictions of developed countries.
Second, there is an abundant supply of literature which has established a positive
growth-finance relationship (see Saint-Paul, 1992; Greenwood & Jovanovic, 1990; Owosu & Odhiambo,
2014; Nyasha & Odhiambo, 2015ab). According to them, economic growth is linked to
decreasing cost in financial intermediation which is the outcome of higher compensation that
entails growing financial resources that are devoted for the purpose of investment. Moreover, the
importance of income levels in financial development has been established in both broad
(Levine, 1997) and African-specific (Asongu, 2012) studies. Whereas Asongu has shown that
countries with high income are linked to greater financial development levels in Africa, it has
been concluded by Jaffee and Levonian (2001) that higher income countries are associated with
more developed banking system structures. It is important to balance the engaged narrative with
the fact that growth may be linked to financial crises that ultimately reduce financial
Third, there is a branch of the literature sympathetic to the perspective that policies which
are friendly to openness (like trade) are positively linked to financial development (see Huang &
Temple, 2005; Do & Levchenko, 2004).
Fourth, the nexus between investment and financial development has been assessed by
Huang (2011) who found a positive connection.
Fifth, some main domestic macroeconomic policies, such as the keeping of inflation
levels stable/low are needed for financial development (Huang, 2011; Boyd et al., 2001;
Huybens & Smith, 1999). Accordingly, Huybens and Smith (1999) and Boyd et al. (2001) have
respectively shown theoretically and empirically that nations with chaotic/high inflations are
very likely to be associated with smaller, less efficient and less active financial institutions.
It is important to note that the expected signs of covariates cannot be established without
uncertainty because the corresponding financial development variables are conflicting by
definition and measurement. For example, financial efficiency is measured as the ratio of
financial activity (credit) on financial depth (deposits). The definitions and sources of the
variables are disclosed in Appendix 1, the summary statistics in Appendix 2 and the correlation
matrix in Appendix 3.
3.2 Methodology
Consistent with the research question which is to assess the influence of information
sharing offices on financial access when existing financial development levels matter, the study
accounts for existing levels of financial development by employing a Quantile Regressions
estimation technique which has been documented to account for initial levels in dependent
variables (see Billger & Goel, 2009; Okada & Samreth, 2012; Asongu & Nwachukwu, 2017)
when information sharing bureaus are examined throughout the conditional distributions of the
outcome variable (Keonker & Hallock, 2001).
Previous literature on information sharing has examined the relationship between
information sharing bureaus and financial development by engaging parameter estimates at the
conditional mean of financial development variables (Triki & Gajigo, 2014; Asongu et al.,
2016). Whereas mean impacts are relevant, the underlying literature is extended by employing
Ordinary Least Squares-related regressions are based on the hypothesis that financial access
variables and error terms are normally distributed, such an assumption of error terms that are
normally distributed does not hold with Quantile Regressions.
The Quantile Regressions models parameter estimates at numerous points of the
conditional distirbution of financial access. Therefore, the technique is in conformity with the
motivation of distinguishing nations with high, intermediate and low initial levels of financial
development.
The th quantile estimator of a financial access variable is derived by solving for the
optimization problem in Eq (1) that is shown without subscripts for simplicity and ease of
presentation.
i i i i i i k x y i i i x y i i iR
y
x
y
x
: :
)
1
(
min
(1)Where
0,1 . As opposed to Ordinary Least Squares which is fundamentally based onminimizing the sum of squared residuals, with Quantile Regressions the weighted sum of
absolute deviations are minimised. For instance the 25th or 75th quartiles (with =0.25 or 0.75
respectively) are estimated by approximately weighing the residuals. The conditional quintile of
financial development oryigiven xiis:
i i
y x x
Q ( / ) (2)
Where unique slope parameters are modelled for each th specific quintile. This
formulation is analogous to E(y/x) xi in the Ordinary Least Squares slope where
parameters are investigated only at the mean of the conditional distribution of financial
development. For the model in Eq (2), the dependent variable yi is a financial development
indicator while xi contains a constant term, foreign aid, trade, GDP growth, public investment
and inflation. As specified in Eq. (2), the linearity in quantiles is appropriate under the
assumption of homoscedasticity. This is essentially because if there is heteroscedasticity in the
4. Empirical results
4.1 Financial development and Public Credit Registries
Table 1, Table 2, Table 3 and Table 4 respectively disclose results corresponding to financial
depth, financial allocation efficiency, financial activity and financial size. Irrespective of tables,
the left-hand-side (LHS) presents contemporary estimation whereas the right-hand-side (RHS)
presents non-contemporary estimations. The motivation for lagging the independent variables on
the RHS by one year is to account for endogeneity (see Mlachila et al., 2014; Asongu et al.,
2016). The consistent variations in information sharing estimates between Ordinary Least
Squares and Quantile Regressions (with respect to sign, significance and magnitude of
significance) is a justification for the relevance of the problem statement, notably investigating
the incidence of increasing information sharing offices for financial development when existing
levels of financial development matter.
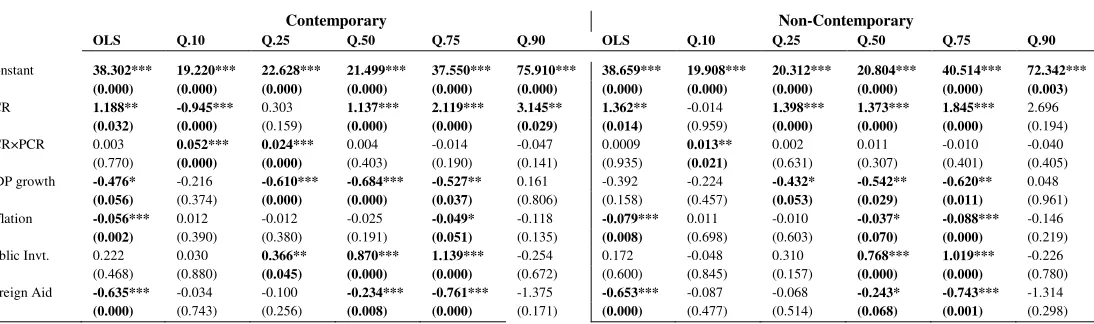
The findings are explained in three levels, namely, in terms of marginal effect, net effect
and thresholds. The net effect of increasing public credit registries in the 0.10th quintile on the
LHS of Table 1 is computed with conditional and unconditional effects of public credit
registries. Accordingly, the marginal or conditional effect (from the interaction) is 0.052 while
the unconditional impact of public credit registries is -0.945. Hence, the corresponding net effect
of increasing public credit registries is -0.832 ([2.155×0.052] + -0.945)2. Given that the
conditional or marginal impact is positive, the correspond threshold in public credit registries at
which the negative unconditional effect changes from negative to positive is 18.173
(0.945/0.052). The positive threshold is feasible because it is within the public credit registries
range (minimum to maximum) disclosed by the summary statistics (0.00 to 49.80).
It is important to note that whereas the computation of net effects requires statistically
significant unconditional and conditional effects, a threshold may be apparent even when only
the conditional effect is significant. Consistent with Asongu and De Moor (2017), the notion of
threshold is in accordance with Cummins (2000) on the minimum level/threshold in language
proficiency before rewards are acquired in a second language. In addition, the definition of
threshold is also supported by the critical mass theory which has been abundantly documented in
the literature on economic development (see Roller & Waverman, 2001; Ashraf & Galor, 2013).
A recent application of the threshold or critical mass theory based on interaction variables can be
2
found in Batuo (2015). Therefore, from the perspective of this study, the concept of threshold is
not different from: (i) the minimum requirement for the reaping of positive effects (Cummins,
2000); (ii) conditions for U-shape and inverted U-shape (Ashraf & Galor, 2013) and (iii) critical
mass for positive impacts (Roller & Waverman, 2001; Batuo, 2015).
Two key results can be established from Table 1 on linkages between financial depth and
public credit registries. First, in Panel A on money supply (i) there are positive thresholds in the
10th decile with corresponding negative net effects and (ii) there is a synergy effect in the 25th
quartile on the LHS. Second, in Panel B, most significant results are apparent between in the
10th decile and 50th quartile with (i) both negative (positive) net effects in the 10th (25th) decile
(quartile) and (ii) both positive and synergy effects in the 10th decile and 25th quartile and
consistent synergy impacts in the 50th quartile.
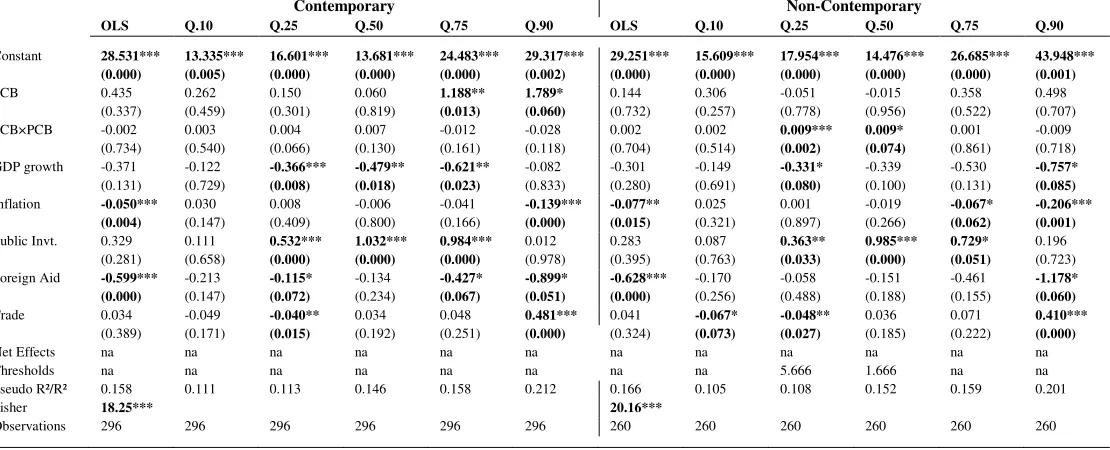
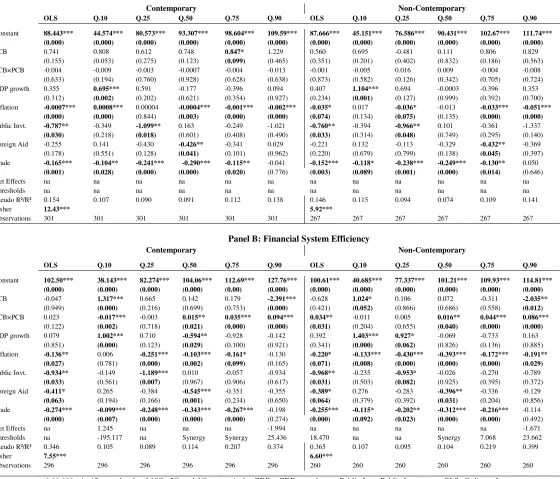
The following findings can be established from Table 2 on linkages between financial
efficiency and public credit registries. In Panel A (on banking system efficiency) and Panel B
(on financial system efficiency), most of the significant estimates are between the 25th and 75th
quartiles, with positive net effects and negative thresholds that are not within range.
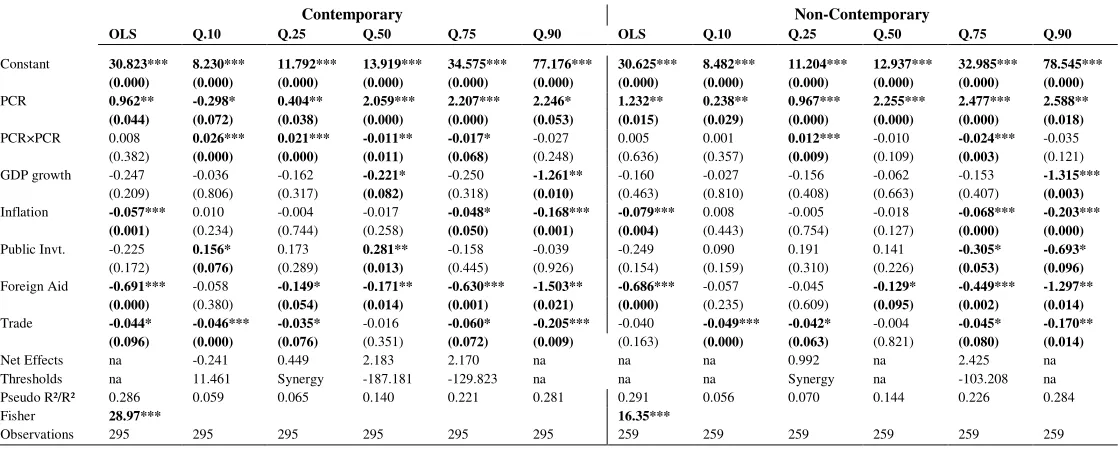
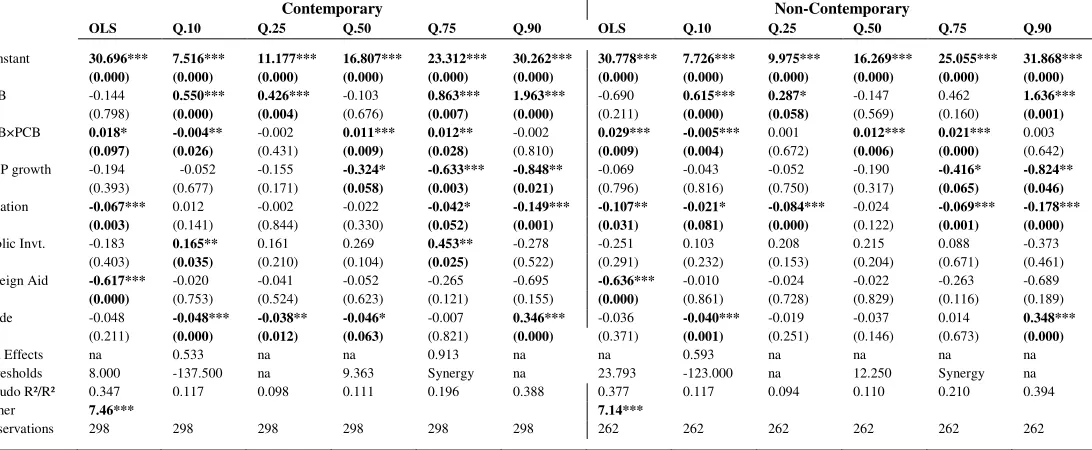
The main outcome from Table 3 on linkages between financial activity and public credit
registries is shown in Panel A (on banking system activity) and Panel B (on financial system
activity). It is noteworthy that most of the significant estimates are between the 25th and 75th
[image:15.612.37.584.546.708.2]quartiles, with positive net effects and negative thresholds that are not within range.
Table 1: Financial Depth and Public Credit Registries (PCR)
Financial Depth
Panel A: Overall Economic Depth (Money Supply)
Contemporary Non-Contemporary
OLS Q.10 Q.25 Q.50 Q.75 Q.90 OLS Q.10 Q.25 Q.50 Q.75 Q.90
Constant 38.302*** 19.220*** 22.628*** 21.499*** 37.550*** 75.910*** 38.659*** 19.908*** 20.312*** 20.804*** 40.514*** 72.342***
(0.000) (0.000) (0.000) (0.000) (0.000) (0.000) (0.000) (0.000) (0.000) (0.000) (0.000) (0.003)
PCR 1.188** -0.945*** 0.303 1.137*** 2.119*** 3.145** 1.362** -0.014 1.398*** 1.373*** 1.845*** 2.696
(0.032) (0.000) (0.159) (0.000) (0.000) (0.029) (0.014) (0.959) (0.000) (0.000) (0.000) (0.194)
PCR×PCR 0.003 0.052*** 0.024*** 0.004 -0.014 -0.047 0.0009 0.013** 0.002 0.011 -0.010 -0.040 (0.770) (0.000) (0.000) (0.403) (0.190) (0.141) (0.935) (0.021) (0.631) (0.307) (0.401) (0.405) GDP growth -0.476* -0.216 -0.610*** -0.684*** -0.527** 0.161 -0.392 -0.224 -0.432* -0.542** -0.620** 0.048
(0.056) (0.374) (0.000) (0.000) (0.037) (0.806) (0.158) (0.457) (0.053) (0.029) (0.011) (0.961)
Inflation -0.056*** 0.012 -0.012 -0.025 -0.049* -0.118 -0.079*** 0.011 -0.010 -0.037* -0.088*** -0.146
(0.002) (0.390) (0.380) (0.191) (0.051) (0.135) (0.008) (0.698) (0.603) (0.070) (0.000) (0.219)
Public Invt. 0.222 0.030 0.366** 0.870*** 1.139*** -0.254 0.172 -0.048 0.310 0.768*** 1.019*** -0.226 (0.468) (0.880) (0.045) (0.000) (0.000) (0.672) (0.600) (0.845) (0.157) (0.000) (0.000) (0.780) Foreign Aid -0.635*** -0.034 -0.100 -0.234*** -0.761*** -1.375 -0.653*** -0.087 -0.068 -0.243* -0.743*** -1.314
Trade -0.012 -0.038 -0.016 0.042* -0.023 -0.115 -0.005 -0.037 -0.002 0.060* -0.012 -0.054 (0.734) (0.111) (0.482) (0.053) (0.547) (0.393) (0.891) (0.205) (0.917) (0.070) (0.746) (0.775) Net Effects na -0.832 na na na na na na na na na na Thresholds na 18.173 Synergy na na na na 1.076 na na na na Pseudo R²/R² 0.222 0.054 0.072 0.146 0.211 0.233 0.223 0.047 0.068 0.145 0.200 0.224
Fisher 27.88*** 15.21***
Observations 295 295 295 295 295 295 259 259 259 259 259 259
Panel B: Financial System Depth (Liquid Liabilities)
Contemporary Non-Contemporary
OLS Q.10 Q.25 Q.50 Q.75 Q.90 OLS Q.10 Q.25 Q.50 Q.75 Q.90
Constant 32.242*** 13.860*** 14.292*** 13.412*** 37.863*** 60.561*** 32.423*** 12.728*** 13.787*** 14.585*** 37.179*** 61.396***
(0.000) (0.000) (0.000) (0.000) (0.000) (0.000) (0.000) (0.001) (0.000) (0.000) (0.000) (0.000)
PCR 0.738 -0.889*** -0.203 0.394 2.083*** 2.283* 0.903 -0.758** 0.804*** 0.236 1.811** 1.938*
(0.166) (0.008) (0.198) (0.143) (0.001) (0.052) (0.107) (0.013) (0.000) (0.508) (0.016) (0.078)
PCR×PCR 0.013 0.050*** 0.033*** 0.018*** -0.016 -0.033 0.011 0.046*** 0.014*** 0.041*** -0.010 -0.029 (0.226) (0.000) (0.000) (0.003) (0.245) (0.207) (0.383) (0.000) (0.001) (0.000) (0.536) (0.235) GDP growth -0.362 -0.192 -0.443*** -0.443** -0.747** -0.497 -0.305 -0.229 -0.343* -0.374* -0.355 -0.577
(0.139) (0.518) (0.000) (0.014) (0.022) (0.352) (0.260) (0.486) (0.059) (0.085) (0.302) (0.282) Inflation -0.039** 0.023 0.002 -0.007 -0.059* -0.124* -0.055** 0.018 0.003 -0.025 -0.075** -0.172**
(0.014) (0.189) (0.830) (0.740) (0.068) (0.052) (0.022) (0.413) (0.817) (0.180) (0.028) (0.016)
Public Invt. 0.315 0.105 0.513*** 0.999*** 0.966*** 0.358 0.300 0.013 0.321** 0.934*** 0.880*** 0.006 (0.278) (0.662) (0.000) (0.000) (0.001) (0.461) (0.350) (0.959) (0.046) (0.000) (0.000) (0.989) Foreign Aid -0.690*** -0.223* -0.065 -0.219** -0.882*** -1.380* -0.705*** -0.213* -0.010 -0.281** -0.776** -1.254
(0.000) (0.075) (0.314) (0.029) (0.002) (0.092) (0.000) (0.084) (0.886) (0.021) (0.013) (0.108)
Trade -0.012 -0.031 0.003 0.054** -0.025 0.010 -0.005 -0.004 0.0003 0.063** -0.021 0.082 (0.710) (0.271) (0.850) (0.031) (0.617) (0.924) (0.880) (0.888) (0.985) (0.034) (0.720) (0.449) Net Effects na -0.781 na na na na na -0.568 0.834 na na na Thresholds na 17.78 6.151 Synergy na na na 16.478 Synergy Synergy na na Pseudo R²/R² 0.231 0.049 0.060 0.127 0.200 0.246 0.228 0.041 0.055 0.124 0.195 0.238
Fisher 20.46*** 12.07***
Observations 295 295 295 295 295 295 259 259 259 259 259 259
[image:16.612.43.586.166.390.2]*,**,***: significance levels of 10%, 5% and 1% respectively. GDPg: GDP growth rate. Public Invt: Public Investment. OLS: Ordinary Least Squares. R² for OLS and Pseudo R² for quantile regression. Lower quantiles (e.g., Q 0.1) signify nations where financial depth is least. na: not applicable because corresponding estimates needed for computation are not significant.
Table 2: Financial Efficiency and Public Credit Registries (PCR)
Financial Efficiency
Panel A: Banking System Efficiency
Contemporary Non-Contemporary
OLS Q.10 Q.25 Q.50 Q.75 Q.90 OLS Q.10 Q.25 Q.50 Q.75 Q.90
Constant 94.940*** 51.283*** 75.054*** 97.130*** 108.35*** 136.29*** 92.993*** 53.000*** 74.958*** 90.832*** 107.44*** 141.33***
(0.000) (0.000) (0.000) (0.000) (0.000) (0.000) (0.000) (0.000) (0.000) (0.000) (0.000) (0.000)
PCR 1.553*** 1.476** 2.380*** 1.695*** 1.846*** 0.219 1.798*** 1.716** 2.513*** 1.739*** 1.996** 0.406
(0.003) (0.021) (0.001) (0.003) (0.009) (0.813) (0.001) (0.017) (0.001) (0.001) (0.033) (0.748)
PCR×PCR -0.022** -0.004 -0.033** -0.020 -0.028* -0.009 -0.026** -0.020 -0.033 -0.019 -0.031 -0.011
(0.038) (0.738) (0.037) (0.146) (0.072) (0.605) (0.028) (0.182) (0.062) (0.100) (0.126) (0.677)
GDP growth 0.274 0.754** 0.089 -0.416 -0.290 0.604 0.308 1.295*** 0.544 0.097 -0.570 -0.199 (0.459) (0.046) (0.836) (0.825) (0.589) (0.332) (0.394) (0.000) (0.202) (0.781) (0.425) (0.811) Inflation -0.0008*** 0.0008*** 0.00009 -0.0007*** -0.001*** -0.002*** -0.035* 0.022*** -0.031 -0.013* -0.032*** -0.058***
(0.000) (0.000) (0.650) (0.000) (0.000) (0.000) (0.064) (0.001) (0.091) (0.083) (0.003) (0.000)
Public Invt. -0.897** -0.422 -0.364 -0.630* -0.909* -1.151*** -0.806** -0.461 -0.441 -0.593 -0.528 -1.307**
(0.010) (0.236) (0.422) (0.074) (0.065) (0.003) (0.015) (0.410) (0.327) (0.068) (0.258) (0.012)
Foreign Aid -0.531*** 0.094 -0.249 -0.334 -0.524* -1.244*** -0.442** 0.093 -0.217 -0.242 -0.487 -1.322**
(0.007) (0.663) (0.364) (0.120) (0.075) (0.002) (0.018) (0.759) (0.412) (0.219) (0.143) (0.012)
Trade -0.200*** -0.182*** -0.243*** -0.274*** -0.197*** -0.144* -0.191*** -0.227*** -0.252*** -0.229*** -0.194** -0.172
(0.000) (0.000) (0.000) (0.000) (0.004) (0.096) (0.000) (0.002) (0.000) (0.000) (0.016) (0.121)
Net Effects 1.505 na 1.632 na 1.785 na 1.741 na na na na na Thresholds -70.590 na -72.121 na -65.928 na -69.153 na na na na na Pseudo R²/R² 0.123 0.105 0.107 0.098 0.065 0.105 0.136 0.127 0.121 0.097 0.079 0.117
Observations 300 300 300 300 300 300 266 266 266 266 266 266
Panel B: Financial System Efficiency
Contemporary Non-Contemporary
OLS Q.10 Q.25 Q.50 Q.75 Q.90 OLS Q.10 Q.25 Q.50 Q.75 Q.90
Constant 118.54*** 52.173*** 80.562*** 102.34*** 115.69*** 172.58*** 116.25*** 50.204*** 76.552*** 99.911*** 109.99*** 170.07***
(0.000) (0.000) (0.000) (0.000) (0.000) (0.000) (0.000) (0.000) (0.000) (0.000) (0.000) (0.000)
PCR 0.725 1.690** 2.147*** 1.386*** 1.539* -0.676 0.906 1.993*** 2.359*** 1.924*** 2.018** -0.823 (0.248) (0.016) (0.002) (0.003) (0.053) (0.747) (0.183) (0.008) (0.001) (0.000) (0.015) (0.778) PCR×PCR -0.006 -0.010 -0.027* -0.016 -0.023 0.003 -0.008 -0.022 -0.031* -0.024*** -0.032* 0.025
(0.633) (0.460) (0.072) (0.137) (0.191) (0.942) (0.553) (0.168) (0.055) (0.006) (0.076) (0.681) GDP growth -0.216 0.851*** 0.125 -0.818*** -0.999 -0.838 0.053 1.543*** 0.595 0.049 -0.661 -0.684
(0.631) (0.005) (0.780) (0.008) (0.115) (0.464) (0.902) (0.000) (0.119) (0.849) (0.274) (0.681) Inflation -0.161*** -0.148*** -0.031 -0.114*** -0.172 -0.257*** -0.235** -0.150** -0.246*** -0.291*** -0.164*** -0.323***
(0.004) (0.000) (0.463) (0.003) (0.112) (0.001) (0.022) (0.014) (0.000) (0.000) (0.000) (0.004)
Public Invt. -0.976** -0.530 -0.528 -0.374 -0.838 -1.287* -0.958** -0.339 -0.418 -0.479** -0.517 -1.283
(0.020) (0.149) (0.223) (0.175) (0.130) (0.075) (0.023) (0.439) (0.318) (0.045) (0.317) (0.208)
Foreign Aid -1.116*** 0.072 -0.431* -0.556*** -0.510 -1.678* -1.045*** 0.194 -0.239 -0.445*** -0.288 -1.637
(0.002) (0.769) (0.092) (0.001) (0.133) (0.071) (0.004) (0.531) (0.338) (0.002) (0.357) (0.212)
Trade -0.315*** -0.172*** -0.261*** -0.283*** -0.231*** -0.288* -0.305*** -0.234*** -0.250*** -0.299*** -0.225*** -0.320
(0.000) (0.000) (0.000) (0.000) (0.002) (0.053) (0.000) (0.001) (0.000) (0.000) (0.002) (0.116)
Net Effects na na 2.088 na na na na na 2.292 1.872 1.949 na Thresholds na na -79.518 na na na na na -76.096 -80.166 -63.062 na Pseudo R²/R² 0.127 0.094 0.114 0.105 0.054 0.099 0.126 0.114 0.117 0.100 0.060 0.094
Fisher 8.87*** 7.28***
Observations 295 295 295 295 295 295 259 259 259 259 259 259
[image:17.612.29.588.477.706.2]*,**,***: significance levels of 10%, 5% and 1% respectively. GDPg: GDP growth rate. Public Invt: Public Investment. OLS: Ordinary Least Squares. R² for OLS and Pseudo R² for quantile regression. Lower quantiles (e.g., Q 0.1) signify nations where financial efficiency is least. na: not applicable because corresponding estimates needed for computation are not significant.
Table 3: Financial Activity and Public Credit Registries (PCR)
Financial Activity
Panel A: Banking System Activity
Contemporary Non-Contemporary
OLS Q.10 Q.25 Q.50 Q.75 Q.90 OLS Q.10 Q.25 Q.50 Q.75 Q.90
Constant 30.823*** 8.230*** 11.792*** 13.919*** 34.575*** 77.176*** 30.625*** 8.482*** 11.204*** 12.937*** 32.985*** 78.545***
(0.000) (0.000) (0.000) (0.000) (0.000) (0.000) (0.000) (0.000) (0.000) (0.000) (0.000) (0.000)
PCR 0.962** -0.298* 0.404** 2.059*** 2.207*** 2.246* 1.232** 0.238** 0.967*** 2.255*** 2.477*** 2.588**
(0.044) (0.072) (0.038) (0.000) (0.000) (0.053) (0.015) (0.029) (0.000) (0.000) (0.000) (0.018)
PCR×PCR 0.008 0.026*** 0.021*** -0.011** -0.017* -0.027 0.005 0.001 0.012*** -0.010 -0.024*** -0.035 (0.382) (0.000) (0.000) (0.011) (0.068) (0.248) (0.636) (0.357) (0.009) (0.109) (0.003) (0.121) GDP growth -0.247 -0.036 -0.162 -0.221* -0.250 -1.261** -0.160 -0.027 -0.156 -0.062 -0.153 -1.315***
(0.209) (0.806) (0.317) (0.082) (0.318) (0.010) (0.463) (0.810) (0.408) (0.663) (0.407) (0.003)
Inflation -0.057*** 0.010 -0.004 -0.017 -0.048* -0.168*** -0.079*** 0.008 -0.005 -0.018 -0.068*** -0.203***
(0.001) (0.234) (0.744) (0.258) (0.050) (0.001) (0.004) (0.443) (0.754) (0.127) (0.000) (0.000)
Public Invt. -0.225 0.156* 0.173 0.281** -0.158 -0.039 -0.249 0.090 0.191 0.141 -0.305* -0.693*
(0.172) (0.076) (0.289) (0.013) (0.445) (0.926) (0.154) (0.159) (0.310) (0.226) (0.053) (0.096)
Foreign Aid -0.691*** -0.058 -0.149* -0.171** -0.630*** -1.503** -0.686*** -0.057 -0.045 -0.129* -0.449*** -1.297**
(0.000) (0.380) (0.054) (0.014) (0.001) (0.021) (0.000) (0.235) (0.609) (0.095) (0.002) (0.014)
Trade -0.044* -0.046*** -0.035* -0.016 -0.060* -0.205*** -0.040 -0.049*** -0.042* -0.004 -0.045* -0.170**
(0.096) (0.000) (0.076) (0.351) (0.072) (0.009) (0.163) (0.000) (0.063) (0.821) (0.080) (0.014)
Net Effects na -0.241 0.449 2.183 2.170 na na na 0.992 na 2.425 na Thresholds na 11.461 Synergy -187.181 -129.823 na na na Synergy na -103.208 na Pseudo R²/R² 0.286 0.059 0.065 0.140 0.221 0.281 0.291 0.056 0.070 0.144 0.226 0.284
Fisher 28.97*** 16.35***
Panel B: Financial System Activity
Contemporary Non-Contemporary
OLS Q.10 Q.25 Q.50 Q.75 Q.90 OLS Q.10 Q.25 Q.50 Q.75 Q.90
Constant 41.611*** 7.677*** 11.309*** 13.722*** 35.390*** 78.668*** 41.452*** 7.924*** 10.568*** 13.352*** 34.324*** 79.159***
(0.000) (0.000) (0.000) (0.000) (0.000) (0.000) (0.000) (0.000) (0.000) (0.000) (0.000) (0.000)
PCR 0.570 -0.142 0.522*** 2.066*** 2.409*** 2.257 0.822 0.193 0.912*** 2.175*** 2.553*** 2.631 (0.316) (0.371) (0.002) (0.000) (0.000) (0.186) (0.183) (0.173) (0.000) (0.000) (0.000) (0.175) PCR×PCR 0.016 0.020*** 0.020*** -0.011*** -0.023* -0.027 0.014 0.004 0.013*** -0.007 -0.026*** -0.036
(0.163) (0.000) (0.000) (0.007) (0.064) (0.421) (0.324) (0.101) (0.000) (0.259) (0.008) (0.372) GDP growth -0.349 -0.012 -0.125 -0.230* -0.219 -1.256** -0.258 -0.035 -0.185 -0.088 -0.177 -1.325*
(0.179) (0.927) (0.356) (0.055) (0.468) (0.045) (0.364) (0.812) (0.148) (0.551) (0.454) (0.087)
Inflation -0.073*** 0.015* 0.001 -0.015 -0.046 -0.168*** -0.101*** 0.011 -0.036* -0.018 -0.068*** -0.202**
(0.000) (0.050) (0.877) (0.300) (0.135) (0.008) (0.003) (0.441) (0.089) (0.145) (0.001) (0.017)
Public Invt. -0.178 0.174** 0.233* 0.312*** -0.227 -0.080 -0.220 0.141 0.263* 0.183 -0.359* -0.567 (0.420) (0.037) (0.083) (0.004) (0.408) (0.885) (0.354) (0.423) (0.096) (0.163) (0.081) (0.397) Foreign Aid -1.032*** -0.026 -0.049 -0.170** -0.643*** -1.506* -1.026*** -0.011 -0.020 -0.141* -0.428** -1.273
(0.000) (0.675) (0.451) (0.010) (0.009) (0.073) (0.000) (0.862) (0.767) (0.083) (0.020) (0.171)
Trade -0.105** -0.052*** -0.054*** -0.018 -0.060 -0.217** -0.100** -0.048*** -0.036** -0.008 -0.054 -0.184
(0.010) (0.000) (0.001) (0.273) (0.169) (0.032) (0.023) (0.000) (0.045) (0.657) (0.102) (0.132)
Net Effects na na 0.565 2.042 2.359 na na na 0.940 na 2.496 na Thresholds na 7.100 Synergy -187.181 -104.739 na na na Synergy na -98.192 na Pseudo R²/R² 0.187 0.054 0.059 0.119 0.174 0.213 0.186 0.051 0.063 0.122 0.178 0.210
Fisher 19.41*** 11.35***
Observations 297 297 297 297 297 297 261 261 261 261 261 261
[image:18.612.30.589.455.694.2]*,**,***: significance levels of 10%, 5% and 1% respectively. GDPg: GDP growth rate. Public Invt: Public Investment. OLS: Ordinary Least Squares. R² for OLS and Pseudo R² for quantile regression. Lower quantiles (e.g., Q 0.1) signify nations where financial activity is least. na: not applicable because corresponding estimates needed for computation are not significant.
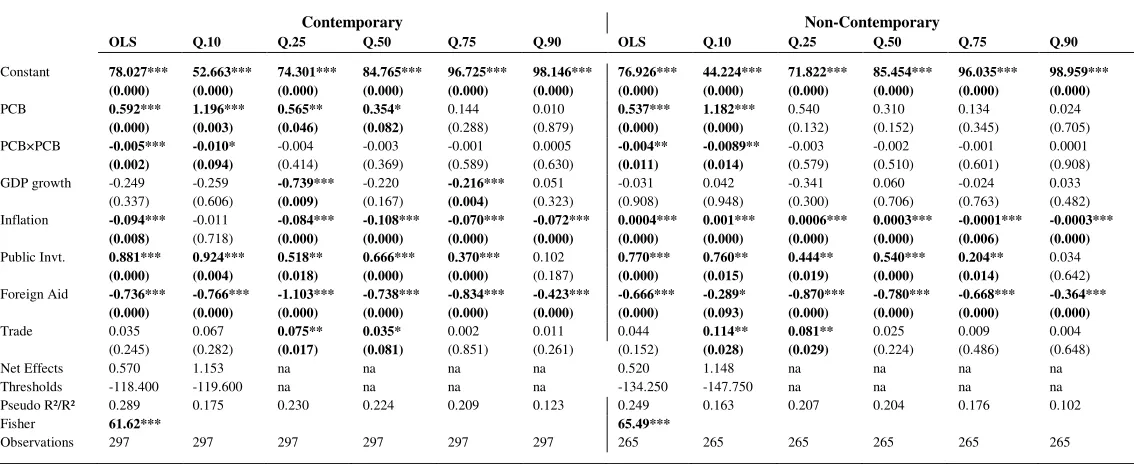
Table 4: Financial Size and Public Credit Registries (PCR)
Financial Size
Contemporary Non-Contemporary
OLS Q.10 Q.25 Q.50 Q.75 Q.90 OLS Q.10 Q.25 Q.50 Q.75 Q.90
Constant 80.591*** 49.414*** 73.926*** 93.805*** 98.821*** 95.953*** 79.225*** 41.011*** 75.023*** 91.065*** 97.709*** 98.665***
(0.000) (0.000) (0.000) (0.000) (0.000) (0.000) (0.000) (0.000) (0.000) (0.000) (0.000) (0.000)
PCR 1.201*** 1.514 1.489*** 0.660* 0.330** 0.173 1.329*** 2.956*** 1.422*** 0.755** 0.321*** 0.142
(0.000) (0.171) (0.000) (0.092) (0.027) (0.134) (0.000) (0.000) (0.000) (0.029) (0.008) (0.349)
PCR×PCR -0.021*** -0.018 -0.026*** -0.010 -0.006* -0.004* -0.025*** -0.081*** -0.026*** -0.016 -0.006** -0.003
(0.000) (0.360) (0.002) (0.269) (0.051) (0.090) (0.000) (0.000) (0.005) (0.103) (0.011) (0.284)
GDP growth -0.293 -0.358 -0.761*** -0.361 -0.294*** -0.002 -0.098 -0.023 -0.571* -0.246 -0.024 -0.131*
(0.242) (0.669) (0.006) (0.185) (0.000) (0.956) (0.700) (0.974) (0.085) (0.232) (0.684) (0.074)
Inflation -0.087*** -0.022 -0.084*** -0.118*** -0.076*** -0.074*** 0.0004*** 0.001*** 0.0005*** 0.0001* -0.00005* -0.0003***
(0.006) (0.713) (0.001) (0.000) (0.000) (0.000) (0.000) (0.000) (0.000) (0.062) (0.067) (0.000)
Public Invt. 0.756*** 0.693 0.466* 0.569** 0.377*** 0.424*** 0.700*** 0.768** 0.314 0.562*** 0.302*** 0.241***
(0.000) (0.153) (0.083) (0.019) (0.000) (0.000) (0.000) (0.010) (0.109) (0.006) (0.000) (0.000)
Foreign Aid -0.844*** -0.629* -1.088*** -1.020*** -0.938*** -0.487*** -0.767*** -0.256 -0.942*** -0.968*** -0.884*** -0.417***
(0.000) (0.096) (0.000) (0.000) (0.000) (0.000) (0.000) (0.157) (0.000) (0.000) (0.000) (0.000)
Trade 0.021 0.139 0.080** -0.024 -0.006 0.022** 0.029 0.136** 0.077** 0.001 -0.004 0.004 (0.489) (0.224) (0.026) (0.497) (0.624) (0.010) (0.358) (0.038) (0.046) (0.959) (0.715) (0.647) Net Effects 1.155 na 1.432 na 0.317 na 1.275 2.781 1.365 na 0.308 na Thresholds -57.190 na -57.269 na -55.000 -43.250 -53.160 -36.493 -54.962 na -53.500 na Pseudo R²/R² 0.271 0.120 0.208 0.203 0.210 0.121 0.239 0.122 0.186 0.190 0.177 0.097
Fisher 22.27*** 23.61***
*,**,***: significance levels of 10%, 5% and 1% respectively. GDPg: GDP growth rate. Public Invt: Public Investment. OLS: Ordinary Least Squares. R² for OLS and Pseudo R² for quantile regression. Lower quantiles (e.g., Q 0.1) signify nations where financial size is least. na: not applicable because corresponding estimates needed for computation are not significant.
In Table 4 on the connections between financial size and public credit registries, most of
the significant estimates are between the 25th and 75th quartiles, with positive net effects and
negative thresholds that are not within range.
Most of the significant control variables have the expected signs. It is important to note
that some of the signs may vary from one table to another because the financial development
variables are by definition contradictory. The financial development variable of Table 2
(financial efficiency) is the ratio of the financial development variable in Table 3 (financial
credit) to the financial development variable in Table 1(financial deposits).
4. 2 Financial Development and Private Credit Bureaus
Table 5, Table 6, Table 7 and Table 8 respectively disclose results corresponding to
financial depth, financial allocation efficiency, financial activity and financial size. Irrespective
of tables, the left-hand-side (LHS) presents contemporary estimation whereas the right-hand-side
(RHS) presents non-contemporary estimations. Contrary to the findings in Tables 1-4 on public
credit registries, the marginal, threshold and net effects of private credit bureaus in Tables 5-8
are not clearly apparent. In order to examine why findings corresponding to private credit
bureaus are not significant, we assess country-specific averages of information sharing offices
which we disclosed in Appendix 4. From these country-specific averages, it is reasonable to infer
that the findings on private credit bureaus are not very significant because of issues in degrees of
freedom. Hence, the concluding implications that follow are essentially based on findings
connected to public credit registries.
5. Concluding Implications, Caveats and Future Research Directions
The purpose of this study has been to investigate how increasing information sharing
bureaus affect financial access. For this purpose, we have employed contemporary and
non-contemporary interactive Quantile Regressions in 53 African countries for the period 2004-2011.
Information sharing bureaus are proxied with public credit registries and private credit bureaus.
system levels), efficiency (at banking and financial system levels), activity (from banking and
financial system perspectives) and size are used. The following findings have been established.
First, the incidence of increasing private credit bureaus is not very apparent on financial
access probably because private credit bureaus are still to be established in many countries.
Second, increasing public credit registries improve financial allocation efficiency and activity (or
credit) between the 25th and 75th quartiles for the most part. This result is intuitive because for
poorly developed financial systems, increasing information sharing bureaus may in some cases
decrease the pace of development, whereas for more developed financial systems, information
sharing may already have been taken into account.
As a main policy implication, countries in the top (or highest levels of financial
development) and bottom (or lowest levels of financial development) ends of the financial
efficiency and activity distributions are unlikely to benefit from enhanced financial allocation
efficiency owing to increasing public credit registries. While the absence of positive net effects
in the top quantiles may be traced to diseconomies of scale in public credit registries, the absence
of positive net impacts in bottom quantiles could be traceable to the fact that certain levels of
financial efficiency and activity are required before the benefits of increasing public credit
registries can be achieved in terms of increasing financial access.
On the relationship between established findings and the literature, two angles are
apparent. On the one hand, the findings are broadly consistent with Singh et al. (2009) who
found that African countries with information sharing mechanisms for banks are associated with
higher levels of financial development. The findings are also aligned with those of Galindo and
Miller (2001) in the view that credit registries are more likely to enhance financial development
compared to credit bureaus in less developed countries. On the other hand, our results appear not
to be broadly in line with those of Love and Mylenko (2003) who argued that whereas the
presence of private registries are associated with a higher share of bank lending and lower
constraints on finance, public registries do not have a significant effect on financing constraints.
Our results do not also align with Triki and Gajigo (2014) who concluded that private credit
bureaus are more positively sensitive to finance access, compared to public credit registries.
Asongu et al. (2016) found that information sharing offices negatively affect financial access,
for the most part while Asongu et al. (2017) concluded that financial development dynamics
There are three main shortcomings in the merit emphasis. First, we have not reported QR
coefficients with which to substantiate the analysis in the study. Accordingly, we adopted a
minimalist approach in the interpretation of estimated coefficients. The minimalist approach is
based on the understanding that net effects are computed from corresponding significant
estimated coefficients and policy inferences are based on net effects. The tables and regressions
are so many, which implies that corresponding combinations of ‘tests of equality of QR coefficients’ substantially increase the number of tables we have to produce. Second, typically measurement error can be worse in panel data models. Third, while we have used lagged values
of the regressors in order to have some bite on endogeneity. There is a more formal approach
such as instrumentation with lagged values. This implies that the QR regressions with
contemporaneous regressors are even more likely to be affected by simultaneity bias. We have
maintained both contemporary and non-contemporary regressions because both are still affected
by simultaneity bias.
Future studies can improve the extant literature by assessing how the established findings
can be improved with information and communication technologies. Moreover, investigating
how countries at the top and bottom ends of the financial access distributions can benefit from
increasing public credit registries is also worthwhile. A more robust quantile estimator with
which to investigate these suggested lines of inquiry is that proposed by Canay (2011).
Accordingly, this estimator considers country-specific heterogeneity that is ignored in the current