Munich Personal RePEc Archive
Land Resource Utilisation in Tea
Industry: Current Problems and Future
Prospects with Special Reference to
Labour
Marjit, Sugata and Das, Nimai
Centre for Studies in Social Sciences (CSSSC), Manav Rachna
International University
2017
Online at
https://mpra.ub.uni-muenchen.de/91435/
Land Resource Utilisation in Tea Industry:
Current Problems and Future Prospects with Special Reference to Labour
Central focus of this study is to analyse two very important issues: land utilization patterns in tea gardens and the socio-economic profile of tea garden labour. In India there are presently an estimated thirteen hundred tea factories and thirty seven thousand large and small estates with more than two million people earning their livelihood from tea
related activities. These mainly include production, value addition at different levels, marketing of tea and related activities. In the tea industry, it is well known that despite such overwhelming dependence on tea related activities, the country is perhaps operating much below its capacity. In this regard, we observed that vast areas located under the big tea estates are not under tea plantation. Proper use of unutilised resource may generate higher returns to capital and
land along with higher employment levels. However, the question remains as to what level of production and employment should be deemed optimal in tea plantations. This study strives to look at some of these aspects with the help of detailed survey based data from West Bengal, Assam and Tamil Nadu. Based on this extensive sample survey on
tea gardens in all these major tea producing regions the study pragmatically examines the labour market issues too.
OVERVIEW
The central focus of this study is to analyze two very important issues: land utilization patterns in tea gardens and the socio-economic profile of tea garden labor. In India there are presently an estimated thirteen hundred tea factories and thirty seven thousand large and small estates with more than two million people earning their livelihood from tea related activities. These mainly include production, value addition at different levels, marketing of tea and related activities. In the tea industry, it is well known that despite such overwhelming dependence on tea related activities, the country is perhaps operating much below its capacity. In this regard, we observed that vast areas located under the big tea estates are not under tea plantation. Proper use of unutilised resource may generate higher returns to capital and land along with higher employment levels. However, the question remains as to what level of production and employment should be deemed optimal in the tea plantations. This study strives to look at some of these aspects with the help of detailed survey based data from West Bengal, Assam and Tamil Nadu.
The literature on tea garden labourers mostly talks about the inadequacies of various amenities and services. Based on the extensive sample survey on tea gardens in all the major tea producing regions of West Bengal, Assam and Tamil Nadu the study pragmatically examines the labor market issues.
Our survey results suggest that the percentage of unutilised land is highest for Assam and accounts for three-fourth of the sample estates. West Bengal and Tamil Nadu are not too dissimilar in this respect accounting nearly 40 per cent for unutilised land. For small tea growers, however, unutilised land is rarely a problem. As opposed to the big growers, who operate on land leased in for tea production, small growers typically converted their own land from other activities into tea plantation. We observe that predominantly agricultural and/or unused lands are converted into tea plantation as far as small growers are concerned.
Bengal and Tamil Nadu. Based on the responses on alternative best possible use of unused land, the following is an order: around 13 per cent and 36 per cent estates in Assam and Tamil Nadu respectively, is unusable and unprofitable. The terrains and land distribution may be against cultivation of any form. The survey yields that 9 per cent in West Bengal and Tamil Nadu and 5 per cent of estates in Assam have not yet planned on this aspect.
Recognizing the problems in labour market and associated socio-economic issues of labourers in tea industry, the study discusses six fundamental aspects: garden-wise demographic characteristics, current occupation (tea related or else) and expectation about future of their children, wage income and ownership of assets, educational status, access to health facilities and household amenities. The large tea garden labourers in our sample are spread over 1744 households with a population of 7661. For small tea garden labour households, we surveyed 526 households from large concentrations of small growers in the three regions. The total population size in our sample is 2070.
Survey design
Using the procedure of stratified random sampling we create a sample of large tea growers (estate owners) and labourers. The sampling pattern and methodology is invariant across the pair of studies we conduct for the tea related issues in India. Therefore, the sample cluster includes the same set of large and small tea growers and bought leaf factories that have been surveyed for both the pricing issues and the labor market issues.
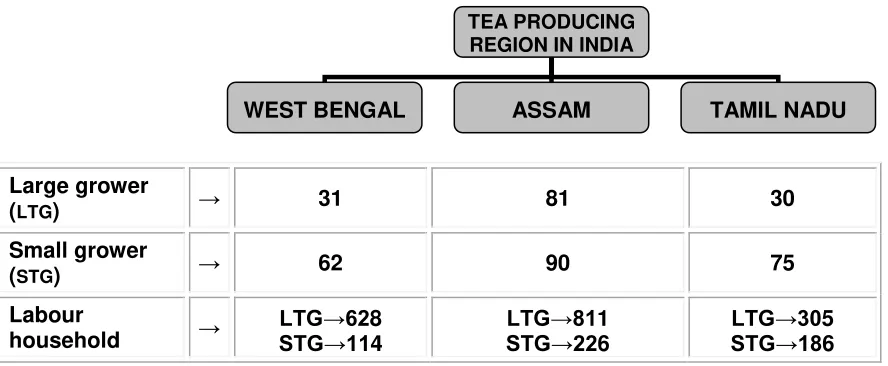
number of labour households surveyed for small tea estates is approximately two and half per garden across regions. The distribution of survey units from each category and from each region is depicted in figure 1.
Figure - 1: Sampling distribution of tea stakeholders
Large grower
(LTG) → 31 81 30
Small grower
(STG) → 62 90 75
Labour
household → LTG→62STG→118 4 LTG→81 1
STG→226 LTG→30
5 STG→186
Section - 1
Land resource utilization of tea industry
This section starts with the basic information regarding land coverage under tea plantation. It is however obvious for the tea estates that the total recorded area is not fully available for plantation since some parts necessarily have to be retained for other purposes like building labour quarters, drainage, garden-based factory (if applicable), etc. Therefore, we do not consider directly the difference between total recorded area and plantation area for each estate. Essentially, this should give the true picture on land use statistics for the tea estates. In this fashion we estimated the net area, which is not covered by tea bushes, and the distribution of our sample big estates as per land use status is depicted in table 1.1.
Table 1.1: Distribution of large growers as per land use status No
unutilised land
Unutilised land up to 50% of
total area
Unutilised land above 50% of
total area
West Bengal
Darjeeling 44.4 22.2 33.3
Terai 75.0 12.5 12.5
Dooars 60.0 30.0 10.0
Total 59.3 22.2 18.5
Assam
Sibsagar 17.4 56.5 26.1
Darrang 23.5 76.5 Nil Dibrugarh 31.0 51.7 17.2
Cachar 9.1 18.2 72.7
Total 22.5 53.8 23.7
Tamil Nadu Nilgiris 63.3 33.3 3.3
TEA PRODUCING REGION IN INDIA
[image:4.612.148.481.548.706.2]Table 1.1 shows that the large tea growers can be divided into two broad groups according to land use patterns: the estates which cover all of their total area under tea plantation and infrastructure, and the other group that fail to utilize the entire area – further sub-categorized according to the intensity of unutilised land (in the sense that it is not used for the purpose for which it was acquired, as per total recorded area). We found the unutilised land is highest for Assam involving three-fourth of the sample estates. West Bengal and Tamil Nadu are quite analogous in this respect with nearly 40 per cent of unutilised land for the tea estates on average. Intra-state variation across plantation districts exists in all the regions. For instance, compared to Dibrugarh in Assam with 69 per cent of estates with unutilised land, the Cachar region records a very high 90 per cent.
Evidently, this is not pertinent for the small tea growers. Table 1.2 shows the distribution of small tea growers as per pre-tea land characteristics which they converted to tea plantation.
Table 1.2: Distribution of small growers as per land use prior to tea plantation Unutilised
land
Agricultural land
Homestead land
Unutilised plus agricultural land
West Bengal 59.7 40.3 Nil Nil
Assam 57.8 30.0 4.4 7.8
Tamil Nadu Nil 100 Nil Nil
It is found that mainly agricultural and/or unused lands are transformed into tea production by small growers in all the states. In Tamil Nadu, the pre-tea land was purely agricultural in nature. Interestingly, in the northern tea producing regions of West Bengal and Assam an overwhelming part of the pre-tea lands were unused land.
1.1 Land use pattern
1.1.1 Profile of unutilised land
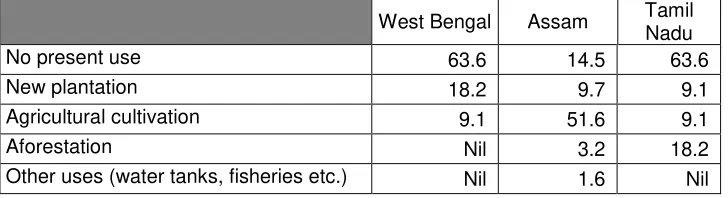
Since the present use of unutilised land under tea plantation is of limited importance in view of small tea growers we focus on the large growers/estates only. Clearly, an important issue is: what is the present status of this land while a considerable number of estates retain this under their lease from year to year? We observed earlier in table 1.1, it is sometimes above 50 per cent of the total area, particularly in northern tea producing states like West Bengal and Assam. Table 1.3 portrays these results. While agricultural cultivation is the major practice in Assam, the majority of estates hang on to this land in unused forms both in West Bengal and Tamil Nadu. Apart from these, alternative uses include composite events such as new plantation and aforestation in West Bengal or cultivation and fisheries in Assam etc.
Table 1.3: Distribution of growers as per present use of vacant land
West Bengal Assam Tamil Nadu
No present use 63.6 14.5 63.6
New plantation 18.2 9.7 9.1
Agricultural cultivation 9.1 51.6 9.1
Aforestation Nil 3.2 18.2
[image:5.612.133.497.639.738.2]Cultivation and new plantation Nil 4.8 Nil
Cultivation and fisheries Nil 6.5 Nil
Cultivation and aforestation Nil 3.3 Nil New plantation and aforestation 9.1 Nil Nil New plantation, cultivation and fisheries Nil 1.6 Nil A part vacant, cultivation and other uses Nil 3.2 Nil
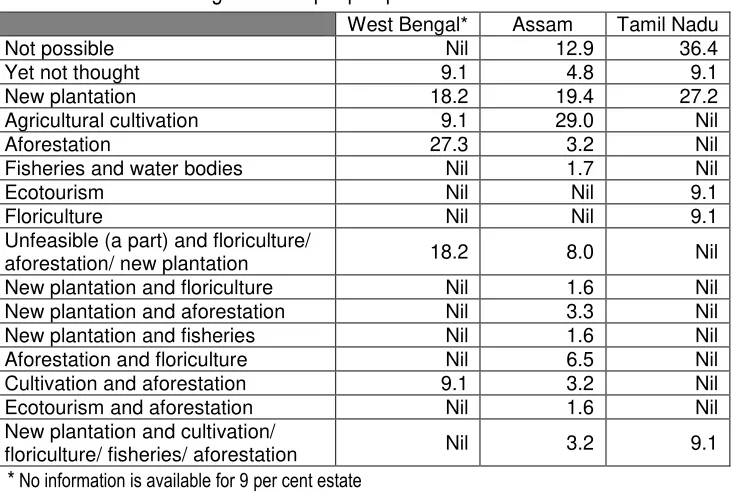
1.1.2 Prospective use of vacant land
[image:6.612.134.496.44.134.2]Based on the perceptions of respondent tea estates we offer possible alternate uses of land in table 1.4. Around 13 per cent and 36 per cent estates in Assam and Tamil Nadu respectively believe that the unutilised land cannot be used in any profitable form. Likewise about 9 per cent in West Bengal and Tamil Nadu and 5 per cent of estates in Assam are yet to come up with any plans on this matter. Other reasons, however, are not found significant in number.
Table 1.4: Distribution of growers as per prospective use of vacant land
West Bengal* Assam Tamil Nadu
Not possible Nil 12.9 36.4
Yet not thought 9.1 4.8 9.1
New plantation 18.2 19.4 27.2
Agricultural cultivation 9.1 29.0 Nil
Aforestation 27.3 3.2 Nil
Fisheries and water bodies Nil 1.7 Nil
Ecotourism Nil Nil 9.1
Floriculture Nil Nil 9.1
Unfeasible (a part) and floriculture/
aforestation/ new plantation 18.2 8.0 Nil New plantation and floriculture Nil 1.6 Nil New plantation and aforestation Nil 3.3 Nil New plantation and fisheries Nil 1.6 Nil Aforestation and floriculture Nil 6.5 Nil Cultivation and aforestation 9.1 3.2 Nil Ecotourism and aforestation Nil 1.6 Nil New plantation and cultivation/
floriculture/ fisheries/ aforestation Nil 3.2 9.1
* No information is available for 9 per cent estate
Clearly, by proper utilization of the idle assets like unutilised land under tea estates one could observe regeneration of productive assets, with positive implications for the labour and capital markets. The productive resource conversion will evidently open up opportunity of employment in labour market on the one hand and facilitate flow of funds thorough the credit market on the other. The perceptions of are available in table 1.5.
Table 1.5: Labour absorption and credit via prospective use of vacant land Possible Impossible
Labour absorption
West Bengal 54.5 36.4*
Assam 6.5 93.5
Tamil Nadu Nil 72.7@
Credit receiving
West Bengal 36.4 63.6
Assam 8.1 83.9#
Tamil Nadu Nil 100
* No information is available for 9.1% estate; @ No information is available for 27.3%
[image:6.612.131.504.267.516.2]Despite of the failure of some estates to report definitively on this aspect, about 55 per cent estates in West Bengal have some idea that prospective use of unutilised land might help them to create jobs for the surplus labour force. Others (Assam and Tamil Nadu) however are not in agreement with this view. Regarding credit, respondents in West Bengal show positive attitude. Here, above 35 per cent estates deem that they can receive credit via mortgaging the unused land.
Section - 2
Socio
-
economic profile of tea garden labour
In the existing reports on socio-economic aspect of tea garden labourers there seems to be an intense debate about the housing facilities and basic amenities such as drinking water and sanitation available to the tea garden labourers. The tea estate management claims that the labourers are provided with these facilities while the labour activists report that these services are rather inadequate. According to one such report, more than three lakh tea workers in Assam live in the ‘coolie’ hutments adjacent to the tea estates. Neither do they own a house nor a piece of land. According to one labour activist, more than two thirds of the permanent workforce in the tea industry are either denied free housing or live in kaacha houses built on garden land (Labour File,
vol. 5, July-September 1999).
According to the same report in Labour File, the average literacy rate in the plantation enclaves of
Assam hovers around 20 per cent. There are gardens where the literacy rate is as low as 8 per cent and female literacy rate is 3 per cent. The children can avail only of lower primary (LP) schools. But, the attendance is very low. The children of the temporary workers are not allowed to enrol in garden schools. Adequate number of teachers are not appointed; there are insufficient classrooms and books are just not available. For instance, in a tea estate in Dibrugarh district, a school constitutes of a single room where one teacher takes care of four classes. According to the report, the few who cross the hurdle of LP school, the further prospect of schooling in far away government-run institutions is less attractive than joining the tea garden labour force. The education department of the Government of Assam tried to stem the rot by taking control of the garden schools. But nothing much has happened since then and the dropout rate continues to be high.
But the labour unions play a very detrimental role by ensuring that the permanent workers pluck a lesser quantity of leaf and never plucks the additional kgs of leaf. The unions argue that if a permanent worker does not pluck the additional kgs of leaf, it will create opportunities for the casual labourers. With the coming of casual labour, comes the source of income for the union leaders in the form of tola. The people supposed to protect the interest of labourers turn their exploiters. The union
leaders are creating pressure on both management and labour. It has resulted in changing the equation of recruitment – there are three casual labourers for every permanent labourer. The things have worsened to such a situation that for every 26 kg of leaf plucked, now the management needs to recruit one permanent and two temporary workers.
On the basis of problems in labour market reported thus far and the associated socio-economic issues in the tea industry, the following section offers six fundamental aspects starting from the basic population features of tea garden labour households.
2.1 Populationdistribution,occupation,education,healthandamenities
2.1.1 Basic population distribution
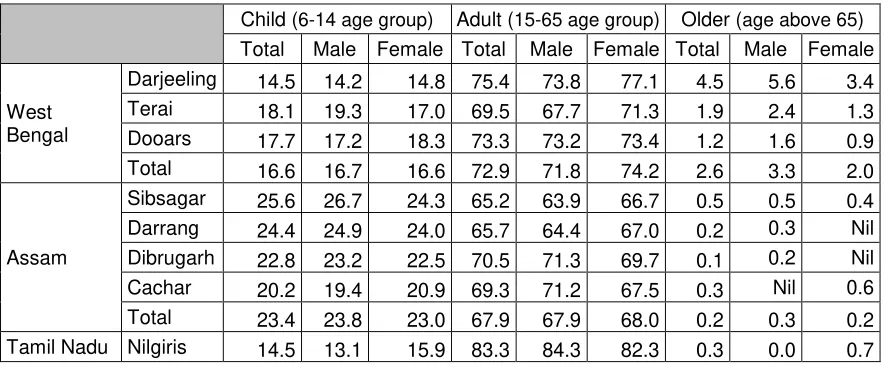
The survey in large tea garden labourers covered 1744 households with a population of 7661 and spread over three major tea plantation regions like West Bengal, Assam and Tamil Nadu (table 2.1a). Among the eight surveyed tea plantation districts in northern and southern tea producing states of the country the proportion of females compared to males is larger in Darjeeling of West Bengal, Darrang of Assam and Nilgiris of Tamil Nadu. The sex ratio is as high as 1057 in Nilgiris while it is very low in Sibsagar, at 901 only. Table 2.1a also offers the age specific distribution of total population into four major age groups: infant accounts population up to age 5 years, children group covers the age range of population between 6 to 14 years, adult group between age 15 to 65 years in the sense that they may participate in the labour market, and the older age group comprising the population aged above 65 years. Among the three columns in each individual age specific distribution of population in table the ‘total’ depicts the proportion of that particular group in total population, while ‘male’ and ‘female’ take into account the proportion of such particular gender group into total of this gender group in population. That is to say, for example, the share of male infant to total male in the population in Darjeeling is 6.5 per cent. Since the age group of adult population is expectedly high compared to other age groups in the population owing to the coverage of a wider range between age 15 to 65, the table shows that such a working adult is as large as 83.3 in Nilgiris and lower in Sibsagar involving 65.2 per cent of its total population.
Table 2.1a: Demographic features of large garden labour households
Total population Infant (age up to 5)
Male Female Total Male Female
West Bengal
Darjeeling 557 (49.9) 559 (50.1) 5.6 6.5 4.7 Terai 462 (50.5) 453 (49.5) 10.5 10.6 10.4 Dooars 507 (52.5) 459 (47.5) 7.8 8.1 7.4 Total 1526 (50.9) 1471 (49.1) 7.8 8.3 7.3
Dibrugarh 663 (50.2) 659 (49.8) 6.6 5.3 7.9 Cachar 371 (50.5) 363 (49.5) 10.2 9.4 11.0 Total 1927 (50.8) 1869 (49.2) 8.4 8.0 8.9 Tamil Nadu Nilgiris 422 (48.6) 446 (51.4) 1.8 2.6 1.1
Note: figures in parenthesis represent proportional distribution of population
Table 2.1a: continue
Child (6-14 age group) Adult (15-65 age group) Older (age above 65) Total Male Female Total Male Female Total Male Female
West Bengal
Darjeeling 14.5 14.2 14.8 75.4 73.8 77.1 4.5 5.6 3.4 Terai 18.1 19.3 17.0 69.5 67.7 71.3 1.9 2.4 1.3 Dooars 17.7 17.2 18.3 73.3 73.2 73.4 1.2 1.6 0.9 Total 16.6 16.7 16.6 72.9 71.8 74.2 2.6 3.3 2.0
Assam
Sibsagar 25.6 26.7 24.3 65.2 63.9 66.7 0.5 0.5 0.4 Darrang 24.4 24.9 24.0 65.7 64.4 67.0 0.2 0.3 Nil Dibrugarh 22.8 23.2 22.5 70.5 71.3 69.7 0.1 0.2 Nil Cachar 20.2 19.4 20.9 69.3 71.2 67.5 0.3 Nil 0.6 Total 23.4 23.8 23.0 67.9 67.9 68.0 0.2 0.3 0.2 Tamil Nadu Nilgiris 14.5 13.1 15.9 83.3 84.3 82.3 0.3 0.0 0.7
[image:9.612.93.537.140.323.2]Turning now to the case of small tea garden labour households, the 526 households surveyed in West Bengal, Assam and Tamil Nadu cover the total population of 2070 persons. Compared to the household size of 4.39 in large gardens the small garden labour household size is 3.94. The small tea garden labour households show that the working age population is 66.6 per cent in Assam, and 80 per cent in Tamil Nadu. The later state also has the highest female proportion (about 51 per cent).
Table 2.1b: Demographic features of small garden labour households
Total population Infant (age up to 5)
Male Female Total Male Female
West Bengal 266 (51.36) 214 (48.64) 9.6 10.9 7.9
Assam 522 (54.32) 439 (45.68) 9.5 9.8 9.1
Tamil Nadu 308 (48.97) 321 (51.03) 3.5 3.6 3.4
Note: figures in parenthesis represent proportional distribution of population
Table 2.1b: continue
Child (6-14 age group) Adult (15-65 age group) Older (age above 65) Total Male Female Total Male Female Total Male Female West Bengal 20.2 20.7 19.2 70.0 67.7 72.9 0.4 0.8 Nil Assam 22.9 26.8 18.2 66.6 62.8 71.1 1.0 0.6 1.6 Tamil Nadu 14.9 13.6 16.2 80.0 81.8 78.2 1.6 1.0 2.2
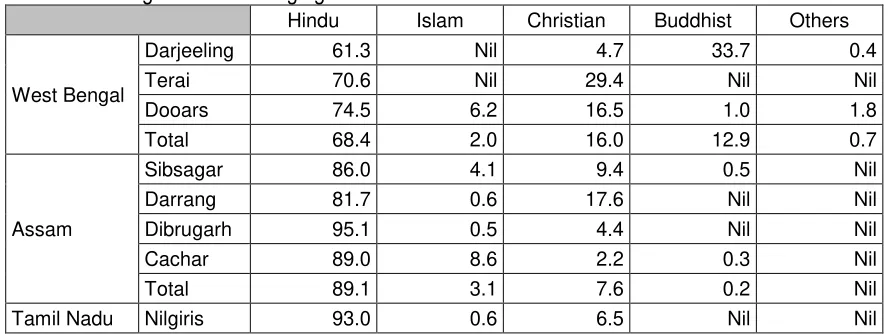
Table 2.2a: Religion status of large garden labour households
Hindu Islam Christian Buddhist Others
West Bengal
Darjeeling 61.3 Nil 4.7 33.7 0.4
Terai 70.6 Nil 29.4 Nil Nil
Dooars 74.5 6.2 16.5 1.0 1.8
Total 68.4 2.0 16.0 12.9 0.7
Assam
Sibsagar 86.0 4.1 9.4 0.5 Nil
Darrang 81.7 0.6 17.6 Nil Nil
Dibrugarh 95.1 0.5 4.4 Nil Nil
Cachar 89.0 8.6 2.2 0.3 Nil
Total 89.1 3.1 7.6 0.2 Nil
Tamil Nadu Nilgiris 93.0 0.6 6.5 Nil Nil
Table 2.2b: Religion status of small garden labour households
Hindu Islam Christian Buddhist Others
West Bengal 86.8 7.5 3.3 2.3
Assam 92.9 4.7 2.4 Nil Nil
Tamil Nadu 96.3 1.1 2.5 Nil Nil
[image:10.612.91.538.54.221.2]Furthermore, an overwhelming number of households in large gardens belong to the socially deprived groups such as scheduled tribes or scheduled castes (table 2.3a). Scheduled tribes are predominant in the northern tea producing states while the scheduled castes are dominant in south.
Table 2.3a: Caste status of large garden labour households
Schedule tribe
Schedule caste
Other backward
caste General
West Bengal
Darjeeling 44.8 6.6 31.9 16.7
Terai 76.6 9.2 2.4 11.7
Dooars 49.7 34.5 3.6 12.2
Total 56.3 15.8 14.2 13.8
Assam
Sibsagar 98.2 0.7 1.1 Nil
Darrang 73.4 6.8 10.3 9.5
Dibrugarh 78.6 2.3 17.2 1.9
Cachar 85.7 3.9 8.2 2.2
Total 89.8 9.3 1.0 Nil
Tamil Nadu Nilgiris 7.3 78.8 0.1 13.8
For the small garden labour households, labourers belonging to other backward castes (OBCs) are also significant in the south, accounting for 55.6 per cent followed by scheduled castes at 41.5 per cent.
Table 2.3b: Caste status of small garden labour households
Schedule tribe
Schedule caste
Other backward
caste General
West Bengal 9.1 76.8 6.7 7.4
Assam 94.1 2.7 Nil 3.3
[image:10.612.126.502.401.587.2]2.1.2 Occupation and future
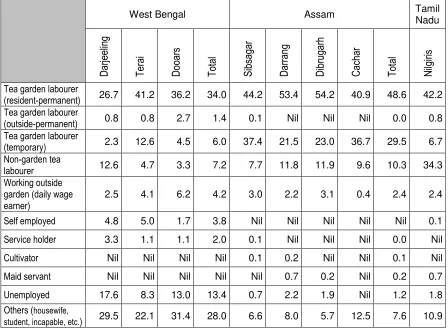
[image:11.612.90.538.280.611.2]Tables 2.4a and 2.4b give the occupational profiles of the working population for large and small tea garden labour households, respectively. The distribution of working population by different occupational categories in the large garden labourers suggest that not unexpectedly, larger sections of the population are involved in the tea industry (either garden sector or factory, table 2.4a). Among the eight tea plantation districts we surveyed, the residential permanent labourers are as low as 27 per cent in Darjeeling and at a high of about 54 per cent in Dibrugarh. In the Nilgiris it is 42.2 per cent. The non-resident permanent labourers are hardly noteworthy in our sample. The results of the primary survey suggests that cultivation does not play much role in any of the regions but non-tea sector daily wage earners engaged in non-cultivation related activities are strong. Self employed and the service holders are active mainly in West Bengal. However, there is also high open unemployment in West Bengal.
Table 2.4a: Distribution of working group population as per main occupation for large garden labour households
West Bengal Assam Tamil
Nadu
D
arjee
lin
g
Terai Dooars Total Sib
sagar
D
arrang
D
ib
rugarh
C
ac
har
Total Nilgi
ris
Tea garden labourer
(resident-permanent) 26.7 41.2 36.2 34.0 44.2 53.4 54.2 40.9 48.6 42.2 Tea garden labourer
(outside-permanent) 0.8 0.8 2.7 1.4 0.1 Nil Nil Nil 0.0 0.8 Tea garden labourer
(temporary) 2.3 12.6 4.5 6.0 37.4 21.5 23.0 36.7 29.5 6.7 Non-garden tea
labourer 12.6 4.7 3.3 7.2 7.7 11.8 11.9 9.6 10.3 34.3 Working outside
garden (daily wage earner)
2.5 4.1 6.2 4.2 3.0 2.2 3.1 0.4 2.4 2.4
Self employed 4.8 5.0 1.7 3.8 Nil Nil Nil Nil Nil 0.1
Service holder 3.3 1.1 1.1 2.0 0.1 Nil Nil Nil 0.0 Nil
Cultivator Nil Nil Nil Nil 0.1 0.2 Nil Nil 0.1 Nil
Maid servant Nil Nil Nil Nil Nil 0.7 0.2 Nil 0.2 0.7
Unemployed 17.6 8.3 13.0 13.4 0.7 2.2 1.9 Nil 1.2 1.8
Others (housewife,
student, incapable, etc.) 29.5 22.1 31.4 28.0 6.6 8.0 5.7 12.5 7.6 10.9
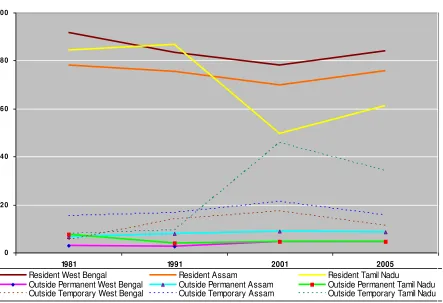
the other hand, the non-resident temporary labourers which earlier constituted a very small proportion of labour force increased from 15 per cent in 1981 to 22 per cent in 2001 but once again declined to 15 per cent in 2005.
Figure 2: Observed pattern of labours in tea industry over time
Figure 2 also reveals that resident labourers constituted about 84 per cent, non-resident permanent labourers 4 per cent while the non-resident temporary labourers constitute about 11 per cent of tea garden labourers of West Bengal in 2005. The resident labourers underwent a declining trend from 1981 to 2001 but reversed to an increasing trend over the period 2001 to 2005.
For Tamil Nadu, the resident labourers constitute about 61 per cent, non-resident permanent labourers 4 per cent and the non-resident temporary labourers about 35 per cent of the total tea garden labourers in Tamil Nadu. The figure also reveals that there is a major shift of labour from resident to non-resident permanent labour over the period 1991-2001. The former declined sharply from 87 per cent to about 50 per cent with corresponding increase in non-resident permanent labourer. However, the percentage of resident labourers increased once again from about 50 per cent to about 61 per cent over the period 2001 to 2005.
Overall, it seems that the gardens are operated with large number of casual labourers. Casualisation is as high as 82 per cent in Assam followed by Tamil Nadu (65 per cent). However, the rate is pretty low in West Bengal at 20 per cent.
0 2 0 4 0 6 0 8 0 10 0
1981 1991 2001 2005
Resident West Bengal Resident Assam Resident Tamil Nadu
Outside Permanent West Bengal Outside Permanent Assam Outside Permanent Tamil Nadu
Table 2.4b: Distribution of working group population as per main occupation for small garden labour households
West Bengal Assam Tamil Nadu
Tea garden labourer (resident-permanent) 7.4 0.8 Nil
Tea garden labourer (outside-permanent) 11.3 2.0 Nil
Tea garden labourer (temporary) 18.8 81.8 64.6
Non-garden tea labourer 14.6 8.2 0.2
Working outside garden (daily wage earner) 10.4 0.5 1.2
Self employed 1.2 Nil 0.6
Service holder Nil Nil 6.0
Cultivator 3.6 0.8 11.5
Maid servant 0.6 Nil Nil
Unemployed 6.8 Nil Nil
Others (housewife, student, incapable, etc.) 25.3 6.0 15.9
[image:13.612.113.514.70.292.2]This section finally offers an analysis of what the tea garden workers contemplate about the future of their children. We intend to shed some light on a fairly critical issue: whether the modern day tea garden workers want their children to continue in the same industry as has been the practice over the last century? We tried to elicit this answer from the respondents based on their ideas about the opportunities outside the tea gardens. We found that the perception about the future of the children leaving the tea industry is lowest in Tamil Nadu, while it is very high at 75 per cent in the Dooars region of West Bengal. We also enquired about the demand for industrial and technical training not excluding but generally more broad based than that applicable to the tea industry and the aggregated responses are summarized in table 2.5.
Table 2.5: Distribution of large garden labour households as per future expectation about the children
Expect child to
switch from garden
Want training for child
Reason for non-switching from tea garden
Not interested
Don’t think
since too young child
Others* Unable to answer
West Bengal
Darjeeling 57.6 42.9 64.2 9.4 24.5 1.9 Terai 56.9 41.4 25.6 38.5 28.2 7.7 Dooars 75.8 23.8 75.0 Nil 25.0 Nil Total 64.5 35.0 49.0 20.8 26.0 4.2
Assam
Sibsagar 54.2 9.5 26.1 13.0 60.9 Nil Darrang 53.7 6.1 33.3 Nil 44.5 22.2 Dibrugarh 54.8 5.8 50.0 33.3 16.7 Nil Cachar 52.7 8.6 28.0 12.0 48.0 12.0 Total 54.0 7.8 30.2 12.7 49.2 7.9 Tamil Nadu Nilgiris 47.9 1.5 9.1 36.4 50.0 4.5
[image:13.612.115.514.489.698.2]Table 2.5 shows that the demand for training is considerable in West Bengal. Despite nearly half of the households responded that they intend their children to move out of the tea sector in both Assam and Tamil Nadu, their demand for such job training is very low, particularly in the Nilgiris. The respondent households which do not want to switch from the tea sector, however, frequently reply their reasons that either they are not interested in non-tea sector or other causes like unable to provide proper education for non-tea jobs, tried but not succeed for such jobs, etc. Nevertheless, it is important to mention here that most of the parents thinking or thought about some limited occupation like clerical jobs, teaching, etc; they are not shown very interest on the self employment via proper training.
2.1.3 Wage and assets
Following table 2.6 shows the prevailing wage rates in different markets like large garden, small garden vis-à-vis non-tea sector. We also estimated the real wage for each market using the consumer price index for industrial workers in 2009 (with 2001 base) in the nearest regions like Darjeeling, Siliguri and Jalpaiguri for West Bengal, Guwahati for Sibsagar, Darrang and Dibrugarh as well as Silchar for Cachar, and Coonoor for Nilgiris region. We typically found that the non-tea wage rate is always greater than the tea sector irrespective of the large or small gardens.
Table 2.6: Nominal and real wage rates of workers in different labour markets like large garden, small garden as well as outside the garden
Large garden Small garden Non-garden Nominal Real Nominal Real Nominal Real
West Bengal
Darjeeling 64.59 42.17 NA NA 99.45 64.93 Terai 65.34 41.84 NA NA 92.62 59.31 Dooars 71.53 47.79 64.26 41.95 91.63 61.22 Total 67.22 NA 64.26 41.95 95.41 NA
Assam
Sibsagar 66.61 46.74 66.29 46.52 100.82 70.75 Darrang 66.86 46.92 NA NA 84.83 59.53 Dibrugarh 66.57 46.72 67.21 47.16 73.84 51.82 Cachar 53.17 34.36 64.88 41.93 96.25 62.20 Total 63.97 NA 65.54 NA 88.91 NA Tamil Nadu Nilgiris 129.91 87.82 166.1 112.29 190.89 129.05
[image:14.612.108.517.388.569.2]Table 2.7: Stock of specified assets (livestock and durable assets) per households in large and small garden labourers
West Bengal Assam Tamil Nadu
Large grower Small grower Large grower Small grower Large grower Small grower
Fowl 4.9
(48.1) 5.6 (15.8) 7.1 (77.6) 7.4 (84.5) 5.5
(1.3) Nil
Cow/bullock/buffalo 2.1 (24.8) 2.3 (51.8) 2.1 (36.1) 1.5 (29.6) 1.0 (1.3) 1.3 (39.2)
Pig/horse/goat 2.8 (35.4) 2.5 (40.4) 3.3 (49.8) 3.2 (75.2) 2.3 (1.3) 1.2 (4.3)
Other livestock 2.8 (5.9) 6.3 (2.6) 1.2 (1.6) 2.5 (0.9) 1.0 (0.3) 1.0 (3.2)
Cycle 1.4
(45.9) 1.3 (73.7) 1.2 (67.1) 1.2 (75.7) 1.1 (4.6) 1.0 (9.7)
Motorcycle 1.0 (4.9) 1.0 (0.9) 1.1 (3.3) 1.0 (3.5) 1.0 (2.6) 1.0 (26.3)
Television 1.0 (64.2) 1.1 (6.1) 1.0 (36.3) 1.0 (24.3) 1.0 (82.3) 1.0 (97.8)
Telephone 1.3
(47.9) 1.1 (11.4) 1.1 (62.8) 1.1 (68.1) 1.2 (72.5) 1.2 (79.0)
* Figures in the parenthesis represent proportion of households possession of particular assets
2.1.4 Educational scenario
[image:15.612.120.508.70.302.2]There are two types of educational scenarios portray in the following tables 2.8a (for large garden labour households) and 2.8b (for small garden labour households), and these are educational status of the adult group (age between 15 to 65) and child population (aged at 6 to 14 years). Moreover, the children education is portrayed by sex (M = male and F = female). Among the eight regions we studied the illiteracy is highest in Cachar (44.4 per cent) and lowest in Darjeeling (14.5 per cent) as well as Nilgiris (14.7 per cent). Most of the cases the literate adult group is limited up to junior secondary level (eighth standard). Quite expectedly, the children are mainly concentrated in pre-primary to pre-primary stages.
Table 2.8a: Distribution of child and working group populations as per educational status for large garden labour households
West Bengal Assam Tamil
Nadu
D
arjee
lin
g
Terai Dooars Total Sib
sagar D arrang D ib rugarh C ac har
Total Nilgi
ris
Illiterate Chi
ld
M 1.3 4.5 5.7 3.9 7.7 1.3 3.9 18.1 7.0 Nil
F Nil 5.2 9.5 4.9 14.1 3.9 1.4 21.1 9.1 1.4
Adult 14.5 39.6 31.1 27.2 28.9 39.9 37.4 44.4 36.8 14.7
Pre-primary Chi
ld
M 51.9 48.3 50.6 50.2 56.4 51.9 57.1 63.9 57.1 Nil F 60.2 48.1 45.2 51.2 59.4 68.8 56.8 60.5 60.3 45.1
Adult 12.1 9.9 14.2 12.2 32.2 14.7 14.6 37.7 29.5 31.2
Primary Chi
ld
M 43.0 44.9 39.1 42.4 34.6 42.9 39.0 18.1 34.9 43.6
F 34.9 44.2 44.0 41.0 26.6 23.4 41.9 18.4 29.8 52.1
[image:15.612.98.559.487.734.2]Junior
secondary Chi
ld M 3.8 2.2 4.6 3.5 1.3 3.9 Nil Nil 1.1 1.8
F 4.8 2.6 1.2 2.9 39.1 3.9 Nil Nil 0.7 1.4
Adult 31.7 17.9 22.3 24.7 5.5 44.0 5.2 2.2 5.9 14.0
Secondary Chi
ld
M Nil Nil Nil Nil Nil Nil Nil Nil Nil Nil
F Nil Nil Nil Nil Nil Nil Nil Nil Nil Nil
Adult 13.7 12.1 6.1 10.8 1.2 2.2 0.9 0.2 1.0 5.4 Professional
diploma
A
du
lt
0.4 Nil Nil 0.1 Nil Nil Nil Nil Nil 0.1 Senior
secondary 5.9 2.7 4.1 4.4 Nil 0.5 0.1 Nil 0.1 3.3 Graduate 2.4 1.7 1.4 1.9 0.1 Nil Nil Nil 0.0 2.5
Postgraduate 0.2 Nil Nil 0.1 Nil Nil Nil Nil Nil Nil Non-formal
education 0.1 Nil Nil 0.0 Nil Nil Nil Nil Nil 0.0
Pertaining to the small growers case, the adult illiteracy is as highest as 47.3 per cent in West Bengal, while it is nil in Tamil Nadu region (see table 2.8b). For the literate adults the most density is at pre-primary stage (read and write only) in the northern tea producing states like West Bengal and Assam, while in Tamil Nadu it is at secondary level. Like the large garden case both male and female child are mainly concentrate at pre-primary and primary levels.
Table 2.8b: Distribution of child and working group populations as per educational status for small garden labour households
West Bengal Assam Tamil Nadu
Illiterate Chi
ld
M 1.8 0.7 Nil
F Nil 5.0 Nil
Adult 47.3 13.9 Nil
Pre-primary Chi
ld
M 61.8 73.6 57.1
F 51.2 72.5 51.9
Adult 26.8 42.1 6.8
Primary Chi
ld
M 32.7 23.6 35.7
F 43.9 18.8 38.5
Adult 9.8 26.1 16.2
Junior secondary Chi
ld M 3.6 2.1 7.1
F 4.9 3.8 9.6
Adult 12.5 13.0 20.2
Secondary Chi
ld
M Nil Nil Nil
F Nil Nil Nil
Adult 3.3 3.9 39.4
Professional diploma
A
du
lt Nil Nil 0.8
[image:16.612.142.487.405.736.2]Graduate Nil Nil 8.2
Postgraduate Nil Nil Nil
Non-formal education Nil Nil Nil
Next section we offer the status of school going children aged between 6 to 14 years by types of garden labour. The large garden case is depicted in table 2.9a. Among the regions we found highest school non-going child in Cachar and expectedly the lowest in Nilgiris. In spite of the highest average distance to travel for school as well as highest spending (rupees per month) on schooling in West Bengal the school non-going children restricts at nearly 12 per cent.
Table 2.9a: Distribution of child population as per schooling information for large garden labour households
West Bengal Assam Tamil
Nadu
D
arjee
lin
g
Terai Dooars Total Sib
sagar
D
arrang
D
ib
rugarh
C
ac
har
Total Nilgi
ris
Children not going to school (proportion)
15.8 15.1 5.6 12.2 25.0 13.0 12.6 36.5 20.6 0.8
Average distance
to travel (km) 4.3 2.7 4.1 3.7 1.1 1.3 0.8 1.4 1.1 1.9 Average monthly
fees to paid for schooling
48 87 128 88 43 54 21 41 35 Nil
[image:17.612.146.487.44.98.2]For the small garden labour case, however, Assam registered as highest school non-going children around 12 per cent, and interestingly the Tamil Nadu is non-negligible and above the West Bengal figure. Tamil Nadu is also registered high score in terms of average distance to travel for school and the monthly spending on schooling.
Table 2.9b: Distribution of child population as per schooling information for small garden labour households
West Bengal Assam Tamil Nadu Children not going to school (proportion) 7.3 11.8 8.3
Average distance to travel (km) 1.8 1.6 3.3
Average monthly fees to paid for schooling 21 63 281
[image:17.612.112.562.237.419.2] [image:17.612.114.516.536.605.2]Interestingly, while cent per cent female child are not going to school for the domestic help of the parent in household, the same for Nilgiris is simply the unwillingness.
Table 2.10a: Distribution of child population by sex as per reasons for not going to school for large garden labour households
Unavailable in the locality
Financial problem
Help to parent
in household Not willing
Others (incapable)
W
es
t
B
en
ga
l
Darjeeling M 25.0 37.5 25.0 Nil 12.5
F Nil Nil 100 Nil Nil
Terai M 5.6 50.0 5.6 22.2 16.7
F Nil 14.3 14.3 14.3 42.9
Dooars M Nil 35.7 Nil 7.1 57.1
F Nil Nil 7.7 23.1 53.8
Total M 7.5 42.5 5.6 12.5 30.0
F Nil 4.8 14.3 19.0 47.6
A
s
s
am
Sibsagar M 2.7 16.2 Nil 35.1 45.9
F Nil 11.8 Nil 41.2 41.2
Darrang M Nil 14.3 Nil 42.9 42.9
F Nil 15.4 7.7 15.4 38.5
Dibrugarh M Nil 8.6 Nil 30.4 60.9
F Nil 13.3 13.3 26.7 33.3
Cachar M Nil Nil Nil 44.4 55.6
F Nil 14.8 3.7 40.7 40.7
Total M 1.1 9.6 37.2 52.1
F Nil 13.5 4.5 34.8 39.3
T
am
il Na
du
Nilgiris
M Nil Nil Nil Nil Nil
F Nil Nil Nil 100 Nil
*Indeed each row sum should be equal to the hundred, sometimes underestimated due to missing of information. It is also applicable elsewhere.
The children of the small garden labour households are not going to school simply other reason for entire male and half of the female in West Bengal. The rest half of female child are not going due to financial problems which is the reason for cent per cent female in Tamil Nadu also. A major part of male in Assam is not going to school since they are unwilling to do so.
Table 2.10b: Distribution of child population by sex as per reasons for not going to school for small garden labour households
Unavailable in the locality
Financial problem
Help to parent in household
Not willing Others (incapable)
West Bengal M Nil Nil Nil Nil 100
F Nil 50.0 Nil Nil 50.0
Assam M Nil 25.0 Nil 62.5 12.5
F Nil 16.7 11.1 33.3 38.9
Tamil Nadu M Nil Nil Nil Nil Nil
[image:18.612.118.509.616.743.2]2.1.5 Health status
[image:19.612.96.558.220.725.2]In this section we provide information on some basic aspects of health facilities availing by the garden labourers. As we found in table 2.11a that most of the case the large tea garden labourers use their garden dispensary for general health matters. Although the majority of the household do not suffer from major illness like heart diseases, cancer, etc. If situation arises for them, expectedly, they prefer to use government health centre. However, the necessary help provided for them by the garden authority includes arrangement of vehicle, contacting the doctor/hospital, monetary support, etc. These supports are provided to them in various combinations (for example, all the supports as required are availed by the labourers in Cachar).
Table 2.11a: Distribution of large garden labour households as per accessibility of health facilities
West Bengal Assam Tamil
Nadu
D
arjee
lin
g
Terai Dooars Total Sib
sagar D arrang D ib rugarh C ac har
Total Nilgi
ris P lace o f tr ea tm en t fo r ge ne ral illness Tea garden
dispensary 73.4 64.1 88.9 76.7 89.1 98.5 89.0 98.8 92.7 87.2 Govt. health
centre 19.7 27.6 8.2 17.5 9.7 0.7 10.2 Nil 6.3 10.9 Private health
centre 6.9 8.3 2.9 5.7 1.3 0.7 0.8 1.2 1.0 2.0 Suffer from major illness 5.4 15.5 10.7 10.4 2.5 7.5 2.8 3.0 3.5 32.9
P lace o f tr ea tm en t fo r m ajor illness Govt. health
centre 90 76.9 80 80.3 83.3 70 100 100 84.6 14.6 Private health
centre 10 11.5 12 11.5 Nil 20 Nil Nil 7.7 6.3 Informal health
centre Nil 3.8 Nil 1.6 16.7 Nil Nil Nil 3.8 42.7 Received major support
from tea garden authority for major illness
4.5 47.5 61.6 35.4 12.6 33.3 42.4 4.4 21.7 15.1
Help fr om te a g ar de n a uth or ity for tr ea tm en t Arrangement of
vehicle 35.2 36.1 36.4 35.6 15.4 Nil 10.3 Nil 8.0 Nil Contracting
doctor/ hospital Nil 1.2 Nil 0.5 Nil Nil Nil Nil Nil 19.3 Monetary
support 1.6 1.2 9.1 1.8 57.7 Nil Nil Nil 12.0 Nil Arrangement of
vehicle plus contracting doctor
34.6 11.6 Nil 23.4 3.8 Nil 10.3 Nil 5.6 1.8
Arrangement of vehicle plus monetary support
13.6 38.3 36.4 24.3 Nil 2.8 10.5 Nil 5.6 Nil
Contracting doctor plus monetary support
0.8 Nil 9.0 0.9 Nil 2.8 3.4 Nil 2.4 Nil
All supports
The tea garden dispensary facility is however limited to the small garden labourers (see table 2.11b).
They usually travel to the government health centre in the general health matters. In case of major
illness they receive full support from the garden authority in Assam. However, it is very limited for
them in Tamil Nadu region. The authority either arrange vehicle or contract doctor/hospital in
Assam, while in West Bengal and Tamil Nadu they receive mainly the financial support.
Table 2.11b: Distribution of small garden labour households as per accessibility of health facilities
West Bengal Assam Tamil Nadu
Place of treatment for
general illness
Tea garden dispensary Nil 18.6 51.1 Govt. health centre 85.1 75.2 45.2 Private health centre 14.9 6.2 3.8 Suffer from major illness Nil 0.9 18.3
Place of treatment for major illness
Govt. health centre Nil 100 61.8 Private health centre Nil Nil 29.4 Informal health centre Nil Nil 8.8 Received major support from tea garden authority for major illness 30.7 100 3.1
Help from tea garden authority for
treatment
Arrangement of vehicle Nil 50.0 Nil
Contracting doctor/ hospital Nil 50.0 Nil
Monetary support 93.9 Nil 100
Arrangement of vehicle plus contracting doctor Nil Nil Nil
Arrangement of vehicle plus monetary support 3.0 Nil Nil
Contracting doctor plus monetary support Nil Nil Nil
All supports mentioned above 3.0 Nil Nil
2.1.6 Household amenities
Our socio-economic analysis of the tea garden labour households is ended with the analysis of
amenities that provided to them. The following tables 2.12a and 2.12b describe these facts for large
and small tea garden labourers respectively. In the amenities case we consider first the availability
of the electricity followed by water supply and sanitation. For the large garden labour households
the availability of electricity is cent per cent in the Nilgiris region, while the Cachar is in most worst
condition (below 30 per cent households have the facility). Even if, the water is manly supplied to
them by the garden authority anywhere in our study regions, private arrange of water in all the
plantation regions of West is parallel important. Similar type of analysis is almost applicable for the
Table 2.12a: Distribution of large garden labour households as per accessibility of drinking water and sanitation facilities
West Bengal Assam Tamil
Nadu
D
arjee
lin
g
Terai Dooars Total Sib
sagar D arrang D ib rugarh C ac har
Total Nilgi
ris
Availability of electricity 99.6 84.5 89.2 91.9 51.9 59.0 58.5 28.1 50.4 100
Water supplier
Tea garden 34.0 59.7 48.8 46.2 95.0 78.4 82.6 95.2 88.3 82.8
Private 65.6 32.0 48.8 50.5 0.8 19.4 0.4 Nil 3.7 0.3
Panchayat 0.4 8.3 2.5 3.3 4.2 2.2 17.0 4.8 8.1 16.9
Dis tan ce t o f etch water
< 15minutes 61.1 95.0 71.4 74.2 53.4 67.9 18.6 77.8 49.9 90.1
15-30 minutes 29.1 3.9 3.0 13.4 46.6 32.1 81.4 22.2 50.1 9.9
30 mins-1hr 6.1 1.1 0.5 2.9 Nil Nil Nil Nil Nil Nil
>1hr 3.7 Nil 25.1 9.6 Nil Nil Nil Nil Nil Nil
Dur atio n o f wa ter sup
ply 8-24hrs 57.0 81.8 71.9 68.9 83.1 93.3 85.4 74.9 83.8 100
4-8hrs 23.8 7.2 8.4 14.0 16.5 3.7 12.6 25.1 14.9 Nil
<4hrs 13.5 8.3 19.7 14.0 Nil 0.7 0.4 Nil 0.3 Nil
On alternative
day 4.5 Nil Nil 1.8 0.4 Nil Nil Nil 0.1 Nil Other than
these 1.2 2.8 Nil 1.3 Nil 2.2 1.6 Nil 0.9 Nil Whether spent on water 7.4 1.7 10.8 6.8 2.1 Nil 0.4 1.8 1.1 1.3
T oilet u se Individual toilet by garden authority
5.3 14.4 26.6 14.8 68.1 38.3 72.6 41.0 58.8 92.1
Own individual 87.7 14.9 16.7 43.8 2.1 11.3 3.2 1.8 3.9 1.0
Community toilet by garden authority
3.3 0.6 7.9 4.0 6.3 2.3 1.2 1.2 2.9 Nil
Open ground 3.7 68.5 48.3 36.8 8.0 42.9 6.7 40.4 20.3 0.3
Provided by
panchayat Nil 1.7 0.5 0.6 15.5 5.3 16.3 15.7 14.1 6.6
S ewer ag e co nn ection
Individual 38.9 9.4 7.9 20.4 7.6 1.5 0.4 1.2 2.9 Nil
Community 0.4 Nil 21.2 7.0 0.4 0.8 0.8 Nil 0.5 0.3
Individual septic
tank 51.6 22.1 14.3 31.1 55.9 42.1 79.7 13.8 52.2 7.2 Community
septic tank 5.7 Nil 8.4 4.9 19.7 2.3 7.2 20.4 12.9 92.5 No connection 3.3 68.5 48.3 36.6 16.4 53.4 12.0 64.7 31.4 Nil
the regions, the time to fetch water is below 15 minutes in West Bengal and Tamil Nadu (Assam registered 15 to 30 minutes for most cases). Use of toilet is unhygienic in West Bengal since 93 per cent households use open ground. Almost all of them do not have the sewerage connection (Assam also falls in the same category in this respect). Sanitation facility uses by the households of small garden labourers is fairly better only in Tamil Nadu region.
Table 2.12b: Distribution of small garden labour households as per accessibility of drinking water and sanitation facilities
West Bengal Assam Tamil Nadu
Availability of electricity 97.3 29.0 98.4
Water supplier
Tea garden 8.1 21.7 50.0
Private 78.4 2.7 Nil
Panchayat 13.5 75.7 50.0
Dis
tan
ce t
o f
etch
water
< 15minutes 93.0 22.1 99.5
15-30 minutes 7.0 75.2 0.5
30 mins-1hr Nil 2.7 Nil
>1hr Nil Nil Nil
Dur
atio
n o
f wate
r
sup
ply
8-24hrs 100 98.2 100
4-8hrs Nil 1.8 Nil
<4hrs Nil Nil Nil
On alternative day Nil Nil Nil
Other than these Nil Nil Nil
Whether spent on water Nil 0.4 0.5
T
oilet u
se
Individual toilet by garden authority Nil 13.7 Nil
Own individual 4.4 23.0 16.7
Community toilet by garden authority Nil 4.9 Nil
Open ground 93.0 6.2 0.5
Provided by panchayat 2.6 52.2 82.8
S
ewer
ag
e co
nn
ection
Individual 3.6 4.4 Nil
Community Nil Nil Nil
Individual septic tank 0.9 0.4 79.6
Community septic tank 0.9 1.8 19.9
Section - 3
Conclusion
This report provides an extensive survey of tea garden labourers at the household level. To the best of our knowledge such detailed and comprehensive survey at the household level is hardly available in the existing literature. We analyze the overall socio-economic conditions in the tea gardens with special reference to the labourers. In this respect we interviewed a staggering 2270 labour households (1744 from large garden labour and 526 from small garden) spanning the north and south. In the process, we collected sample information from 9731 individuals as part of the tea garden working population.
The detailed results are available directly in the main text above. On the basis of this report, we observe that there are several issues which the tea industry in general might find amenable to appropriate policies to go with the larger planning of the tea industry. We observed that there are certain plans pertaining to the use of unutilised land resources in the possession of larger tea estates. Many have already begun devoting the excess capacity towards tourism related to tea, but the practice is still fairly low to argue in favour of a comprehensive plan. Moreover, the tea estates everywhere cannot for obvious reasons including geographic and other factors, practice tourism efficiently. Thus, the alternatives are limited to floriculture and cultivation of other cash crops. We do not have adequate instruments to judge if such orientations would lead to optimal outcomes in view of the excess land reserves.
one of the greatest advantages of Indian tea compared to its growing competitors. It is therefore imminent that (depending on the various grades of tea) the authorities must design appropriate mechanisms to maintain high productivity without sacrificing the quality. It seems that growing casualisation of labour and cultivation/ harvesting techniques to stay viable in the short run may cause more harm to the industry than realised at the moment.
After all, the mechanisms that make Indian tea special are time tested and robust. Neither short run profit-seeking ventures nor treating the industry as any other run-of-the-mill activity could help the industry gaining back some of the glory that it enjoyed for centuries. In addition, aggressive marketing strategies internationally, popularising of tea as a staple drink and continuous adjustments to suit the unstable consumer bases globally are much needed emphases as part of a long term plan for the industry as a whole.
Acknowledgements: This study is supported by the National Tea Research Foundation (NTRF), Tea Board of India