ISSN Online: 2164-5337 ISSN Print: 2164-5329
DOI: 10.4236/wjcd.2019.99061 Sep. 24, 2019 681 World Journal of Cardiovascular Diseases
Correlation of Invasively Estimated Left
Ventricular End Diastolic Pressure with
Acceleration of E’ Wave by Tissue Doppler
Imaging of Mitral Annulus
Mahmoud Kamel, Morad Beshay, Said Shalaby, Ahmed Emara, Mohammed Abdel Rahman
Cardiology Department, Faculty of Medicine, Menoufia University, Menoufia, Egypt
Abstract
Background: There is no single noninvasive index that provides a direct measure of LV filling pressure. However, invasive measuring of LV end diastolic pressure (LVEDP) provides reliable assessment of LV diastolic dys-function, but its invasive nature limits its use in daily practice. Accurate non-invasive assessment of LV diastolic dysfunction is highly desirable, and the relationship between the degree of LVEDP and acceleration of E’ wave ob-tained by tissue Doppler imaging (TDI) of mitral annulus is not clearly as-sessed; here in our study we aimed to assess the relation between the degree of LVEDP and the acceleration rate of E’ wave of mitral annular Doppler tis-sue. Patients and Methods: The study included 60 patients divided equally into 3 groups according to the degree of LVEDP, group I (Normal): <10 mmHg, group II (Grey zone): 10 - 14 mmHg, and group III (Elevated): ≥15 mmHg. All participants underwent Electrocardiographic examination (ECG), standard two-dimensional echocardiography, mitral Doppler flow and tissue Doppler imaging of mitral annulus including E/E’ ratio and E’ wave acceleration rate. Coronary angiography and left sided heart catheterization and measuring LVEDP were performed for correlating E’ wave acceleration rate with invasively estimated LVEDP. Results: There was significant pro-gressive decrease in E’ acceleration rate (E’ Acc rate) with propro-gressive in-crease in LVEDP from I to III (P 0.001), while there was significant progres-sive increase in E/E’ ratio with progresprogres-sive increase in LVEDP from I to III (P 0.003). Peak E’ acceleration rate had a significant negative correlation with LVEDP in all three groups, with p value of 0.003, 0.044 and 0.021 respectively in group I, II & III. Regarding E/E’ ratio there was a significant positive cor-relation in predicting normal and elevated LVEDP with p value (0.001 and 0.006) respectively while there was a non-significant correlation between E/E’
How to cite this paper: Kamel, M., Beshay, M., Shalaby, S., Emara, A. and Rahman, M.A. (2019) Correlation of Invasively Es-timated Left Ventricular End Diastolic Pressure with Acceleration of E’ Wave by Tissue Doppler Imaging of Mitral Annulus. World Journal of Cardiovascular Diseases, 9, 681-691.
https://doi.org/10.4236/wjcd.2019.99061
Received: August 19, 2019 Accepted: September 21, 2019 Published: September 24, 2019
Copyright © 2019 by author(s) and Scientific Research Publishing Inc. This work is licensed under the Creative Commons Attribution International License (CC BY 4.0).
DOI: 10.4236/wjcd.2019.99061 682 World Journal of Cardiovascular Diseases and LVEDP within grey zone group. Conclusion: E’ acceleration rate could be used as a reliable index to assess LVEDP.
Keywords
LV End Diastolic Pressure, E Annular Wave Acceleration
1. Introduction
The assessment of left ventricular (LV) diastolic function should be an integral part of a routine examination, particularly in patients presenting with dyspnea or heart failure. About half of patients with new diagnoses of heart failure have normal or near normal global ejection fractions (EFs). These patients are diag-nosed with “diastolic heart failure” or “heart failure with preserved EF” [1]. Technical advances in the noninvasive imaging modalities have allowed the as-sessment of LV mechanics which has resulted in the development of novel pa-rameters that can play a promising role in the quantification of LV diastolic function [2]. In some patients, elevated filling pressure is observed only during exercise; therefore, normal filling pressure at rest does not exclude clinically sig-nificant diastolic dysfunction. There is no single noninvasive index that provides a direct measure of relaxation, restoring forces, compliance, or LV filling pres-sure [3] [4].
The aim of this study is to assess the relation between the degree of invasively measured LVEDP and the acceleration rate of E’ wave of mitral annular Doppler tissue.
2. Patients and Methods
The study was conducted on 60 consecutive patients scheduled for coronary an-giography and left-sided heart catheterization to measure LVEDP in cardiology department, Menoufia University Hospital from Augustus 2017 to October 2018; Patients were enrolled in the study after their informed consent and approval by the Committee of Ethics of Menoufia University Hospital were obtained. Pa-tients with acute myocardial infarction, significant coronary artery disease proved by coronary angiography, atrial fibrillation, left bundle branch block, mitral and/or aortic prosthesis, mitral stenosis, annular mitral calcification, more than mild primary valvular regurgitation, pericardial diseases, and con-traindications to dye were excluded from the study. All patients underwent de-tailed history taking, thorough physical examination and 12-lead ECG.
2.1. Cardiac Catheterization
DOI: 10.4236/wjcd.2019.99061 683 World Journal of Cardiovascular Diseases ventricular end diastolic pressure (LVEDP) was obtained by computer record-ing. Included patients were classified into three groups according to LVEDP as follow:
Group I (Normal): include 20 patients with normal LVEDP < 10 mmHg, Group II (Grey zone): include 20 patients with mild increase LVEDP 10 - 14 mmHg and Group III (Elevated): include 20 patients with elevated LVEDP ≥ 15 mmHg.
2.2. Conventional Echocardiography
Transthoracic echocardiographic examination was done using a commercially available echo machine (vivid E9, GE Medical Systems, Milwaukee,) according to the American Society of echocardiography recommendations [5] [6]. Con-ventional Echocardiography measuring: left atrial, LV end diastolic and sys-tolic dimensions, EF, Septal and Posterior wall thickness. Mitral inflow was analyzed where E/A ratio and E/E’ ratio were measured. Continuous-wave Doppler was used to estimate systolic pulmonary artery pressure from the tri-cuspid regurgitation velocity. All Doppler values represent the average of 3 consecutive beats.
2.3. Tissue Doppler Imaging (DTI)
In the apical 4 chamber view, a 4 - 5 mm sample volume was placed at the septal and lateral margins of the mitral annulus and the cursor was oriented so that it is parallel to the direction of mitral annular motion. Velocities of early (E’) and late (A’) diastolic waves and peak systolic (S) wave were recorded and E’/A’ ratio was calculated and averaged from both annular sites. Myocardial isovolumic relaxa-tion time (IVRT) was measured from the end of S wave to the onset of E’ wave. Acceleration time of E’ wave (E’ Acc time) was measured from onset to peak of E’ wave and acceleration rate of E’ wave (E’ Acc rate) was calculated as peak E’ velocity divided by E’ Acc time.
Statistical analysis:
Data were analyzed using SPSS software. Quantitative data expressed as mean and standard deviation Chi square test student t test, Mann whiney U test, Kruskal Walls test and correlation coefficient test.
3. Results
DOI: 10.4236/wjcd.2019.99061 684 World Journal of Cardiovascular Diseases
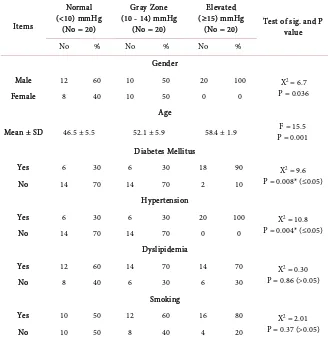
Table 1. Demographic criteria and risk factors of study population.
Items
Normal (<10) mmHg
(No = 20)
Gray Zone (10 - 14) mmHg
(No = 20)
Elevated (≥15) mmHg
(No = 20) Test of sig. and P value
No % No % No %
Gender
Male 12 60 10 50 20 100 X2 = 6.7
P = 0.036 Female 8 40 10 50 0 0
Age
Mean ± SD 46.5 ± 5.5 52.1 ± 5.9 58.4 ± 1.9 P = 0.001F = 15.5 Diabetes Mellitus
Yes 6 30 6 30 18 90 X2 = 9.6
P = 0.008* (≤0.05) No 14 70 14 70 2 10
Hypertension
Yes 6 30 6 30 20 100 X2 = 10.8
P = 0.004* (≤0.05) No 14 70 14 70 0 0
Dyslipidemia
Yes 12 60 14 70 14 70 X2 = 0.30
P = 0.86 (>0.05)
No 8 40 6 30 6 30
Smoking
Yes 10 50 12 60 16 80 X2 = 2.01
P = 0.37 (>0.05) No 10 50 8 40 4 20
while there was a highly significant progressive increase in LAD, TR velocity and PASP from group I to group III.E wave peak velocity and E/A ratio were maxi-mum in group III and lowest in group II (Table 2).
Regarding TDI parameters, there was significant progressive decrease in E’ acceleration rate and E’ peak velocity from group I to group III while there was significant progressive increase in E/E’ ratio and E’ acceleration time from group I to group III. IVRT is maximum in group II and lowest in group I (Table 3,
Figures 1-3).
According to peak E’ acceleration rate there was a significant negative correla-tion between E’ acceleracorrela-tion rate and LVEDP in all three groups, with p value of (P 0.003, 0.044 and 0.021 respectively) (Tables 4-6, Figures 1-3).
Regarding E/E’ ratio it was noticed that There was a significant positive corre-lation in predicting normal and elevated LVEDP with p value (0.001 and 0.006) respectively while there was a non-significant correlation between E/E’ and LVEDP within grey zone group (p value = 0.138) (Tables 4-6).
DOI: 10.4236/wjcd.2019.99061 685 World Journal of Cardiovascular Diseases
Table 2. Comparison between studied groups as regarding conventional
echocardio-graphic parameters.
Parameter Mean ± SD
Normal <10 mmHg
(No = 20)
Gray Zone 10 - 14 mmHg
(No = 20)
Elevated ≥15 mmHg
(No = 20) Test of sig. & P value LVIDd (cm): 5.01 ± 0.27 5.02 ± 0.19 5.3 ± 0.35 P = 0.06 LVIDs (cm): 3.5 ± 0.29 3.4 ± 0.23 3.6 ± 0.36 P = 0.67 EDV (ml): 106.1 ± 17.5 104.0 ± 19.4 114.2 ± 14.7 P = 0.39 ESV (ml): 44.1 ± 8.8 40.7 ± 9.4 43.1 ± 7.2 P = 0.07 SV (ml): 62.1 ± 10.2 63.3 ± 13.1 71.1 ± 10.9 P = 0.18 EF (%): 62.9 ± 3.4 60.2 ± 1.7 61.2 ± 1.6 P = 0.07 AO (cm): 3.4 ± 0.35 3.6 ± 0.47 3.7 ± 0.65 P = 0.38 LA (cm): 3.7 ± 0.18 3.8 ± 0.33 4.4 ± 0.26 P = 0.001 E (cm/s): 91 ± 7.4 66.5 ± 11.7 100.2 ± 9.3 P = 0.04 A (cm/s): 54.2 ± 8.3 73.5 ± 12.2 59.1 ± 17.7 P = 0.04 E/A (ratio): 1.2 ± 0.31 0.91 ± 0.19 1.7 ± 0.54 P = 0.027
[image:5.595.210.538.367.584.2]TR (m/s): 1.9 ± 0.14 2.5 ± 0.26 3.1 ± 0.30 P = 0.001 PASP (mmHg): 24.8 ± 2.02 35.5 ± 5.3 48.8 ± 7.5 P = 0.001
Table 3. Comparison between studied groups as regarding TDI parameters.
Parameter to be estimated <10 mmHg Normal (No = 20)
Gray Zone 10 - 14 mmHg
(No = 20)
Elevated ≥15 mmHg
(No = 20) Test of sig. & P value E’ (cm/s):
Mean ± SD 8.7 ± 1.8 6.3 ± 1.5 4.9 ± 0.69 P = 0.001 F = 17.8 A’ (cm/s):
Mean ± SD 7.3 ± 0.55 7.8 ± 1.2 6.03 ± 1.1 Kruskal Wallis H = 11.3 P = 0.004 E’/A’ (ratio):
Mean ± SD 1.2 ± 0.22 0.82 ± 0.08 0.81 ± 0.07 Kruskal Wallis H = 9.8 P = 0.07 E/E’ (ratio):
Mean ± SD 7.2 ± 1.02 11.01 ± 3.1 15.4 ± 2.5 Kruskal Wallis H = 20.6 P = 0.003 IVRT (ms):
Mean ± SD 72.8 ± 3.5 108.8 ± 3.4 83.6 ± 23.1 P = 0.001 F = 18.3 E’ Acceleration time (ms):
Mean ± SD 37.8 ± 1.8 39.0 ± 2.9 41.4 ± 2.9 Kruskal Wallis H = 7.9 P = 0.019 E’ Acceleration rate
(cm/s2): Mean ± SD 230.6 ± 55.7 164.2 ± 48.6 121.1 ± 25.4 Kruskal Wallis H = 15.1 P = 0.001
EF: Ejection fraction; LA: left atrium; TR: Tricuspid Regurgitation; PASP: Pulmonary artery systolic pres-sure; Acc: Acceleration.
Table 4. Correlations between E/E’, E’ acceleration rate, and LVEDP within normal
group of LVEDP (<10 mmHg).
E/E’ E’ acceleration rate LVEDP
E/E’ Pearson Correlation 0 - 0.749 0.772 Sig. (2-tailed) 0.002 0.001
[image:5.595.211.540.654.730.2]DOI: 10.4236/wjcd.2019.99061 686 World Journal of Cardiovascular Diseases
Table 5. Correlations between E/E’, E’ acceleration rate, and LVEDP within grey zone
group of LVEDP (10 - 14 mmHg).
E/E’ E’ acceleration rate LVEDP
E/E’ Pearson Correlation −0.595 0.679 Sig. (2-tailed) 0.213 0.138
E’ acceleration rate Pearson Correlation −0.595 0 - 0.823 Sig. (2-tailed) 0.213 0.044
Figure 1. Mitral flow and DTI from patient in group (I). Pulsed wave Doppler of mitral
[image:6.595.206.541.89.656.2]DOI: 10.4236/wjcd.2019.99061 687 World Journal of Cardiovascular Diseases
Table 6. Correlations between E/E’, E’ acceleration rate, and LVEDP within elevated
group of LVEDP (≥15 mmHg).
E/E’ E’ acceleration rate LVEDP
E/E’ Pearson Correlation −0.870 0.790 Sig. (2-tailed) 0.001 0.006
E’ acceleration rate Pearson Correlation −0.870 . −0.710 Sig. (2-tailed) 0.001 0.021
Figure 2. Mitral flow and DTI from patient in group (2). Pulsed wave Doppler of mitral
[image:7.595.207.541.89.658.2]DOI: 10.4236/wjcd.2019.99061 688 World Journal of Cardiovascular Diseases
Table 7. Analysis of ROC curve between E/E’ and E’ acceleration rate as regard LVEDP.
Test Result Variable(s) Area Under the Curve AUC Cut off point Sensitivity Specificity R P value
E/E’ 0.991 9.82 87% 21% 0.95 0.001 E’ acceleration rate 0.054 132 42% 93% −0.87 0.001
Figure 3. Mitral flow and DTI from patient in group (3). Pulsed wave Doppler of mitral
inflow (upper image) and Pulsed wave tissue Doppler Imaging from the apical 4 chamber view sampling from the medial mitral annulus (middle image). Note the reduced peak E’ velocity (3 cm/s) with peak E’ acceleration rate (56 cm/s2) as E’ acceleration time was (53 ms) (lower image) and in patient with pseudonormal (PN) pattern denoting elevated LAP.
4. Discussion
pro-DOI: 10.4236/wjcd.2019.99061 689 World Journal of Cardiovascular Diseases gressive decrease in E’ acceleration rate from group I to group III and there was a significant negative correlation between E’ acceleration rate and LVEDP in all three groups. Second: there was significant progressive increase in E/E’ ratio from group I to group III and there was a significant positive correlation in pre-dicting normal and elevated LVEDP while there was a non-significant correla-tion between E/E’ and LVEDP within grey zone group. Third: There were highly significant progressive increases in LAD, TR velocity and PASP from group I to group III.
4.1. E’ Acceleration Rate in Patients with Diastolic Dysfunction
In our study, similar to peak E’ velocity, peak acceleration rate of E’ was signifi-cantly lower in patients with elevated LV filling pressure (group III) compared to other two groups of LVEDP (P value ≤ 0.001) and there was significant negative correlation between E’ acceleration rate and LVEDP, consistent with the result of Qinyun Ruan, et al.[7] study which reported that the peak acceleration rate of E’, at either side of the mitral annulus, in patients with impaired LV relaxation (IR, PN, and Res groups) was significantly lower than in the age-matched con-trol group. Overall its accuracy in identifying patients with impaired relaxation and elevated filling pressures was similar to peak E’ velocity [7].
4.2. E/E’ Ratio in Patients with Diastolic Dysfunction
In our study we found that (E/E’) showed a statistically significant higher values in elevated group of LVEDP compared to other two groups and there was posi-tive correlation between E/E’ and LVEDP but there was a non-significant corre-lation within grey zone group (p value = 0.138)., S.F. Nagueh, et al.[8] suggests that the mitral E/E’ ratio is of supportive value for the non-invasive prediction of the LVEDP. Arteaga et al. [9], Kasner M et al. [10] and Yu, et al. [11] reported that the ratio between transmitral E and E’ (E/E’) correlates well with LV filling pressure or pulmonary capillary wedge pressure (PCWP). Ommen SR et al. [12] also reported that Patients with E/E’ < 8 can be classified as normal filling pres-sure and if there is a normal left atrial size, normal diastolic function can be di-agnosed. Those with E/E’ > 15 have raised filling pressure. But in contrast to many studies that reported weak correlations between E/E’ ratio and LV filling pressure. Oleg F et al.[13] reported there was no clear or sufficient evidence to support that E/E’ can reliably estimate LVFP in preserved EF as the diagnostic accuracy of E/E’ to identify/exclude elevated LVFP and DD/HFpEF is limited and requires further validation in a well-designed prospective clinical trial. Ma-rio Previtali et al. [14] suggested that the mitral E/E’ ratio is of limited value for the non-invasive prediction of the LVEDP in the individual patients.
DOI: 10.4236/wjcd.2019.99061 690 World Journal of Cardiovascular Diseases
5. Conclusion
TDI derived E’ peak acceleration rate was found to be a useful index to assess LVEDP especially in patients with advanced LV diastolic dysfunction.
Limitations
The sample size was small and we are in need for larger study with different cat-egory of patients (normal versus depressed LV systolic function) to validate this parameter.
Conflicts of Interest
The authors declare no conflicts of interest regarding the publication of this pa-per.
References
[1] Paulus, W.J., Tschope, C., Sanderson, J.E., Rusconi, C., Flachskampf, F.A., Rade-makers, F.E., et al. (2007) How to Diagnose Diastolic Heart Failure: A Consensus Statement on the Diagnosis of Heart Failure with Normal Left Ventricular Ejection Fraction by the Heart Failure and Echocardiography Associations of the European Society of Cardiology. European Heart Journal, 28, 2539-2550.
https://doi.org/10.1093/eurheartj/ehm380
[2] Flachskampf, F.A., et al. (2015) Cardiac Imaging to Evaluate Left Ventricular Dias-tolic Function. JACC: Cardiovascular Imaging, 8, 1071-1093.
https://doi.org/10.1016/j.jcmg.2015.07.004
[3] Kitzman, D.W., Higginbotham, M.B., Cobb, F.R., Sheikh, K.H. and Sullivan, M.J. (1991) Exercise Intolerance in Patients with Heart Failure and Preserved Left Ven-tricular Systolic Function: Failure of the Frank-Starling Mechanism. Journal of the American College of Cardiology, 17, 1065-1072.
https://doi.org/10.1016/0735-1097(91)90832-T
[4] Ha, J.W., Oh, J.K., Pellikka, P.A., et al. (2005) Diastolic Stress Echocardiography: A Novel Noninvasive Diagnostic Test for Diastolic Dysfunction Using Supine Bicycle Exercise Doppler Echocardiography. Journal of the American Society of Echocar-diography, 18, 63-68.https://doi.org/10.1016/j.echo.2004.08.033
[5] Simpson, I.A. (1997) Echocardiographic Assessment of Long Axis Function: A Sim-ple Solution to a ComSim-plex Problem? Heart, 78, 211-212.
https://doi.org/10.1136/hrt.78.3.211
[6] Picard, M.H., et al. (2011) Recommendations for Quality Echocardiography. Journal of the American Society of Echocardiography, 24, 1-10.
https://doi.org/10.1016/j.echo.2010.11.006
[7] Ruan, Q.Y., Rao, L.Y., Middleton, K.J., Khoury, D.S. and Nagueh, S.F. (2006) As-sessment of Left Ventricular Diastolic Function by Early Diastolic Mitral Annulus Peak Acceleration Rate: Experimental Studies and Clinical Application. Journal of Applied Physiology, 100, 679-684.https://doi.org/10.1152/japplphysiol.00671.2005
DOI: 10.4236/wjcd.2019.99061 691 World Journal of Cardiovascular Diseases [9] Arteaga, R.B., Hreybe, H., Patel, D. and Landolfo, C. (2008) Derivation and Valida-tion of a Diagnostic Model for the EvaluaValida-tion of Left Ventricular Filling Pressures and Diastolic Function Using Mitral Annulus Tissue Doppler Imaging. American Heart Journal, 155, 924-929. https://doi.org/10.1016/j.ahj.2007.11.040
[10] Kasner, M., Westermann, D., Steendijk, P., et al. (2007) Utility of Doppler Echocar-diography and Tissue Doppler Imaging in the Estimation of Diastolic Function in Heart Failure with Normal Ejection Fraction: A Comparative Doppler-Conductance Catheterization Study. Circulation, 11, 637-647.
https://doi.org/10.1161/CIRCULATIONAHA.106.661983
[11] Yu, C.M., Sanderson, J.E., Marwick, T.H. and Oh, J.K. (2007) Tissue Doppler Im-aging a New Prognosticator for Cardiovascular Diseases. Journal of the American College of Cardiology, 49, 1903-1914.https://doi.org/10.1016/j.jacc.2007.01.078
[12] Ommen, S.R., Nishimura, R.A. and Appleton, C.P. (2000) Clinical Utility of Dopp-ler Echocardiography and Tissue DoppDopp-ler Imaging in the Estimation of Left Ven-tricular Filling Pressures. Circulation, 102, 1788-1794.
https://doi.org/10.1161/01.CIR.102.15.1788
[13] Sharifov, O.F., Schiros, C.G., Aban, I., Denney, T.S. and Gupta, H. (2016) Diagnos-tic Accuracy of Tissue Doppler Index E/E’ for Evaluating Left Ventricular Filling Pressure and Diastolic Dysfunction/Heart Failure with Preserved Ejection Fraction: A Systematic Review and Meta-Analysis. Journal of the American Heart Associa-tion, 5, e002530.https://doi.org/10.1161/JAHA.115.002530
[14] Previtali, M., Chieffo, E., Ferrario, M. and Klersy, C. (2012) Is Mitral E/E’ Ratio a Reliable Predictor of Left Ventricular Diastolic Pressures in Patients without Heart Failure? EuropeanJournalofEchocardiography, 13, 588-595.
https://doi.org/10.1093/ejechocard/jer286
[15] Lindqvist, P., Wikstorm, G. and Waldenstorm, A. (2008) The Use of E/E’ and The Time Interval Difference of Isovolumic Relaxation (TIVRT-IVRTM) in Estimating Left Ventricular Filling Pressure. European Journal of Heart Failure, 10, 490-497. https://doi.org/10.1016/j.ejheart.2008.03.005