October 15, 2015
Particle acceleration at reconnecting separator current layers
J. Threlfall, J. E. H. Stevenson, C. E. Parnell, and T. Neukirch
School of Mathematics and Statistics, University of St Andrews, St Andrews, Fife, KY16 9SS, U.K. e-mail: {jwt9;jm686;cep;tn3}@st-andrews.ac.uk
ABSTRACT
Aims.The aim of this work is to investigate and characterise particle behaviour in a 3D MHD model of a reconnecting magnetic separator.
Methods.We use a relativistic guiding-centre test-particle code to investigate electron and proton acceleration in snapshots from 3D MHD separator reconnection experiments, and compare the results with findings from an analytical separator reconnection model studied in a previous investigation.
Results.The behaviour (and acceleration) of large distributions of particles are examined in detail for both analytical and numerical separator reconnection models. Differences in acceleration sites are recovered and discussed, together with the dependence of final particle energy ranges upon the dimensions of the models and the stage of the (time-dependent) MHD reconnection event. We discuss the implications of these results for observed magnetic separators in the solar corona.
Key words. Plasmas - Sun: corona - Sun: magnetic fields - Sun: activity - Acceleration of particles
1. Introduction
Particle acceleration is one of the most commonly observed and yet possibly least well understood phenomena recorded during a solar flare. The mechanism through which electrons/protons may be rapidly accelerated to tens of MeV/several GeV repre-sents one of the biggest unsolved problems in solar physics to date (see e.g.Fletcher et al. 2011;Cargill et al. 2012, and refer-ences therein). It is generally accepted that magnetic reconnec-tion plays a role on some level in the accelerareconnec-tion process.
Magnetic reconnection is a fundamental (space and labo-ratory) plasma physics mechanism. It lies at the heart of many dynamic solar, magnetospheric and astrophysical phenomena. It is a process by which local and global magnetic fields restruc-ture into more energetically favourable configurations convert-ing considerable amounts of magnetic energy into bulk plasma motions, thermal energy, as well as accelerating particles (e.g.
Priest & Forbes 2000;Birn & Priest 2007). As shown, for ex-ample, by Schindler et al. (1988); Hesse & Schindler (1988);
Schindler et al.(1991) it is generically associated with parallel electric fields: these parallel electric fields are likely candidates to accelerate particles.
Macroscopic (e.g. magnetohydrodynamic, or MHD) mod-els of reconnection events are insufficient to model plasma be-haviour at very small (microscopic) scales. Plasma bebe-haviour at these scales can be uncovered using, for example, a test parti-cle approach. While early test partiparti-cle studies chose to focus on acceleration in two or two and a half dimensional (2D or
2.5D) reconnection models (for simplicity), more recent stud-ies are now able to consider particle behaviour in fully three-dimensional (3D) reconnection experiments (a more comprehen-sive discussion of 2D/2.5D/3D models of particle behaviour can be found in, for example,Threlfall et al. 2015). Of these more recent 3D experiments, some investigate particle acceleration as-sociated with single isolated topological features, whilst others study acceleration in more complex scenarios where the recon-nection takes place at multiple sites within the modelled large-scale structures. One of these topological features, a magnetic separator, has (until recently) been overlooked in regard to their capacity as a potential particle accelerator, despite evidence of their importance in various magnetic interaction events, such as flux emergence (e.g.Parnell et al. 2010b), which is often associ-ated with solar flares.
Magnetic separators are single magnetic field lines which link pairs of magnetic null points, lying at the intersection of four topologically distinct flux domains. In so doing, they may be loosely regarded as the 3D analogue of a 2D X-point or 2.5D X-line configuration. Separators are likely sites of current sheet formation (Lau & Finn 1990;Haynes et al. 2007;Parnell et al. 2010a; Stevenson et al. 2015), providing unique conditions for the accumulation of high current density on a large scale. Unlike 3D null-points, magnetic separators have the potential to traverse vast distances within the solar corona (Close et al. 2004;Parnell et al. 2010b; Platten et al. 2014); at these locations magnetic reconnection would be no longer constrained in highly localised
Fig. 1: Illustration of the topological features in the initial mag-netic field of the separator reconnection experiments. Both ex-periments considered here (MHS1 and MHS2) have two separa-trix surfaces which intersect at a single magnetic field line, called a separator, linking (oppositely-signed) magnetic null points.
regions (as it is at 3D null-points), but may take place across extended regions.
Separator reconnection has been observed in the solar corona (Longcope et al. 2005) and its presence has been con-firmed within Earth’s magnetosphere through in situ observa-tions (e.g.Xiao et al. 2007;Deng et al. 2009;Guo et al. 2013), and also numerical models (e.g.Dorelli & Bhattacharjee 2008;
Komar et al. 2013). Observational support for particle accelera-tion models based on separator reconnecaccelera-tion events can also be found in the literature (e.g. Metcalf et al. 2003). Despite this, only a single attempt has been made thus far to model particle behaviour in the vicinity of a reconnecting magnetic separator. In this work,Threlfall et al.(2015) were able to show that the par-allel electric field generated along a magnetic separator is suffi -cient to rapidly accelerate test particles to non-thermal energies. For this first investigation of particle behaviour in a separator re-connection event,Threlfall et al.(2015) used a simple analytical (kinematic) model. We will attempt to extend this initial inves-tigation, by studying particle behaviour in MHD experiments of current sheet formation (Stevenson et al. 2015) and reconnection (Stevenson & Parnell submitted) at magnetic separators.
The primary objective of the present work is to determine how particles behave in the vicinity of a typical separator re-connection event. To do this, we will compare orbits based on a simple analytical model of separator reconnection (detailed in
Threlfall et al. 2015), with orbits obtained from a recent detailed study of a numerical separator reconnection event, where a sep-arator (initially in magnetohydrostatic, or MHS, equilibrium) is allowed to reconnect (Stevenson & Parnell submitted). The pa-per is organised as follows: in Sect.2we discuss our approach
to the problem, introducing both the global environment of the MHD experiments (described in Sect. 2.1) and the equations which govern test particle motion (in Sect.2.2). General com-parisons between the analytical and numerical separator recon-nection model snapshots, and their impact on particle behaviour are discussed in Sect.3before an examination of changes in orbit behaviour over the course of the reconnection event is presented in Sect.4. A discussion of our findings is presented in Sect.5
followed by our conclusions and future areas of study which are outlined in Sect.6.
2. Model setup
Our model can be broadly split into two parts: a snapshot taken from a time-dependent MHD experiment (modelling the dissipa-tion of current held in MHS equilibrium and accumulated along a separator) into which we insert particles, and the test particle motion itself. A brief overview of both parts are described in the following sections:
2.1. MHD separator reconnection model
In this paper, we consider MHD separator reconnection exper-iments starting from two MHS equilibrium fields, which were formed in an identical manner to that detailed inStevenson et al.
(2015), i.e., through the non-resistive relaxation of an analytical magnetic field using the MHD code Lare3d (Arber et al. 2001). This analytical field consists of two oppositely-signed 3D null points whose separatrix surfaces intersect to form a separator, which lies along thez-axis linking the nulls (and is similar to the configuration shown in Fig.1).
Before the non-resistive relaxation begins, the plasma pres-sure and current are uniform, with the current directed paral-lel to the separator along thez-axis. However, since the analyt-ical field is not in force-balance, as soon as the non-resistive relaxation experiment begins the Lorentz force causes the sep-aratrix surfaces of the nulls to collapse towards each other. This leads to a strong twisted current layer forming along the separa-tor and regions of enhanced/diminished plasma pressure form-ing within/outwith cusps about the separator. As the relaxation continues a plasma pressure force acts to counter-balance this collapse until the Lorentz and plasma pressure forces balance. A MHS equilibrium is achieved everywhere in a finite time, except very locally about the separator (where the current layer exists) and very close to the separatrix surfaces (where the current is enhanced): in these regions due to an infinite time singularity very small residual forces remain (seeStevenson et al. 2015, for details). Note that in this work we use the phrase "separatrix sur-face" and "fan plane" interchangeably.
studied in detail inStevenson & Parnell submitted). The value of the resistivity is zero unless the current is above a given thresh-old, jcrit. The value of jcrit is chosen such that only the strong current within the separator current layer (and not the enhanced current on the separatrix surfaces of the nulls) is involved in the reconnection.
The two MHS equilibrium fields from which we start our MHD reconnection experiments (MHS1 and MHS2) have a sim-ilar topological make up to that discussed in Stevenson et al.
(2015) and are formed in the same way. Each contains a twisted current layer lying along the separator which has equilibrium lengthlsep. These two fields are very similar; the only differences are noted in Table1. Specifically, MHS1 has a low plasma beta away from the nulls and at the separator, which runs along the z-axis linking the two nulls that lie a distance of almost 3 apart. In MHS2, the plasma beta is high, all along the single shorter separator.
[image:3.595.309.558.132.269.2]Both MHS fields have dimensionless domain size −1 ≤ x,y ≤ 1 with a grid resolution of (512,512,768). Particle ac-celeration in a single snapshot of the reconnection model start-ing with MHS1 is discussed in Sect. 3.2. The nature and con-sequences of the reconnection which occurs in the model start-ing from MHS2 is detailed in (Stevenson & Parnell submitted) and the particle acceleration determined in various snapshots throughout this reconnection experiment are discussed in Sect.4.
Table 1: Non-dimensional values for two initial MHS equilibria, MHS1 and MHS2, with separator lengthslsep along thez-axis, the mean value of the plasma beta, ¯β, the plasma beta half-way along the separator, βlsep/2, the peak value of the current along the main separator and the value of jcritused in the reconnection experiment.
Parameter MHS1 MHS2
lsep 2.87 1.18
zdimensions −1≤z≤4 −1.75≤z≤2.75 ¯
β 0.77 4.83
βlsep/2 0.72 115.50
Peak|j|along sep. 26.19 22.40
jcrit 18 10
2.2. Relativistic particle dynamics
Having established the separator reconnection environment which we will study, all that remains is to outline the equations which will govern particle behaviour. The approach we use is identical to that ofThrelfall et al.(sub.), which was applied to the study of particle behaviour in MHD simulations of a non-flaring active region, and alsoThrelfall et al.(2015), which investigated acceleration in an analytical separator reconnection model. Sim-ilar test-particle studies using MHD experiments with different reconnecting magnetic configurations have been performed by (e.g.Gordovskyy & Browning 2011;Gordovskyy et al. 2014).
Very briefly, a particle with rest-massm0, chargeqand rela-tivistic magnetic moment,µr, will move around its guiding cen-tre, located atR, subject to a magnetic fieldB(with magnitude B(= |B|) and unit vectorb(= B/B)) and an electric fieldE ac-cording to the following equations:
duk dt =
d dt γvk
=γu
E·
db
dt + ΩscltsclEk−
µr
γ
∂B
∂s, (1a)
˙
R⊥=uE+
b B?? ×
( 1
Ωscltscl "µ
r
γ ∇B?+
vscl2
c2 uE
∂B?
∂t
!
+ukdb dt +γ
duE
dt #
+vscl2
c2
uk
γEkuE
)
, (1b)
dγ dt =
vscl2
c2 "
Ωscltscl R˙⊥+ uk
γb
! ·E+µr
γ
∂B?
∂t
#
, (1c)
µr=
γ2v2
⊥
B , (1d)
where, for a given quantityX(representing eitherE orB),X? andX??are defined as
X?=X 1− 1 c2
E⊥2 B2
!12
, X??=X 1− 1
c2
E⊥2 B2
! .
Note,X?andX?? retain the dimensions ofX, since the multi-plying quantities are dimensionless.
The particle orbit behaviour is particularly affected by guid-ing centre drifts. The majority of behaviour changes are often caused by the E ×B drift, which causes the orbit to drift at a velocity uE(= E? ×b/B). The components of velocity and electric field that are aligned with the magnetic field (from now on known as the parallel velocity and parallel electric field) are
vk(=b·R) and˙ Ek(=b·E), respectively.v⊥is the gyro-velocity,
˙
R⊥(=R˙ −vkb) is the perpendicular component of guiding
cen-tre velocity, andsis an arc-length along the magnetic field-lines. Finally, for simplicity of notation a relativistic parallel velocity
uk(=γvk), whereγ
=c/c2−v21/2is the Lorentz factor. In this work we consider either electrons or protons thus, for electrons, the rest mass and charge arem0=me=9.1×10⁻³¹kg andq=e=−1.6022×10⁻¹⁹C, respectively. For protons the rest mass and charge arem0 = mp =1.67×10⁻²⁷kg andq =|e|= 1.6022×10⁻¹⁹C.
Eqs. (1) have been non-dimensionalised. To recover di-mensional values, appropriate didi-mensional parameters are ap-plied. Since this work is motivated by the behaviour of par-ticles in a solar coronal environment, for all the MHD ex-periments the normalising parameters for the magnetic field, length and time are bscl = 10 G, lscl = 1 Mm and tscl = 20 s, respectively. Thus, velocities in the model are scaled by vscl(= lscltscl−1) = 5×10⁴ms−1, electric fields by escl(=
bscllscltscl−1 = bsclvscl) = 50 Vm−1 and energies by KEscl(=
comparison with earlier investigations (Threlfall et al. 2015), the normalising parameters for the analytical separator model used in Sect.3.1differ from above.
In this investigation, we will (where possible) use a scale-free form in any discussion of results. A description of how this scale-free form is derived can be found in Sect.3.
In order to determine the particle behaviour, Eqs. (1) are evolved in time using a 4th order Runge-Kutta scheme with a variable timestep, according to the electric and magnetic fields found in a single snapshot of the particular numerical MHD experiment. In Sect.3.1 the MHD experiment considered is that which starts from the initial equilibrium MHS1, whilst in Sect.3.2the MHD snapshots come from the experiment starting with MHS2. Details of the MHD behaviour of these experiments are outlined inStevenson & Parnell(submitted).
Using the test particle approach in this way requires that the gyro-radius and gyro-period of each orbit must remain well be-low the normalising lengthscales and timescales of the macro-scopic MHD environment. The validity of this assumption is tested and discussed in Sec.3.
3. Comparison with analytical separator model
In order to build up a general picture of particle orbit behaviour in the vicinity of a reconnecting magnetic separator, we first compare orbits found in the numerical MHD experiments of separator reconnection, with orbits recovered from an analytical model of separator reconnection.
3.1. Scale-free results ofThrelfall et al.(2015)
The work highlighted inThrelfall et al.(2015) showed that it was possible even for a simple analytical model of separator recon-nection to generate particle acceleration of electrons and protons to non-thermal energies. In order to achieve this,Threlfall et al.
scaled the (non-dimensional) model ofWilmot-Smith & Hornig
(2011) using (approximately) solar coronal values, and restricted the model parameters to obtain a reconnection region/current sheet width of appropriate size (approximately 10 ion inertial lengths, 10c/ωpi, whereωpiis the local plasma frequency). How-ever, as discussed inThrelfall et al.(2015), these results are en-tirely scalable; applying a different field strength, lengthscale or timescale to the model ofWilmot-Smith & Hornig(2011) would yield identical orbits, energy gains, etc, multiplied by some fac-tor. In order to directly compare and contrast the analytical and numerical models independently of any applied scales, we first recast some of the results ofThrelfall et al.(2015), in Fig.2, to highlight exactly how different scales might affect the resulting energy gains.
Figure2illustrates the scale independent results of the ana-lytical model; for the chosen reconnection region width of 72 m and height (20 Mm) along a separator of length 100 Mm with a field strength of 10 G studied for 100 s, we may recover peak particle energies of up to 140 keV. Different applied scales
us-ing the same configuration should yield different energy ranges. These energy ranges can be recovered by scaling the results in Fig.2.
The largest contributions to the energy gained in each or-bit results from the work done by the parallel electric field. De-spite the electric field resulting from an inductive magnetic field (rather than the gradient of an applied potential), this can still be interpreted as a form of potential difference (see e.g.Schindler et al. 1991). Further references to a "potential difference" refer to such a (field-aligned) potential, which results in an energy change of the form:
∆ =Z E||ds=lscl
2b scl
tscl Z
˜
E||ds˜=lscl 2b
scl
tscl ˜
∆,
where the barred quantities represent the normalised equiva-lent of each variable. Changing the scale of the global envi-ronment in the experiment will rescale energy variations in this manner, without requiring any recalculation of particle orbits. Thus, increasing the field strength by a factor of ten increases the peak energy range by that same factor, and hence would re-cover the range found inThrelfall et al.(2015) (they used a field strength of 100 G instead of 10 G, but all other parameters were identical to those used here and they recovered gains of up to 1.4 MeV=10×140 keV).
It is also clear that the choice of lengthscale is critical in these experiments; thelscl2dependence results from a combina-tion of the definicombina-tion of the electric field, and the length over which this field extends. As another example, a 10 G separator of length 10 Mm (reconnection region length 2 Mm) would yield a hundredfold decrease in peak particle energy seen in Fig.2 (re-ducing the peak to 1.4 keV). Thus, we can use the findings pre-sented in Fig.2to broadly estimate particle orbit energy gains in a number of different separator reconnection cases, based on (for example) observations.
Briefly reminding ourselves of the primary findings of
(a) electron initial positions
(c) proton initial positions
(b) electron final positions
[image:5.595.49.544.57.585.2](d) proton final positions
Fig. 2: Analytical separator model (Threlfall et al. 2015);(a)initial positions (closeup around separator) and(b)final positions for electrons with initial pitch angle 45◦and initial kinetic energy of 20 eV.(c)and(d)are the same, but for protons. The colour of each particle identifies the (scaled) peak kinetic energy gained during each orbit (see colour bar). For(b)and(d)thin pink/purple lines are field lines in the fan planes associated with the upper/lower nulls (indicated by trapezoids), and thick pink/purple lines indicate the corresponding null’s spine. Also in these graphs, to aid visualisation, the orb size for each particle has been enhanced in proportion to its final energy. For reference,bscl=10 G,lscl=10 Mm, andtscl=100 s for these orbit simulations.
3.2. Scale-free numerical reconnection model results
For comparison with the (now scale-free) analytical kinematic separator reconnection model, we first study a single snapshot from the numerical separator reconnection event starting from MHS1, at the time when the rate of reconnection is close to its
peak value. We will compare the orbits described in Sec.3.1with orbits determined from this MHD snapshot.
in x &y. The reconnection region is determined by a current threshold above which a numerical resistivity of η = 0.001 is applied. The critical current value, jcrit, was chosen to be large enough that current structures would be well resolved by the code, and would only allow the resistivity to act upon a region of strong current along the separator itself. The value ofηis chosen such that it is larger than the numerical resistivity. For reference, the current sheet dimensions are approximately 1×5×134 (width ×breadth×height), for a critical current jcrit=18.
Like the results described in Sec.3.1, the particle simula-tions in this environment begin with a uniform grid of initial conditions. We initialise 2800 particle orbits, each with an initial pitch angle of 45◦and an initial energy of 20 eV in a grid centred on the separator. The grid consists of 7 planes at different verti-cal heights (z=0.375,0.75,1.125,1.50,1.875,2.25,2.625 Mm), while each plane contains 202 positions, evenly spaced from
−0.1,0.1 Mm in x/y. The orbit calculations are terminated if the particle leaves through certain spatial boundaries; for the present investigation, we define these boundaries at −0.6 Mm and 0.6 Mm inx,y, and at 0 Mm and 3 Mm inz. As before, we simulate orbits of both electrons and protons; the results of this survey of both species behaviour can be seen in Fig.3.
Our analysis begins with the distribution of peak energy gain for electrons (Fig.3a) and protons (Fig.3c) illustrated on plots of the initial particle positions. The distribution of final energies relative to the initial particle positions closely reflects the elec-tric field configuration in the MHD model snapshot, in agree-ment with Threlfall et al.(2015). Regions where large energy gains are recovered are strongly associated with regions of cur-rent at/above the current threshold (jcrit) in the model. The same is also true for the analytical separator model results, in Figs.2a
&2c, where the distributions are strongly related to the electric field configuration.
Figures3a &3calso illustrate a vertical asymmetry in en-ergy gains, similar to that seen in the analytical case. Electron acceleration is more strongly associated with the top of the re-connection region compared to protons, which are typically ac-celerated strongly from the bottom. A related asymmetry is read-ily apparent in the analytical case (Figs.2a&2c), but in the op-posite sense, because the electric field configuration inThrelfall et al.(2015) is aligned anti-parallel to the separator (rather than parallel to the separator as it is in the MHD model). Electrons and protons are still capable of significant acceleration from part way along the separator, but spend more time in the electric field when originating at a particular end of the reconnection region; these locations are determined by the sign ofE||within the dif-fusion region.
An initial study of the width of the regions where large en-ergy gains are achieved in Fig.3amight suggest that the accel-eration region is much smaller than that seen in the analytical experiment (e.g. Fig.2a). One must remember, however, that the initial grid seen in Fig.2ais significantly smaller than the rela-tive size of the initial grid seen in Fig.3a. The grid in Fig.2awas
chosen to reflect the width of the reconnection region, which (for the results seen in that image) is approximately 72 m, for a null separation distance of 10 Mm. If the null separation in the MHD experiment was also 10 Mm, the current sheet thick-ness and breadth would approximately be 45 km and 210 km, respectively. The MHD experiment includes a much broader re-connection region (compared to its vertical length) than the an-alytical model. In order to achieve comparable widths, the nu-merical model would either require a dramatic reduction in non-dimensional reconnection region width or breadth (requiring ei-ther a significantly higher resolution or perhaps a new method of defining the reconnection region itself) or a much shorter di-mensional separator length (significantly reducing the particle energy ranges recovered).
The peak energy gains seen in Fig.3are approximately fif-teen times larger than those recovered by the analytical model in Fig.2; for the normalising values used in this experiment, the peak kinetic energy gained in the simulation by both electrons and protons was close to 1.5 MeV. However, a different choice of dimensional quantities would yield higher peak energies. As an example, an increase in length-scale only by a factor of ten (i.e. a null separation distance of 28.7 Mm) would yield a hundred-fold increase in the peak energy gains, allowing particles to (po-tentially) achieve 155 MeV in energy. Applying the same nor-malisation as that used inThrelfall et al.(2015) (bscl = 100 G,
lscl=10 Mm, andtscl=100 s) would scale up the energy distri-bution of these particles further, with a new peak kinetic energy around 310 MeV. Once again, we may use the results presented as a guide, to define an upper bound of particle energy gains for a separator of a certain length defined by, for example, ob-servations (which suggest that lengths≥ 10 Mm are relatively common within the solar atmosphere, as discussed in Sect.5). In defining such an upper bound, it should be borne in mind that the reconnection region size and electric field in the numerical MHD model is much broader and stronger than that specified in the analytical model, due to numerical constraints.
(a) Electron initial positions (−20<x,y<20 km)
(c) Proton initial positions (−20<x,y<20 km)
(b) Electron final positions
[image:7.595.47.551.53.545.2](d) Proton final positions
Fig. 3: Numerical MHD separator model starting from MHS1; Electron(a)initial and(b)final positions, with initial kinetic energy 20 eV and initial pitch angle 45◦.(c)and(d)are the same, but for protons. The colour of each position identifies the (scaled) peak kinetic energy gained during each orbit (see colour bar). For (b) and(d), the grey orbs indicate the initial position grid, while pink/purple lines indicate interpolated field lines in the fan planes associated with the upper/lower null (indicated by trapezoids), and thick pink/purple lines indicate the corresponding null spines. To aid visualisation, the orb size for each final position has been enhanced in proportion to the final energy. For reference,bscl=10 G,lscl=1 Mm, andtscl=20 s for these orbit simulations.
focussed, and are directly aligned with the spines of the relevant null.
Finally, we must confirm that our use of the guiding cen-tre approximation is justified. For the orbits shown in Fig.3, the largest electron gyro-radius recorded is approximately 0.64 m, while the largest proton gyro-radius recorded is 21.1 m; both of these values are much smaller than the normalising length-scale of 1 Mm, and the size of the grid length-scale used in the MHD simulations (3.9 km inx,y, 6.5 km in z). Meanwhile, the largest
electron gyro-period in the experiment was 1.07×10⁻⁷s, while the equivalent proton value approached 1.29×10⁻⁴s. Individual snapshots in the MHD experiments were taken approximately 0.1 s apart (at a normalising timescale of 20 s), and hence both the length and timescales involved in the MHD experiment are much greater than those used in the guiding centre approxima-tion approach used here.
0.001 0.010 0.100 t/tf
0.0 0.5 1.0 1.5
reconnection rate x10
6 [Wb s
−1
]
103
104
105
average kinetic energy gain (top 20% of particles) [eV]
[image:8.595.39.286.66.196.2]electron proton
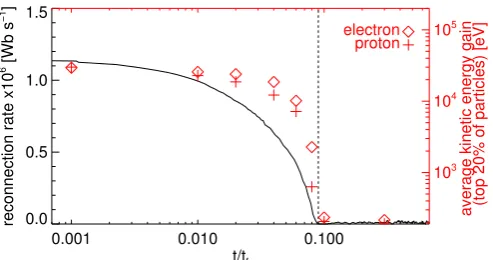
Fig. 4: Time evolution of the reconnection rate in the numerical separator reconnection experiment detailed in Stevenson et al.
(2015), shown in black, overlaid with average values of the top 20% of the range of kinetic energies gained by particle orbits (electron and proton, see legend) at several snapshots of the re-connection experiment (in red). Several of the particle orbit sur-veys performed at these snapshots are studied in further detail in Fig.5. Times are stated relative to a single fast magneto-acoustic wave crossing time along the original separator, while the recon-nection rate is calculated according to the dimensions applied to the MHS2 numerical experiment, (bscl=10 G,lscl=1 Mm, and
tscl=20 s).
for protons, and a maximum electron/proton gyro-period of ap-proximately 1.25×10⁻⁸/9.5×10−6s respectively. While the an-alytical model changes continuously over time (compared to the discrete manner in which the numerical MHD experiment is performed), it too is scaled according to similar length and timescales (lscl = 10 Mm, tscl = 100 s). The disparate nature of these scales and gyro-scales confirm that our guiding centre approach is valid. It is also worth remembering that these orbit calculations are, in principle, scalable; scaling lengths up/down (as discussed earlier) also scales the peak gyro-radius values for these orbit calculations.
4. Time variation
Up to this point, we have only considered a MHD separator re-connection event when the rere-connection rate is close to the peak value. However, as discussed in (Stevenson & Parnell submit-ted), the current sheet which has been built up along the separa-tor dissipates over time. In order to build up a complete picture of particle orbit behaviour during an entire reconnection event, we will now use several different snapshots from the second experiment, MHS2 (detailed inStevenson & Parnell submitted, and previously discussed in Sect.2.1) in order to establish how the behaviour discussed in Sect.3.2changes as the reconnec-tion event progresses. As detailed in Table1, this second experi-ment models a high-beta plasma along a shorter separator (non-dimensional length 1.18). We also retain the normalisation used in the first experiment; once againlscl=1 Mm,bscl =10 G and
tscl=20 s, and hence we model a separator of length 1.18 Mm.
We use several frames from MHS2 as the basis for our par-ticle orbit analysis, again studying both protons and electrons. One can identify two distinct phases of the experiment, based on the reconnection rate shown in Fig.4, recorded in terms of the time taken by a fast magneto-acoustic wave to cross the original separator (tf). Reconnection starts instantly when the experiment starts [t = 0tf], with a peak reconnection rate of 1.14×10⁶Wb s−1(=1.14×10⁶V). This is the start of phase 1, af-ter which the reconnection rate rapidly falls from the peak value to zero [att = 0.090tf, denoted with a dashed line in Fig.4]. The second phase then begins, in which the steady flows left in the wake of the main reconnection phase cause weak, spo-radic reconnection until the end of the experiment [t = 0.5tf]. This weak sporadic reconnection typically keeps the reconnec-tion rate above zero. To gain insight into the particle behaviour, we perform surveys of electron and proton orbits, with ini-tial conditions similar to those outlined in Sect.3.2. We sim-ulate 1792 particle orbits, with an initial pitch angle of 45◦ and an initial energy of 20 eV, which begin in 7 z-planes (at 0.2,0.3,0.4,0.5,0.6,0.7,0.8 Mm) each consisting of 162particles, evenly spaced from [−0.2,0.2] Mm inx/y. The orbit calculations are terminated if the orbit passes beyond [−0.6,0.6] Mm inx/y, and [0,1] Mm inz.
We highlight the behaviour of both electrons and protons by comparing the average kinetic energy of the highest 20% of peak kinetic energies recorded using 8 snapshots at various stages of the experiment against the reconnection rate in Fig.4. In com-paring the average of the peak energies, we aim to capture both a sense of global trends, and the behaviour of the particles which have undergone the most acceleration. In Fig.4, we show that the amount of acceleration of the most highly energised electrons and protons is closely related to the reconnection rate; during phase 1, average peak kinetic energies decrease from∼30 keV to a much lower value (∼ 200 eV) when the reconnection rate becomes close to zero. They remain at this low (thermal) value during phase 2. Figure4 also shows that, in general, the elec-trons and protons behave in the same manner, but that the av-erage peak kinetic energy of protons decreases, approaching the thermal value faster than the electrons as time progresses.
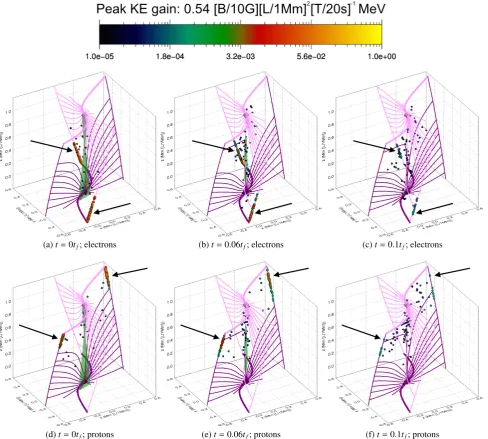
or-(a)t=0tf; electrons (b)t=0.06tf; electrons (c)t=0.1tf; electrons
[image:9.595.56.545.55.494.2](d)t=0tf; protons (e)t=0.06tf; protons (f)t=0.1tf; protons
Fig. 5: Numerical MHD separator model (MHS2); Final electron and proton positions coloured by particle energy gain, based on different snapshots during the MHD experiment. Each row depicts a different snapshot, for electron (top) and proton (bottom) positions, and each is overlaid with the corresponding isosurface of critical current, jcrit(in green) for that snapshot. Black arrows indicate typical final positions of accelerated particles, as a guide; these locations most strongly reflect changes in particle behaviour as experiment evolves. Topological features seen here are coloured in an identical manner to those identified in Fig.1and previous experiments. For reference,bscl=10 G,lscl=1 Mm, andtscl=20 s for these orbit simulations.
der to focus purely on the particles which enter the reconnection region).
Several features are readily apparent from Fig.5. Firstly, the isosurface of critical current diminishes with time; in effect, this shows the volume of the reconnection region decreases over time, until (att=0.09tf) it is no longer present, meaning that the current located at the separator has now dropped below the criti-cal level,jcrit=10. As a result, fewer particles are visible in later stages of the experiment, and of these, many no longer achieve high energy gains. The sites of accelerated particles indicated by black arrows in Fig.5clearly demonstrate this result.
When the reconnection rate is close to its peak value, large numbers of electron/proton orbits are found along the
inter-act with the reconnection region, and the length and strength of the field-aligned potential which causes the acceleration.
Looking again more closely at the sites of accelerated par-ticles indicated by black arrows in Fig.5, we note that the loca-tions reached by those particles which are accelerated move in time; as time progresses, acceleration sites move down the fan planes away from the spines. The field lines which lie close to the separator (and close to the nulls, before extending out into the domain close to the spines of each null) are reconnected first. Field lines which lie further away from the separator are then brought in and are reconnected. These additional field lines are not (initially) close to the separator and neither do they closely approach either null. Instead they are tethered (outside the recon-nection region) within the same fan planes just further from the null-spines. Over time, field lines that originally lie progressively further out from the separator are brought in and reconnected, leading to the accelerated orbit impact sites moving away from the spines along the intersection of the fan plane with the domain boundary.
In comparison with earlier experiments, another difference recovered here are the values of peak kinetic energies gained by the individual orbits. The peak kinetic energy gain is smaller than the equivalent value recorded in Sec.3.2; this can clearly be seen in the colour scale of Fig.5which is scaled by 0.54 MeV, rather
than 1.55 MeV as shown in Fig.3. This change arises from both a reduction in the peak/mean electric field, but, more importantly, a reduction in non-dimensional separator length, from 2.87 to 1.18 units. In Sec.3.1, we discuss how changes in the dimen-sional scaling,lscl, affect the peak energy that a particle orbit may achieve. In this instance, a reduction in the non-dimensional (as opposed to the dimensional) separator length of 58%(≈1/√3) has the same effect, resulting in the peak kinetic energies gained by the particles reducing to a third of that seen in Sec.3.1(if we holdlscl=1 Mm fixed). Again, this (L2) decrease results from a reduction in size of parallel electric field strengthsandthe length over which the potential difference is applied.
At the reference values of normalising field strength (bscl= 10 G), lengthscale (lscl=1 Mm), and timescale (tscl=20 s), the peak kinetic energy gained using any snapshot for either particle species was achieved by a proton, which gained 0.542 MeV at t=0tf, when the reconnection rate was close to the peak value. The peak energy gained by an electron in the same snapshot was 0.491 MeV. Both species often produce similar maximum en-ergy gains, but asymmetries in the current sheet extent and the use of a discrete grid of initial positions mean that no consistent pattern emerges regarding the absolute maximum peak energy, and whether this is always achieved by an electron or proton. By taking the average over the most highly energised electrons and protons at any given snapshot (shown in Fig.4), it becomes clear that, on average, electrons are able to gain more energy than protons, apart from times when the reconnection rate is near the peak value, or near zero, where the species energies are typi-cally well matched. Instances of weak acceleration preferentially
accelerate electrons, due to the electron/proton mass difference; electrons are lighter, and more readily accelerated than protons, unless the force accelerating them is extremely strong or near-negligible.
5. Discussion
In this work, we have studied the behaviour of particles in the vicinity of separators which undergo magnetic reconnection, us-ing two different time-dependent models of the separator recon-nection event itself. Both the analytical model results (described in Sec.3.1) and the numerical MHD simulation snapshots (in-cluding examples of low/high beta plasmas and longer/shorter separator examples described in Sec.3.2-4) result in a signifi-cant fraction of electrons or protons being rapidly accelerated to high (non-thermal) energies.
Both models tackle the problem in different ways, and yet there is a high degree of similarity between the particle orbit re-sults. The analytical model ofWilmot-Smith & Hornig(2011) only describes the evolution of electric and magnetic fields in a manner which satisfies Faraday’s Law, and was designed to study the creation and evolution of topology in multiple sep-arators. In doing so, it is able to describe length-scales in the problem in a way that the numerical MHD model cannot (with-out dramatic increases in resolution). Indeed, the aspect ratio of the reconnection region width to separator length is approx-imately 10−6 : 1, compared to the numerical models, whose ratio of reconnection region breadth and thickness to separator length is approximately 4×10⁻³ : 3×10⁻² : 1 in MHS1 and 5×10⁻² : 2×10⁻¹: 1 in MHS2 when reconnection is initiated. However, the numerical models describe additional behaviour, in the sense that the full set of MHD equations (describing all aspects of plasma behaviour, not simply electric and magnetic fields) are solved. Despite these apparent differences, the result-ing particle orbits show that any encounter with the reconnection region typically leads to strong direct acceleration. The amount of acceleration typically increases for trajectories which more closely approach the original separator.
current-sheet configuration). The acceleration of electrons and protons to different sites which depend on particle species may also con-tribute to the lack of alignment of X-ray andγ-ray features ob-served during a single solar flare event (e.g.Hurford et al. 2003). The particle orbits which result from the numerical mod-els (Sec.3.2-4) differ from those seen in the analytical model (Sec.3.1) in one crucial aspect; in the latter case beams of accel-erated particles are strongly aligned with the null spines, while in the former case, such orbits may also be accelerated further away from the spine along the corresponding fan plane. This is likely to be due to the difference in reconnection region sizes at/near the separator. In the numerical case, a broader reconnec-tion region (approximately shaped like a ribbon) is threaded by field-lines (and hence accelerated particle trajectories), which do not all closely approach the separator or either null, but which still remain well-aligned with the fan plane structure (within the ribbon-like reconnection region). This is because the reconnec-tion region is located about the two fan planes which lie very close together and intersect close to the centre of thex,ydomain (Stevenson & Parnell submitted). In the analytical model, the im-posed small cylindrical reconnection region is only threaded by field lines which closely follow the separator and, hence, closely approach both nulls and remain close to the spines of each null. Additionally (during reconnection), accelerated particle trajec-tories (which follow reconnected magnetic field lines) arrive at the simulation boundaries progressively further from the spine along the relevant fan plane. This movement of potential impact sites is caused by additional field lines being brought into the reconnection region over time; such field lines are connected to different locations along the same fan plane.
These findings are in broad agreement with many features of particle acceleration sites seen by observations (see e.g.Fletcher et al. 2011). Flare ribbons, typically observed in Hα(and also in UV/EUV), are seen to evolve over the course of an event, and are known to reflect the magnetic topology of a particu-lar event (specifically in the projection of separatrix locations, see e.g.Mandrini et al. 1991;Demoulin et al. 1997). Our find-ings also suggest that the extent/size of accelerated particle im-pact sites seen by HXR/γ-ray data during solar flares is likely to be a proxy for the size of the reconnection region (if parti-cles which leave the acceleration region are not subjected to fur-ther processes which might change their trajectory or energy). At present, the relative size of these sites, compared to the large-scale structures they are often associated with (see e.g.Fletcher et al. 2011), suggests that the reconnection region at the heart of a solar-flare event is typically relatively small.
By analysing several snapshots of an ongoing separator re-connection experiment, we have studied the particle response to the time-dependent process of magnetic reconnection. The re-sults shown in Sect.4show that the particle orbit energies, and the locations to which orbits may be accelerated, are intrinsically tied to the reconnection rate. At instances when the reconnection rate is rapid, such as during the impulsive phase of a flare
(cor-responding to the dissipation of the built-up current over a large volume), particle orbits are accelerated by a large field aligned potential, leading to a significant particle orbit response. As the volume reduces over time, this causes a reduction in the field aligned potential experienced by the particle. If the diffusion re-gion is almost entirely dissipated (as it is during phase 2, as de-scribed in Sect.4) then little to no acceleration is possible.
In phase 2 of the MHD experiments, reconnection occurs in small, short, local bursts along the separator. Although these bursts occur sufficiently frequently to produce an almost steady (albeit very slow) average reconnection rate, the reconnection site during these bursts is too small and too short lived to have much of an effect on the particle orbits. This result implies that knowledge of reconnection rates of observed magnetic recon-nection events in both the solar atmosphere and the magneto-sphere is fundamental to the determination of the potential of such events to accelerate particles. It also may be an explanation as to why hard X-ray emission from flares is typically seen near the start of a flare and is shorter lived compared to the duration of the soft-X-ray emission lifetime (Benz 2002). It is important to note, however, that the above discussion is based on the prop-erties of individual particle orbits, and not on the calculation of particle fluxes. Hence, while we can discuss purely morpholog-ical features, we are not currently in a position to explain emis-sion spectra and other features.
In our model, particle acceleration is caused by the strength and extent of the local parallel electric field resulting from the (ongoing) reconnection. In displaying our results, we have demonstrated a method through which orbit energy gains may be scaled. This allows for an initial direct comparison between all the separator reconnection models used in this work, and, in addition, the application of these results to separators which have been observed and/or inferred through observational data and numerical simulations of the solar atmosphere or the mag-netosphere.
separa-tors are between 17−29 Mm long, and (due to an associated inte-grated parallel electric field along their length) undergo magnetic reconnection. While it is difficult to ascertain the proportion of observed separators which are undergoing reconnection (and in-deed over how much of the separator length the reconnection would take place), these findings support the presence of separa-tor reconnection, taking place on various scales throughout the solar corona.
Scaling our results suggests that, for example, the sepa-rators identified in numerical models of Parnell et al. (2010b) (which are 2-3/20-30 times longer than that modelled analyti-cally/numerically here) could yield particle energy gains of upto 0.4−0.9 MeV/0.6−1.35 GeV respectively. The separator lengths described byParnell et al.(2010b) are also relatively short com-pared to examples extrapolated from observations, potentially increasing these upper bounds still further. However, our calcu-lations also assume a field strength of 10 G and a reconnection region which extends over one fifth/the entire separator length. We anticipate reconnection region lengths to be much shorter in reality, particularly for long separators which reach into the high corona, since reconnection requires not just a suitable mag-netic field configuration in which to occur, but also appropriate plasma conditions and flows. Such conditions are highly unlikely to be achieved all the way along a global separator extending over hundreds of megameters, which would act to reduce the en-ergy particle orbits might gain from them. However, even this simple calculation shows that reconnecting magnetic separators, both observed in nature and recovered in numerical simulations could readily accelerate particles to high energies.
6. Conclusions and future work
We have studied the relativistic guiding centre behaviour of test particles in numerical snapshots describing the MHD evolu-tion of a reconnecting magnetic separator (following the work of Stevenson & Parnell submitted). We have compared the re-sults to test particle behaviour in an analytical model (studied inThrelfall et al. 2015), and found that particle orbits may be accelerated to high energies for electrons and protons in both cases. Both models also agree that each particle species is most strongly accelerated from opposite ends of the same separa-tor, and result in trajectories which terminate along opposite fan planes (where the choice of end and fan plane is species-dependent).
Most of the differences in our results can be attributed to the different sizes of the reconnection regions in our MHD models. The main differences between the models are found in the sizes of the reconnection region; the analytical model is capable of de-scribing far smaller reconnection regions, which leads to orbits whose final trajectories are closely aligned with null-spines. De-spite being unable to produce similar reconnection region sizes (at present), the numerical MHD model findings suggest that larger reconnection regions would lead to broader impact sites
for highly energised particles in the solar atmosphere (i.e. sites of HXR/γ-ray production during a flare) if particles are not sub-jected to any further changes in trajectory or energy upon leaving the region studied here. Under such conditions, one might think of the size of impact sites as a proxy for the size/extent of the re-connection region. However, there is general agreement between the orbits found using both approaches; this implies separator re-connection regions may indeed be locations where particles may be (strongly) accelerated.
In agreement with observations, our time-dependent study clearly shows the impact sites of the accelerated particles moves along the fan plane away from the null spines, as field lines that lie further from the separator are brought in and reconnected. Furthermore, the acceleration impact site changes in size and particle characteristics in response to changes in the reconnec-tion rate.
Several extensions to this work are readily apparent. With separator reconnection environments now established as poten-tial particle accelerators, this type of investigation merits repeat-ing for a ‘more realistic’ environment incorporatrepeat-ing reconnect-ing magnetic separators. Specifically, a separator embedded in a coronal magnetic environment, which undergoes reconnection in a manner more closely associated with a solar flare would al-low for particle impact site structure to be examined in greater detail and directly compared with HXR/γ-ray observations. Mul-tiple separators (i.e. separators that link the same pair of nulls, as discussed, for example, inParnell et al. 2010b) have begun to be detected/identified in MHD separator reconnection exper-iments, particularly at times when the reconnection rate is close to its peak value. Whether such separators (which may either thread the same, or disparate diffusion regions) impact the par-ticle acceleration behaviour identified here remains unknown, but is worthy of future consideration. Further development of the test-particle model, including the incorporation of collisional effects and non-uniform, (physically relevant) initial conditions would provide a significant further contribution to our under-standing in this area.
Acknowledgements. The authors gratefully acknowledge the support of the U.K.
Science and Technology Facilities Council [Consolidated Grant ST/K000950/1 and a Doctoral Training Grant ST/I505999/1 (JEHS)]. The research leading to these results has received funding from the European Commission’s Seventh Framework Programme FP7 under the grant agreement SHOCK (project number 284515). The MHD computations were carried out on the UKMHD consortium cluster housed at St Andrews and funded by STFC and SRIF.
References
Arber, T. D., Longbottom, A. W., Gerrard, C. L., & Milne, A. M. 2001, Journal of Computational Physics, 171, 151
Benz, A., ed. 2002, Astrophysics and Space Science Library, Vol. 279, Plasma Astrophysics, second edition
Birn, J. & Priest, E. 2007, Reconnection of Magnetic Fields (New York: Cam-bridge University Press)
Cargill, P. J., Vlahos, L., Baumann, G., Drake, J. F., & Nordlund, Å. 2012, Space Sci. Rev., 173, 223
Demoulin, P., Bagala, L. G., Mandrini, C. H., Henoux, J. C., & Rovira, M. G. 1997, A&A, 325, 305
Deng, X. H., Zhou, M., Li, S. Y., et al. 2009, Journal of Geophysical Research (Space Physics), 114, 7216
Dorelli, J. C. & Bhattacharjee, A. 2008, Physics of Plasmas, 15, 056504 Fletcher, L., Dennis, B. R., Hudson, H. S., et al. 2011, Space Sci. Rev., 159, 19 Gordovskyy, M. & Browning, P. K. 2011, ApJ, 729, 101
Gordovskyy, M., Browning, P. K., Kontar, E. P., & Bian, N. H. 2014, A&A, 561, A72
Guo, R., Pu, Z., Xiao, C., et al. 2013, Journal of Geophysical Research (Space Physics), 118, 6116
Haynes, A. L., Parnell, C. E., Galsgaard, K., & Priest, E. R. 2007, Royal Society of London Proceedings Series A, 463, 1097
Hesse, M. & Schindler, K. 1988, J. Geophys. Res., 93, 5559
Hurford, G. J., Schwartz, R. A., Krucker, S., et al. 2003, ApJ, 595, L77 Komar, C. M., Cassak, P. A., Dorelli, J. C., Glocer, A., & Kuznetsova, M. M.
2013, Journal of Geophysical Research (Space Physics), 118, 4998 Lau, Y.-T. & Finn, J. M. 1990, ApJ, 350, 672
Longcope, D. W., McKenzie, D. E., Cirtain, J., & Scott, J. 2005, ApJ, 630, 596 Mandrini, C. H., Demoulin, P., Henoux, J. C., & Machado, M. E. 1991, A&A,
250, 541
Metcalf, T. R., Alexander, D., Hudson, H. S., & Longcope, D. W. 2003, ApJ, 595, 483
Parnell, C. E., Haynes, A. L., & Galsgaard, K. 2010a, Journal of Geophysical Research (Space Physics), 115, 2102
Parnell, C. E., Maclean, R. C., & Haynes, A. L. 2010b, ApJ, 725, L214 Platten, S. J., Parnell, C. E., Haynes, A. L., Priest, E. R., & Mackay, D. H. 2014,
A&A, 565, A44
Priest, E. R. & Forbes, T. 2000, Magnetic Reconnection: MHD Theory and Ap-plications (Cambridge University Press)
Schindler, K., Hesse, M., & Birn, J. 1988, J. Geophys. Res., 93, 5547 Schindler, K., Hesse, M., & Birn, J. 1991, ApJ, 380, 293
Stevenson, J. E. H. & Parnell, C. E. submitted, Journal of Geophysical Research [arXiv:1509.07729]
Stevenson, J. E. H., Parnell, C. E., Priest, E. R., & Haynes, A. L. 2015, A&A, 573, A44
Threlfall, J., Bourdin, P. A., Neukirch, T., & Parnell, C. E. sub., A&A
Threlfall, J., Neukirch, T., Parnell, C. E., & Eradat Oskoui, S. 2015, A&A, 574, A7
Wilmot-Smith, A. L. & Hornig, G. 2011, ApJ, 740, 89