ISSN Online: 2327-5901 ISSN Print: 2327-588X
DOI: 10.4236/jpee.2019.79007 Sep. 27, 2019 94 Journal of Power and Energy Engineering
Multi-Objective Optimization of the Safe
Operation of the Electrical Distribution System
by Placing D-FACTS and Network
Reconfiguration
Arouna Oloulade, Adolphe Moukengue Imano, Xavier Fifatin, Antoine Vianou,
Herman Tamadaho, Ramanou Badarou
Laboratoire d’Electrotechnique, de Télécommunications et d’Informatique Appliquée (LETIA), University of Abomey-Calavi, Abomey-Calavi, Benin
Abstract
The distribution networks of agglomerated areas of the developing countries are generally the seat of overloads, voltage drops, and untimely interruptions of the power supply. This paper consisted of optimizing the grid topology and placement of a DSTATCOM in a SBEE real distribution network in order to improve its technical performance. The modified ant colony algorithms solved this difficult combinatorial problem, which integrated among the criteria, the minimization of the losses and the deviation of the node voltages under op-erational constraints about distribution networks operation. According to the results obtained, the optimization of the topology of a distribution net-work and the placement of DSTATCOM contributed qualitatively to im-prove the losses, voltage and stability plans of the Togba distribution net-work. Actually, the hybridization of optimization means such as the place-ment of DSTATCOM and the reconfiguration of the networks applied to the Togba HVA network made the power of DSTATCOM optimization possible by almost 50.71% and reduce losses to 83.57%. The implementations of those algorithms are very efficient and effective, and can be implemented to help distribution system operators, developing countries and in particular, the op-erators of the Beninese Electric Power Company to perform their electrical network.
Keywords
Reconfiguration, Ant Colony, Electrical Stability, Radial Distribution Network How to cite this paper: Oloulade, A.,
Imano, A.M., Fifatin, X., Vianou, A., Ta-madaho, H. and Badarou, R. (2019) Mul-ti-Objective Optimization of the Safe Op-eration of the Electrical Distribution System by Placing D-FACTS and Network Reconfi-guration. Journal of Power and Energy En-gineering, 7, 94-113.
https://doi.org/10.4236/jpee.2019.79007
Received: May 27, 2019 Accepted: September 24, 2019 Published: September 27, 2019
Copyright © 2019 by author(s) and Scientific Research Publishing Inc. This work is licensed under the Creative Commons Attribution International License (CC BY 4.0).
DOI: 10.4236/jpee.2019.79007 95 Journal of Power and Energy Engineering
1. Introduction
In the context of the liberalization of the energy sector, with the strong competi-tion that follows it, the regulators have become very demanding in front of elec-tricity companies. These requirements are driven not only by the urgent need to preserve fossil energy resources for future generations, but are also concerned about the quality of the product served to the consumer. Indeed, the electrical industry is subject to the laws and principles that govern both the physical cha-racteristics of the product and the realization of the expectations of public ser-vices and consumers. The regulation is aimed at the general well-being that is the benefit of consumers and operators [1].
To achieve this, companies use several techniques to improve energy systems, including topology optimization, FACTS devices insertion, decentralized gener-ation, placement of capacitors and inductors to control the transit of reactive and active power in the electrical networks. The hybridization of these means or the coupling of two different types of FACTS not only improves the technical performances but also contributes to reduce the computer drifts, the early con-vergences and the suboptimality of the solutions found [2].
Although the FACTS devices arising from the development of power elec-tronics components, they constitute, nowadays, the effective means, to improve the technical performance of the transmission and distribution networks, their dimensioning and their location in the networks have led to other difficult opti-mization issues that network operators will have to face. In addition, in order to exploit the distribution networks, with greater profitability, the network opera-tors use equipment such as SCADA and DMS that allow their automation and the control of all operating parameters. They consist among other functions in the automatic selection of the switches to be opened in order to minimize the ac-tive and reacac-tive losses as much as possible and to supply healthy customers with a departure in case of occurrence of a disturbance. This complex function is part of the family of difficult optimization problems and whose metaheuristics pro-vide global solutions, and can guide decision-makers to make optimal choices.
Moreover, the imbalance between reactive energy production and its con-sumption disrupts the maintenance of losses and voltage profiles within accept-able tolerances. In this context, the supply of good quality energy customers is one of the major problems of energy companies in order to meet the require-ments of the system regulator and reliability and performance of their system. The solutions to this concern are often sought after by the authors who use me-taheuristic methods to combine many actions to optimize the operational safety of electrical infrastructures.
DOI: 10.4236/jpee.2019.79007 96 Journal of Power and Energy Engineering associated with fuzzy logic to search the optimal position of a DSTATCOM, a photovoltaic cells in a distribution network and then reconfigure its topology. Venkateswarlu & al [6] investigated the impact of a SVC and a DG on a dis-tribution network and found that the optimal placement of a SVC and a DG significantly improves the ability of a transfer of an electrical network. JUNJIRO SUGIMOTO proposed in [7] the taboo search method to search the optimal po-sition of a SVC and SVR in an electrical installation already constituted by a DG. M. A. Tayyab & al. [8] show the effects of DG and SVC in a distribution network depending on their position. In this one, Yuvaraj & al [9] proposed a metaheu-ristic based on the light search algorithm to optimize the placement of DSTAT- COM, and a DG in an electrical network, taking into account the variations of the load. Jai Govind Singh & al [10] proposed another analytical method for op-timal placement of a DSTATCOM and SVC to ensure the safety of the system in the event of sudden modifications in its characteristics. In 2013, Oloulade et al. [11] proposed a method for a DSTATCOM placement in a distribution network in order to improve the quality of customer supply. R. Sinirvassa [12] used bee colony to reconfigure the 33-bus network and found that this proposed method is efficient and effective. K. SURESHKUMAR et al. used the differential evolu-tion technique to reconfigurate a distribuevolu-tion network.
This paper is devoted to optimizing the placement of a D-FACTS in a distri-bution network and reconfiguring its topology using a metaheuristic based on ant colony. The following part of the paper is constituted in point 2 by the driv-ing difficulties faced by the operators, in 3 by the method used for the calcula-tion of the power flow and the network stability, in 4 by the DSTATCOM mod-eling. Points 5, 6 and 7 present the ant colony algorithms, the simulation results and discussions then the conclusion.
2. Operation Issues on Distribution Network of SBEE
cor-DOI: 10.4236/jpee.2019.79007 97 Journal of Power and Energy Engineering relation with the growth of the charges and their scale. There are, in fact, small sectorial projects aimed at the local reinforcement of certain installations which are often not very efficient and are not hierarchical. In fact, network planning will have to begin with an estimate of the demand to be served in the future, taking into account industrial and residential urban development plans, existing demand, and the impact of economic plans on growth. These shortcomings noted in the food system are the main causes of the surge in losses that it can’t always master, and its difficulties in delivering good quality energy in some neighborhoods of large cities.
3. Power Flow and Stability Analysis
3.1. Load Flow Analysis
Distribution networks are characterized by high R/X ratios and the traditional methods of power flow calculating widely known such as Newton Raphson, Gauss Seidel and Fast decoupled methods are not suitable for effectively solving the problems power flow problems in radial distribution networks.
The backward/forward sweep is one of load flow computation method which is developed and converges very well for radial distribution networks. It is based on the laws of ohm and Kirchhoff and can be considered from the family of iter-ative methods of power flow. This method is implemented on the Matlab plat-form and integrated into the optimal network reconfiguration algorithm [14].
3.2. Stability Margin of a Distribution Network
Voltage static stability in a distribution network has become an important concern for utilities today because of its impact on the quality and reliability of electricity supply. The companies then express the need to evaluate the stability of their system in order to predict the contingencies and to elaborate the means of safeguarding them. In the literature, there are several stability margin assessment methods, whose performances are variously appreciated by the authors. In this paper, we will use the continuous power flow method which consists of a reformulation of the power equations by integrating the load parameters to evaluate the stability margin of a HVA distribution network of the SBEE which is our case study.
( )
( )
0i Gi Li Ti
P P
λ
Pλ
P∆ = − − =
(1)
( )
0i Gi Li Ti
Q Q Q
λ
Q∆ = − − = (2)
with:
(
)
1 cos
n
Ti i j ij i j ij j
P VV Y θ θ γ
=
=
∑
− −(
)
1
sin n
Ti i j ij i j ij j
Q VV Y θ θ γ
=
=
∑
− −and:
( )
0
i Gi Li Ti
Q Q
Q
λ
Q
DOI: 10.4236/jpee.2019.79007 98 Journal of Power and Energy Engineering 0
λ= , correspond au cas de base.
critique
λ λ
=
au cas critique.The indices L, G and T respectively correspond to the load node, generation node (balance node) and injection node (PV node).
The ith node voltage is
i i
V∟δ and
Y
ij∟
γ
ij is the( )
i j, th element of the[ ]
Y
bus system.To simulate the different load variation cases, the power flow equations are modified as follows:
( )
cos( )
Li Lio Li Base i
P
λ
=P + λ
K S∆θ
(4)( )
sin( )
Li Lio Li Base i
Q
λ
=Q + λ
K S∆θ
(5)where,
( )
cos
Base i Lio
S∆
θ
=P( )
sin
Base i Lio
S∆
θ
=Q( )
tan
Lio i Lio
P
θ =
Q
Then, the equations above modified can be written:
( )
[
1]
Li Lio Li
P
λ
=P +λ
K(6)
( )
tan( )[
1]
Li Lio i Li
Q
λ
=Pθ
+λ
K (7)( )
[
1]
Gi Gio Gi
P
λ
=P +λ
K(8)
Lio
P : Basic active power at ith node.
Lio
Q : Basic reactive power at ith node.
Li
K : Multiplier designating the proportion of variation of the load at node i.
Gi
P : Active power generated at node i in initial state of system. Gi
K : Constant specifying the proportion of generation variation when λ
change.
ΔBase
S : Apparent power chosen to provide an appropriate scale.
If “F” is used as the set of equations, then, the system described above represents a set of nonlinear equations expressed by F x
( )
,λ
=0 with x=[
δ
,V]
T and it is applied the process of prediction and correction to solve these equations.The calculation algorithm of the Continuous Power Flow (Algorithm 1) is essentially based on the prediction-correction method and is as follows:
Inputs: Node data (P, Q, type), Line data (R, X), Number of iterartion N. Outputs: V, δ, λ.
4. Modeling of DSTATCOM
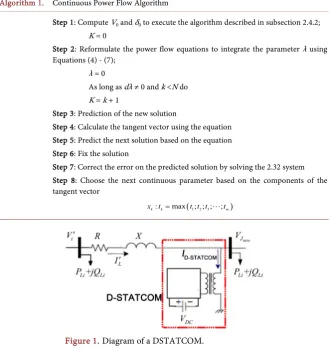
The DSTATCOM is a device illustrated in Figure 1 and consists mainly of a voltage source continuously supplied and connected to the network through a transformer. The operating principle is to maintain a capacitor charged to the
dc
DOI: 10.4236/jpee.2019.79007 99 Journal of Power and Energy Engineering
Algorithm 1. Continuous Power Flow Algorithm
Step 1: Compute V0 and δ0 to execute the algorithm described in subsection 2.4.2;
K = 0
Step 2: Reformulate the power flow equations to integrate the parameter λ using Equations (4) - (7);
λ = 0
As long as dλ ≠ 0 and k <N do K = k + 1
Step 3: Prediction of the new solution
Step 4: Calculate the tangent vector using the equation Step 5: Predict the next solution based on the equation Step 6: Fix the solution
Step 7: Correct the error on the predicted solution by solving the 2.32 system Step 8: Choose the next continuous parameter based on the components of the tangent vector
(1 2 3 )
: max ; ; ; ;
k k m
[image:6.595.209.541.77.434.2]x t = t t t t
Figure 1. Diagram of a DSTATCOM.
the XT inductive reactance of the transformer creates the circulation of a reactive current.
The magnitude of this difference between the two voltages determines the amplitude of the reactive current. DSTATCOM is seen by the network as a reac-tive element of variable reacreac-tive current. This reacreac-tive current only depends on the amplitude of the Vo voltage when the capacitor is charged. DSTATCOM can be used to perform compensation, control voltage, filter harmonics. In the power flow algorithm, the DSTATCOM is modeled as a current source that in-jects an alternative current into a distribution network.
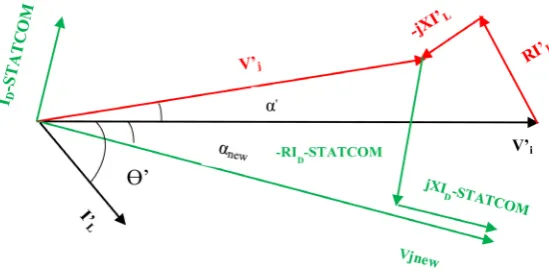
Figure 2 shows the vector diagram of the two-node system.
For example, the head margin in this template measures proportionately more than is customary. This measurement and others are deliberate, using specifica-tions that anticipate your paper as one part of the
(
D-STATCOM)
arg
2
new
I =α +π (9)
(
)
(
)
2D-STATCOM
e new e e e new
new
j
j j
L j
J i
V α V θ R jX I θ R jX I α
π
+
′ ′
= − + − + (10)
With 2
D-STATCOMe
new
j
I α
π +
and e new new
j J
DOI: 10.4236/jpee.2019.79007 100 Journal of Power and Energy Engineering
Figure 2. Vector diagram of the two-node system.
current by the DSTATCOM and the jth node voltage after compensation. By separating real parts and imaginary parts of Equation (10), we obtain the Equations (11) and (12):
(
)
{
(
)
}
D-STATCOMD-STATCOM
cos Re e cos
2
sin 2 new
j
J new i L
V V R jX I RI
XI
θ
α = ′− + ′ − +π π + +
(11)
(
)
{
(
)
}
D-STATCOMD-STATCOM
sin Im e sin
2 cos
2 new
j
J new i L
V V R JX I RI
XI
θ
α = ′− + ′ − +π π − + (12) Data: new j
d V
=
(
)
{
}
Re i L
a= V′∠ −
δ
R jX I+ ′∠θ
(
)
{
}
Im i L
b= V′∠ −
δ
R jX I+ ′∠θ
1 c = −R
2 c = −X
The unknowns:
1 DSTATCOM x =I
2 new x =α
Then, the Equations (11) and (12) become respectively the Equations (13) and (14):
We can draw x1 respectively in Equations (13) and (14):
2 1
1 2 2 2
cos sin cos
d x a
x
c x c x
− =
− − (15)
2 1
1 2 2 2
sin cos sin
d x b
x
c x c x
− =
DOI: 10.4236/jpee.2019.79007 101 Journal of Power and Energy Engineering Equalizing these two Equations (15) and (16) and then making a change of variable x=sinx2, we can observe, after an arrangement, the following:
(
) (
)
{
2 2}
2(
)
{
2 2(
)
2}
2 1 1 2 2 1 2 1 1 1 2 0
ac bc− + ac bc+ x + dc ac bc x− + d c − ac bc+ = (17)
After that, we obtain:
2 4
B AC
∆ = − avec
(
) (
2)
22 1 1 2
A= ac bc− + ac bc+
(
)
1 2 1
2
B
=
dc ac bc
−
(
)
2 2 21 1 2
C d c= − ac bc+
We also obtain:
2
B x
A
− ± ∆
=
(18)
where x=sinx2.
x represents he initial conditions before the placement of DSTATCOM, the chosen Equation (19) is:
2
B x
A
− + ∆
=
(19)
Next,
( )
2 arcsinx = x (20)
And we remind that x2 =αnew; αnew =x2; IDSTATCOM =x1. Then, x1=IDSTATCOM is defined from Equations (15) or (16). Then, we define:
new new
j j new
V =V ∠
α
(21)
DSTATCOM DSTATCOM new 2
I =I ∠α +π
(22)
Finally, the reactive power injected by the D-STATCOM can be written as follows:
* DSTATCOM jnew DSTATCOM
jQ =V ×I
(23)
where * DSTATCOM
I
is the conjugate complex of the current of D-STATCOM. The D-STATCOM is modeled so that the amplitude of the voltage of the node where it is installed is equal to 1 pu. The phase of this same node is computed from Equation (20), the current injected by D-STATCOM is calculated by Equa-tion (22) and the reactive power injected is determined by EquaEqua-tion (23).5. Distribution Network Reconfiguration
de-DOI: 10.4236/jpee.2019.79007 102 Journal of Power and Energy Engineering termine the branch to open, we compute the value of the objective function. The branch with the lowest loss value and the best network operating conditions will be open. This branch opening process is performed until an optimal exploitation scheme is obtained.
The algorithm developed for the search for optimal topology of a HVA net-work is based on the principle described as follows:
Algorithm 2. Sub-algorithm: Finding a network reconfiguration
For all nodes, look for the unique path to the source node
1) Browse in the opposite direction of the network (from the last node to the previous one)
If there is possibility, Continue from step 1 else
2) Browse in the direction of tie-switches become closed switches Check if the system is stable (There is no redundancy of nodes) If yes
Continue from step 1 else
3) Browse in the forward direction (from the current node to the next) If there is possibility
Continue from step 1 else
Save and delete the current node of the chain Continue from step 2
Browse in the forward direction (from the current node to the next) If there is possibility
Continue from step 1 else
Save and delete the current node of the chain Continue from step 2
End if End if End if
If there is a single path to the source node for all nodes The new configuration is radial
Save the paths
Constitute each branch according to the paths of the reconfigured network Repositioning the loads according to the end-of-branch nodes fed by each branch Back up the new reconfigured network
6. Mathematical Formulation of the DSTATCOM Placement
and the Topology Optimization Problems of a Distribution
Network
DOI: 10.4236/jpee.2019.79007 103 Journal of Power and Energy Engineering
6.1. Objectives Functions
• Losses minimizations( )
2 21 2 1 b n loss i i i i i
P Q
f x
P
R
V
=
+
=
=
∑
(24)With: i
R : resistance of branch;
i
P: Active power of branch; i
Q: Reactive power of branch;
i
V : Final node voltage of branch; b
n : branch number.
• Voltage deviation minimizations
The deviation of the voltage is given by:
( )
22 max min
1
spec N
i i
i i i
V V f x DT
V V
=
−
= = −
∑
(25)
i
V : ith node voltage and c ispe
V its specific voltage; max
i
V : maximum voltage which is +0.5% of nominal voltage; min
i
V : minimum voltage which is −0.5% of nominal voltage;
N: number of overall nodes.
By aggregating the functions f1 and f2, we obtain the global objective function.
( )
( )
( )
(
)
(
)
1 1 2
2
, and 1
F x f x f x
R
α β
α
β
β
α
+ ∈ + = =(26)
6.2. Constraints
min maxi i i
V
≤ ≤
V V
(27)
2 2 2
max l l l
P Q+ ≤S
(28)
2 max 1 i i I g I
= < (29)
7. Ant Colony Algorithm
Ants are social insects whose physical or behavioral characteristics have long fascinated researchers. Ant colony algorithms typically use the behavior of real ants to solve combinatorial optimization problems. It can be reduced in search of the shortest path through graphs based on the behavior of the ants that in their displacement mark the way with glands contained in their abdomen called pheromones. The amount of pheromone depends on the length of the path and the amount of food found. The pheromone evaporates over time if others are deposited there. The path of pheromones leading to food sources will be more frequented by ants.
DOI: 10.4236/jpee.2019.79007 104 Journal of Power and Energy Engineering for solutions around a graph such as G = {N, C} where “N” is the set of nodes and C is the set of paths given by losses in the branches. Ants move according to a probabilistic decision rule are based on pheromone trails, ant condition and problem constants. The algorithm developed on the basis of the principles men-tioned above is described as follows:
Algorithm 3. Main algorithm: Simultaneous optimization (Reconfiguration-Placement)
Step 1: Initialize the first iteration t = 1 Initialize pheromones: τij← ∀τ0 i j, =1, ,n Initialize position p
Step 2: For each ant k = 1 to m
Build a cycle T tk( ) of tie-switches
Update tie-switches
Step 3: Look for a single path from a given node to the source node with excluded open switches
Step 4: Rearrange loads from end-of-branch nodes—save new topology Step 5: For each ant k = 1 to m
Evaluate the radiality criterion of the new configuration If the configuration is radial
Exclude the current topology—Goto Step 6 else
Find p position in the current cycle
Evaluate size of the D-STATCOM at the position found and the power flow of network with the D-STATCOM placed at the position found
Step 6: Compute cost function L tk( ) of T tk( ) Update the best global solution
Step 7: For each arc ( )i j,
Update pheromones τij while confining them in [τmin,τmax]
1 t t= +
if t NC< max Goto Step 2 else Stop
Return the best global solution
8. Simulation Parameters
The choice of parameter values determines the quality of solutions to be ob-tained in a simulation process. In fact, incorrect parameter settings or inappro-priate choices can lead to suboptimal solutions. The table shows the values of the parameters chosen.
9. Results and Discussions
9.1. Validation of the Results
DOI: 10.4236/jpee.2019.79007 105 Journal of Power and Energy Engineering shows the diagram of this network. It is composed of 33 nodes, 32 lines. The base voltage is 12.6 kV. The initially open switches are 33, 34, 35, 36 and 37.
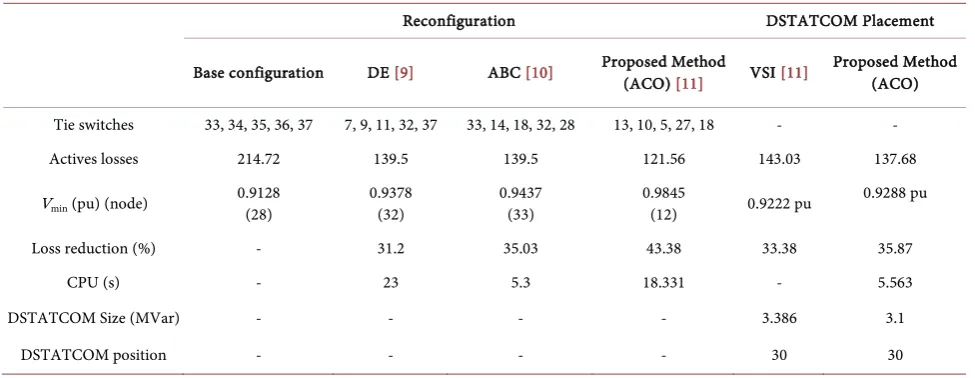
Table 1 presents the simulation results of reconfiguration and DSTATCOM placement in this network.
It is observed from Table 2 that the 33-bus network whose losses in the initial configuration are evaluated at 214.72 kW have been increased to 139.5 kW by using the differential evolution algorithm in [9] for the reconfiguration with switches 7, 9, 11, 32 and 37 opened versus 121, 56 kW by applying our method based on modified ant colonies. The switches that are open are 13, 10, 5, 27 and 18. The computer performance (computation time) is 18, 331 seconds against23 seconds that Nirmala found with his application.
[image:12.595.207.539.510.746.2]Figure 3. IEEE 33-bus network diagram.
Table 1. Simulation parameters.
Parameters Values
Colony size 1
Iterations number 2
A 100
B 0.0005
Q 0.7
pMin 0.05
pMax 0.7
ρ 0.3
1
λ 100,000 (high value)
2
λ 1
DOI: 10.4236/jpee.2019.79007 106 Journal of Power and Energy Engineering
Table 2. Validation of the results.
Reconfiguration DSTATCOM Placement
Base configuration DE [9] ABC [10] Proposed Method (ACO) [11] VSI [11] Proposed Method (ACO)
Tie switches 33, 34, 35, 36, 37 7, 9, 11, 32, 37 33, 14, 18, 32, 28 13, 10, 5, 27, 18 - -
Actives losses 214.72 139.5 139.5 121.56 143.03 137.68
Vmin (pu) (node) 0.9128 (28) 0.9378 (32) 0.9437 (33) 0.9845 (12) 0.9222 pu 0.9288 pu
Loss reduction (%) - 31.2 35.03 43.38 33.38 35.87
CPU (s) - 23 5.3 18.331 - 5.563
DSTATCOM Size (MVar) - - - - 3.386 3.1
DSTATCOM position - - - - 30 30
Sinirvassa applied the bee colony-based algorithm to reconfigure the 33 node network and found that the losses are also 139.5 kW and the switches to open are 33, 14, 18, 32, 28. The computation time is 5.3 s compared to 18.331 s for the application of ACO to the same network. Based on the performance of the re-sults, the algorithm developed can be applied to a real network of the SBEE in order to reconfigure the topology of an HVA departure.
9.2. Application of ACO on the 41-Bus Network of SBEE
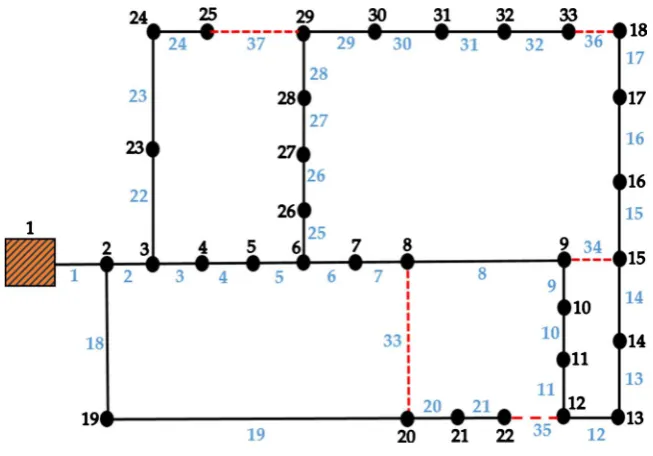
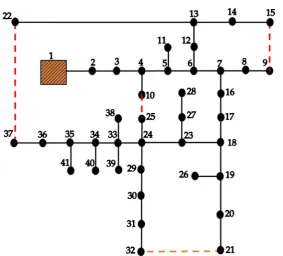
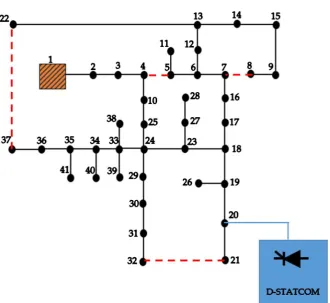
The diagram of Figure 4 shows a HVA electrical system from a source station of Maria-Gleta (Benin). It consists of 41 nodes and normally open switches in basic operation.
Table 3 shows the results obtained by the simulation of the DSTATCOM placement and reconfiguration of the real network of SBEE. It is observed that the losses of the Togba network which were 403.56 kW for the basic configura-tion decrease to 66.30 kW after optimizaconfigura-tion by the placement of DFACTS and reconfiguration of the topology. It is noticed an improvement of 83.57%.
The reconfiguration associated with the placement of DSTATCOM in a net-work has a positive impact on the technical performances of the distribution network. This action can make it possible to defer the investments required to reinforce the essential equipment of distribution networks such as transformers and lines whose reinforcement often requires a lot of financial resources. The optimal power of the DSTATCOM, in the case of simple placement, which is 2.1 MVar with a position at node 36 [11] is passed to node 20 with a power of 1.035 MVar. The power of DSTATCOM is then reduced by almost 50.71%. Optimiz-ing the topology of a distribution network associated with the placement of DSATCOM is then very economical and efficient and can further optimize the power of the compensator needed to improve the network.
DOI: 10.4236/jpee.2019.79007 107 Journal of Power and Energy Engineering
[image:14.595.208.539.366.591.2]Figure 4. Network topology before reconfiguration.
Table 3. Summary of the results.
Base
configuration DSTATCOM position Reconfiguration DSTACOM + Reconfiguration
Lower voltage pu (node) 0.8498 (37) 0.9510 (32) 0.9724 (23) 0.9886 (8)
DSTATCOM size (MVar) - 2.1 - 1.03
DSTATCOM position 36 - 20
Active losses (kW) 403.38 164.77 148.97 66.30
Losses reduction (%) 59 63.08 83.57
Tie switches
9 - 15; 21 - 32; 10 - 25; 22 - 37;
9 - 15; 21 - 32; 10 - 25; 22 - 37;
8 - 9; 23 - 24; 30 - 31; 35 - 36;
4 - 5; 7 - 8; 21 - 32; 37 - 22;
Stability margin (MW) 2.17 3.41 4.4 5.17
Margin improvement (%) - 36.36 50.68 58.02
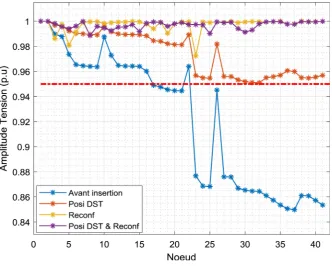
DOI: 10.4236/jpee.2019.79007 108 Journal of Power and Energy Engineering is significantly improved than the voltage plane in the case of only DSTATCOM placement. Indeed, for the DSTATCOM placement case, several voltage values are below 0.96 pu, whereas for the case of reconfiguration, most of the voltage values are beyond 0.98 pu. The reconfiguration had more effect on the voltage profile than the DSTATCOM placement. Several problems related to voltage drop that affect the quality of supply and do not allow several customers to eat properly can be solved by optimizing the network topology. Designers of distri-bution networks already have to design the reconfigurable networks by consi-dering the switches sized in accordance with the transit, and appropriate cable sections to facilitate the reconfigurations that must adapt to the load profile.
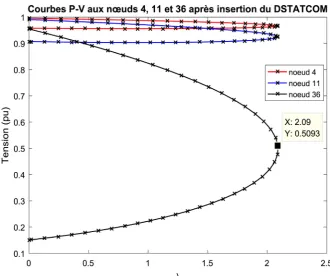
Figures 6-8 shows the PV voltage stability curves at nodes 4, 11 and 36 of the Togba electrical network. It can be seen that the stability margin for the base case is 2.1 MW, 3.17 MW with the placement case at node 36, 4.61 MW with re-configuration and 5.17 MW with simultaneous placement and rere-configuration. The stability margin of the basic configuration of 2.17 MW shows that this net-work in this state is almost disastrous and has several neuralgic points and probable instability of voltage. In this state, it can no longer allow the connection of new loads at the risk of collapse. On the other hand, the margin of stability is improved after the various optimization scenarios. The point separating the op-erating point of the network from the collapse point is significantly improved with reconfiguration than the placement case by nearly 31.23%. This margin of stability is further improved in the combination of the two network improve-ment actions. The increase of voltage stability after optimization may allow the addition of other loads to this network without the need to reinforce existing
DOI: 10.4236/jpee.2019.79007 109 Journal of Power and Energy Engineering
[image:16.595.208.540.376.625.2]Figure 6. PV curves after DSTATCOM placement at nodes 4, 11 et 36.
Figure 7. PV curves at nodes 4, 11 and 36 after reconfiguration.
network equipment (lines and transformers). This optimization can then reduce the operation and maintenance costs of networks while strengthening their op-erational safety.
DOI: 10.4236/jpee.2019.79007 110 Journal of Power and Energy Engineering
Figure 8. PV curves at nodes 4, 11 et 36 after DSTATCOM placement and reconfiguration.
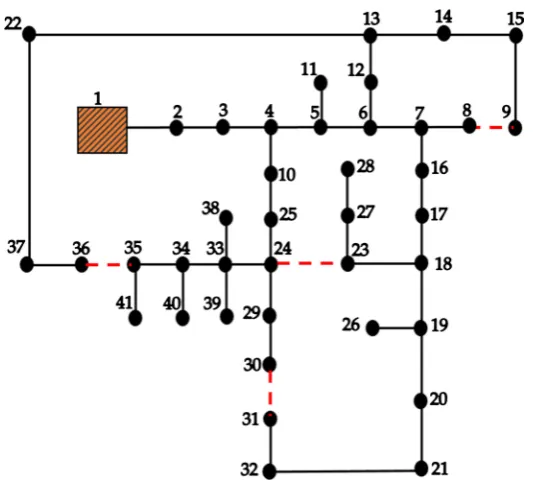
Figure 9. Network topology after reconfiguration.
[image:17.595.241.508.348.589.2]DOI: 10.4236/jpee.2019.79007 111 Journal of Power and Energy Engineering
Figure 10. Network topology after both placement of DSTATCOM and reconfiguration.
configuration associated with the placement simultaneously contributes not only to qualitatively improve the technical performance of the network but also to optimize the size of DSTATCOM. This action reduces the operating costs while improving the quality of the energy supply delivered. However, the reconfigura-tion will have to be a period cooperareconfigura-tion to adapt to the consumpreconfigura-tion profile and to contend with the damage of the cut-off devices.
10. Conclusion
DOI: 10.4236/jpee.2019.79007 112 Journal of Power and Energy Engineering safety of an electrical system. The quality of solutions obtained can reassure utilities to use this tool to optimize the operation of their electrical system. The DFACTS placement associated with the reconfiguration further distances the operating point of the network from the bifurcation point.
Conflicts of Interest
The authors declare no conflicts of interest regarding the publication of this paper.
References
[1] Pérez-Arriaga, I.J. (2013) Regulation of the Power Sector. Springer Verlag, London. [2] DD/SBEE (2017) Rapport statistique d’incident au titre de l’année 2017 réseau HTA
période, Janvier à décembre.
[3] Priyadarshini, R., Prakash, R. and Priyadarshini, R. (2016) Capacitor Placement and Network Reconfiguration Simultaneously for Loss Reduction in Radial Distribution System. Indian Journal of Science and Technology, 9.
https://doi.org/10.17485/ijst/2016/v9i45/104385
[4] Pinthurat, W., Pandel, A. and Ongsakul, W. (2018) Optimal Distributed Placement and Network Reconfiguration Using Hybrid Algorithm. Pathumwan Academic Journal, 8.
[5] Tolabi, H.B., Ali, M.H. and Rizwan, M. (2014) Simultaeous Reconfiguration Optim-al Placement of DSTATCOM and Photovoltaic Array in a Distribution System Based on Fuzzy-ACO Approach. IEEE Transactions on Sustainable Energy, 6, 210-218.
https://doi.org/10.1109/TSTE.2014.2364230
[6] Venkateswarlu, A.N., Tulasi Ra, S.S. and Sangameswara Raju, P. (2013) Impact of SVC and DG on Voltage Stability Constrained Available Transfer Capability. Inter-national Journal of Engineering Trends and Technology, 4, 3040-3044.
[7] Sugimoto, J., Yokoyama, R., Fujita, G. and Fukuyama, Y. (2006) Cooperative Allo-cation of SVR and SVC for Voltage Fluctuation in Case of Connecting Distributed Generators. Electrical Engineering in JAPAN, 164, 10-17.
https://doi.org/10.1002/eej.20639
[8] Tayyab, M.A. (2015) Distributed Generation Effects on Voltage Profile of Distribu-tion Grid with SVC and Smart Inverter. IEEE Power & Energy Society General Meeting, Denver, 26-30 July 2015.
[9] Yuvaraj, T., Devabalaji, K.R. and Ravi, K. (2015) Optimal Placement and Sizing of DSTATCOM Using Harmony Search Algorithm. Energy Procedia, 79, 759-765.
https://doi.org/10.1016/j.egypro.2015.11.563
[10] Singh, J.G., Thakurta, P.G. and Soder, L. (2014) Load Curtailment Minimization by Optimal Placements of SVC/STATCOM. International Transactions on Electrical Energy Systems, 25, 2769-2780. https://doi.org/10.1002/etep.1990
[11] Oloulade, A., Imano, A.M., Vianou, A. and Tamadaho, H. (2018) Optimisation multi-critre du placement dun D-STATCOM dans un réseau de Distribution par les Colonies de Fourmis. Symposium de Genie Electrique (SGE 2018), Nancy, July 2018, 8.
[12] Gupta, A.R. and Kumar, A. (2015) Energy Saving Using D-STATCOM Placement in Radial Distribution System under Reconfigured Network. 5th International Con-ference on Advances in Energy Research, Mumbai, 15-17 December 2015.
DOI: 10.4236/jpee.2019.79007 113 Journal of Power and Energy Engineering et à l’évaluation des pertes dans les réseaux de transport et de distribution de la communauté électrique du Benin et de la société béninoise d’énergie électrique (CEB-SBEE), Sciences. Technologies et Développement, Edition spéciale, 87-90. [14] Oloulade, A., Imano, A.M., Vianou, A. and Tamadaho, H. (2018) Optimization of