doi:10.4236/jsea.2010.37079 Published Online July 2010 (http://www.SciRP.org/journal/jsea)
Lightness Perception Model for Natural Images
Xianglin Meng, Zhengzhi Wang
College of Mechatronics Engineering and Automation, National University of Defense Technology, Changsha, China. Email: [email protected]
Received May 11th, 2010; revised May 28th, 2010; accepted June 12th, 2010.
ABSTRACT
A perceptual lightness anchoring model based on visual cognition is proposed. It can recover absolute lightness of nat-ural images using filling-in mechanism from single-scale boundaries. First, it adapts the response of retinal photore-ceptors to varying levels of illumination. Then luminance-correlated contrast information can be obtained through mul-tiplex encoding without additional luminance channel. Dynamic normalization is used to get smooth and continuous boundary contours. Different boundaries are used for ON and OFF channel diffusion layers. Theoretical analysis and simulation results indicate that the model could recover natural images under varying illumination, and solve the trap-ping, blurring and fogging problems to some extent.
Keywords: Perception, Lightness Anchoring, Filling in, Adaptation, Multiplex Contrast
1. Introduction
Studies show that human could perceive a wide dynamic range of lightness from dim moonlight to dazzling sun-light. Human visual system has stable perceptual capabil-ity for scenes under variable illuminations, which is re-ferred to as lightness constancy. First of all, two concepts must be clarified: luminance and lightness. Luminance values denote light intensities within the retinal image while lightness is related to our perceived world. Lumi-nance values in the retinal image are a product, not only of the actual physical shade of gray of the imaged sur-faces, but also, and even more so, of the intensity of the light illuminating those surfaces. The luminance of any region of the retinal image can vary by a factor of no more than thirty to one as a function of the physical re-flectance of that surface. However, it can vary as a factor of a billion to one as a function of the amount of illumi-nation on that surface. The net result is that any given luminance value can be perceived as literally any shade of gray, depending on its context within the image. De-spite the challenge, human perceive shades of surface grays with rough accuracy [1]. Lightness represents the cortical perceptual result of retinal stimuli and the proc-ess of lightnproc-ess perception can be understood as a map-ping from natural image input to visual percept output.
BCS/FCS (Boundary Contour System/Feature Contour
System) proposed by Grossberg et al. is representative of
visual lightness perception model. Its extended versions have explained a mass of psychological experimental data [2,3]. BCS/FCS model discounts the illuminant to
obtain contrast information through retinal preprocessing. Further processing is made by visual cortex to get boun-dary contour and surface. However, such illumination discounting information can just estimate relative meas-urements of reflectance of the surface. Visual cortex needs to compute the absolute lightness values that ex-ploit the full dynamic range to perceive effectively. That’s just the so-called anchoring problem.
Grossberg believed that boundaries and surfaces are visual perceptual units, and proposed aFILM model in 2006 [4]. The model augments a lightness anchoring
stage in the framework of BCS/FCS. Sepp et al.
pro-posed a multi-scale filling-in model to reconstruct the image surface lightness [5]. It extends the confidence- based filling-in model to multi-scale processing, thus speeding up the filling-in process. A key aspect of visual cognition research is to process natural images effec-tively while explaining psychological data, which facili-tates higher cognition process such as object recognition and provides inspirations to machine vision.
This paper presents a neural dynamic model to simu-late the mapping process from luminance to lightness according to recent neurophysiological and psychological experimental findings. The proposed model could re-cover natural images under varying levels of illumination, and solve the trapping, blurring and fogging problems to some extent.
2. Model Description
re-tinal adaptation occurs firstly. The light-adapted signal goes to multiplex coding and boundary detection. The contrast information from multiplex coding is used to recover the absolute surface lightness, and the boundary contour is to block activity diffusion between surfaces. Final perceptual lightness output is obtained through surface filling-in mechanism. The overall model
archi-tecture is depicted in Figure 1.
2.1 Retinal Adaptation
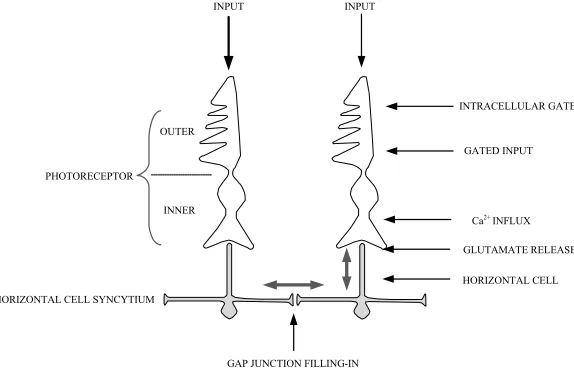
The model retina calculates the steady-state of retinal adaptation to a given input image [4]. It adapts the re-sponse of photoreceptors to varying levels of incoming light, since otherwise the visual process could be de-sensitized by saturation right at the photoreceptor. Light adaptation, at the photoreceptor outer segment, protects each photoreceptor from saturation by using intracellu-lar temporal adaptation that shifts the photoreceptor
sensitivity curve [6]. As illustrated in Figure 2, the
light-adapted signal is further processed at the photore-ceptor inner segment where it gets feedback from a horizontal cell (HC) that is connected with other HCs by gap junctions [7], forming a syncytium that is sensi-tive to spatial contrast. HC inhibition further adjusts the sensitivity curve to realize spatial contrast adaptation. It is assumed that the permeability of gap junctions be-tween HCs decreases as the difference of the inputs to HCs from coupled photoreceptors increases. The model retina hereby segregates and selectively suppresses sig-nals in regions that have strong contrasts, such as a light source. HCs connections are not constrained to nearest neighbors but reach farther regions. Inhibition of the HC on the photoreceptor controls the output of the
photoreceptor by modulating Ca2+ influx at the
photo-receptor inner segment. This feedback prevents the out-put from being saturated by localized high-contrast inout-put
Retinal adaptation Multiplex
coding
Boundary detection Surface filling-in Perceptual
output
[image:2.595.374.474.88.273.2]Input image
Figure 1. Model block diagram
signals.
The outer segment of retinal photoreceptor can be modeled by the equation:
( ) ( )
ij ij ij
s t I g t (1) where ( , )i j denotes spatial position, ( )s tij represents
the output of outer segment, Iij is the input image,
( )
ij
g t is an automatic gain control term simulating
negative feedback mediated by Ca2+ ions and follows:
( ) ( )
ij
g ij ij I ij I
dg
A g g B I B I
dt (2)
whereA Bg, I and BI are constants. I denotes
spatia-laverage of input image that approximates the effect of recent image scanning by sequences of eye movements.
The second term describes the inactivation of g tij( ) by
PHOTORECEPTOR
HORIZONTAL CELL SYNCYTIUM OUTER
INNER
GAP JUNCTION FILLING-IN
HORIZONTAL CELL GLUTAMATE RELEASE
Ca2+ INFLUX
INTRACELLULAR GATE
GATED INPUT
INPUT INPUT
[image:2.595.154.441.516.700.2]the present Iij and I . The inner segment of the photo-
receptor receives the signal sij from the outer segment
and also gets feedback Hij from the horizontal cell. HC
modulation of the output of the inner segment is modeled by the equation:
exp( ) ( ) 1
ij ij
H ij s ij
s S
C H C s
(3)
whereCs A Bg / I,CH is a constant. The relationship
between Hij and HC activity hij follows:
2
2 2
H ij ij
H ij
a h H
b h
(4)
where aH and bH are constants. The activity of an HC
connected to its neighbors through gap junctions is de- fined as diffusion equation:
( , )
( )
ij ij
ij pqij pq ij ij
p q N dh
h P h h S
dt
(5)where Ppqij is the permeability between cells at ( , )i j
and ( , )p q ,
1 1
1 exp[ (| | ) / ]
pqij
pq ij
P
S S
(6)
,
are constants. Nij is the neighborhood of size r
to which the HC at ( , )i j is connected:
2 2
{( , ) : ( ) ( ) , ( , ) ( , )}
ij
N p q i p j q r p q i j (7)
2.2 Multiplex Contrast Code
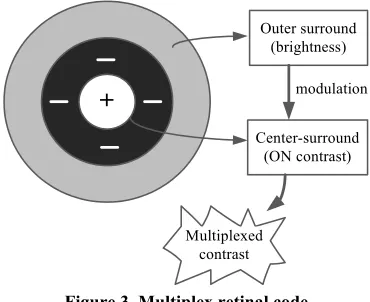
Lightness anchoring model generally incorporates an extra luminance-driven channel to recover absolute lightness in addition to retinal contrast channels. Maybe multi-scale band-pass filters are used to get contrast and luminance information, such as aFILM model which acquires contrast information through small scale filter-ing and obtains luminance information through large scale filtering [4]. There is evidence showing that a lar-ger disinhibitory surround exists outside of the classical receptive field of retinal ganglion cells. Accordingly, a multiplex retinal code is proposed to solve the anchoring problem. The code is composed of retinal contrast re-sponses, where contrast responses are locally modulated by brightness (ON cell) or darkness (OFF cell). The modulation is implemented by an extensive disinhibitory surround or outer surround (OS), an annulus which is situated beyond the classical center-surround receptive of
retinal ganglion cells as shown in Figure 3 [8]. The
clas-sical receptive field is sensitive to contrast information and outer surround is sensitive to local luminance. Then
+
Outer surround (brightness)
Center-surround (ON contrast)
modulation
[image:3.595.330.515.90.241.2]Multiplexed contrast
Figure 3. Multiplex retinal code
luminance-correlated contrast information can be ob-tained through multiplex encoding without additional luminance channels. Also, it is plausible from a neuron-physiological point of view.
Due to the asymmetry phenomenon of ON cell and OFF cell responses for the classical center-surround re-ceptive field of retinal ganglion cells, a self-inhibition mechanism is adopted:
( )
[ ]
ij c s c s
ij ij ij ij ij ij
dx t
x I I I I x
dt
(8)
( )
[ ]
ij s c s c
ij ij ij ij ij ij
dx t
x I I I I x
dt
(9)
where xij and ij
x are ON cell and OFF cell responses
respectively, [ ] max( ,0) , and is a decay factor. c
ij ij
I S is center input. s ( )
ij s ij
I SG is surround
input. Gs is a Gaussian kernel. “” denotes
convolu-tion operator. The last term of the right side of above equations denotes self-inhibition which is used to solve the response asymmetry problem [9].
Let m and m denote local luminance-correlated
multiplexed contrast response of ON and OFF channels respectively. The activity of the outer surround is
com-puted by convolution with a Gaussian kernel:O
[ ] O
Norm S G . Norm[ ] implements the normaliza-tion operator which maps the input into [0 1]. Outer sur-round activity acts to multiplicatively gate the classical center-surround responses of retinal ganglion cells. So the multiplexed contrast responses are defined as
1
[ ] , [ ]
1
ij ij
ij ij ij ij
o ij o ij
O O
m x m x
O O
(10)
where o is a saturation constant.
2.3 Boundary Detection
FCS model. In this paper, we use different contrast in-formation. Boundary detection is completed through a dynamic normalization network [10]. First, we define an operator [ ]:
| | 1 [ ] 1 x e x x e
(11)
We can get
| |
1
lim [ ] lim
1
, 0
0, 0 max( ,0)
0, 0 x e x x e x x x x x (12) similarly,
lim [ ] min( ,0)x x
(13)
0
[ ] |x x
(14)
for simplicity we denote:
0 0
lim , lim , |
.
Subsequently, we define nonlinear diffusion operators:
4
( , )
[ ]
ij
ij pq ij
p q N
f f f
(15)4
( , )
[ ]
ij
ij pq ij
p q N
f f f
(16)where 4 {( 1, ), ( 1, ), ( , 1), ( , 1)}
ij
N i j i j i j i j is a four
nearest neighborhood. The dynamic normalization equa-tions are: 0 ( ) ( ) ( ) ij ij ij da t
a t S t t
dt
(17)
0 ( ) ( ) ( ) ij ij ij db t
b t S t t
dt
(18)
( )
(0 ) (1 )
ij
ij ij ij ij ij
dc t
b c a c S
dx (19)
( )
(1 ) (0 )
ij
ij ij ij ij ij
dd t
b d a d S
dx (20)
is a diffusion coefficient, a b c dij, , ,ij ij ij are min- syncytium, max-syncytium, normalized ON type and
OFF type cell activity respectively. denotes Dirac’s
delta function. Seen from (17), a cell aij of the min-
syncytium may only decrease its activity along with time, as long as there exists any activity gradient between this cell and its four nearest neighbors. The result of diffusion
is that aij decreases to the global minimum value. In an
analogous fashion, a cell bij of the max-syncytium
finally gets the global maximum value of activity. We can get smooth and continuous boundary contour by
ear-ly dynamics of the dynamic normalization network. We
denote the resultant responses as y y, . ON contour
and OFF contour representing diffusion barriers are de-fined as ( ) ( ) w w ij ij w ij thresh y w thresh y
(21)
( ) ( ) w w ij ij w ij thresh y w thresh y
(22)
where w is a saturation constant,
( ) [ [ ] ]
w w
thresh x Norm x
, w [0,1].
The detected boundaries are always discontinuous due to noise or other factors, which allows for activity ex-change between adjacent surface representations. Con-sequently, perceived luminance contrasts between sur-faces decrease, because they eventually adopt the same value of perceptual activity. It’s the so-called fogging problem. In order to counteract fogging, an interaction zone around contours is defined. Within this zone, brightness activity and darkness activity undergo mutual inhibition, leading to a slow-down of diffusion rate at boundary leaks. Thus fogging is decelerated and surface edges will appear blurry at boundary gaps. Let
( )
z
ij ij ij
z thresh w w
(23)
with a threshold value z. Interaction zone activity Z is
defined as z z z Z G z
(24)
where z is a saturation constant, Gz is a Gaussian
kernel with standard deviation z.
2.4 Surface Filling-in
The multiplex contrast responses diffuse within regions formed by boundary contours to form perceptual surface representations. Diffusion layers are computed by dy-namic equations: 4 ( , ) 0 ( ) ( ) [ ]
( ) ij
ij
ij in ij ijpq pq ij
p q N
ij
df t
w E f P f f
dt
t t m
(25)4
( , )
0
( )
( ) [ ]
( ) ij
ij
ij in ij ijpq pq ij
p q N
ij
df t
w E f P f f
dt
t t m
(26)where /
ij
f represent brightness and darkness activity.
is a constant, Ein is an inhibitory reversal potential.
1
1 ( [ ] [ ] )
ijpq
ij ij pq ij
P
Z f Z f
(27)
1
1 ( [ ] [ ] )
ijpq
ij ij pq ij
P
Z f Z f
(28)
where is a constant. From equations above we can
see that OFF contours are used to block brightness activ-ity diffusion while ON contours are employed to block darkness activity diffusion. In this way, we can alleviate the activity trapping problem. The perceptual activity of surface representations
[ ] [ ]
[ ] [ ]
leak rest ij ij
ij
leak ij ij
g V f f
p
g f f
(29)
where gleak is leakage conductance, and Vrest is the
resting potential.
3. Simulation Results
In order to validate the effectiveness of the proposed model, we first evaluate the performance of each stage, then the lightness perception performance of the whole model is tested using natural images. The size of test images in simulation is 256 × 256.
3.1 Retinal Adaptation
Firstly, we evaluate the performance of retinal adaptation.
The simulation results are illustrated in Figure 4. The
original input image, HC activity and retinal adaptation
output are shown in Figures 4(a)-(c) respectively. The
input image has intensive contrast, thus we can hardly see the dark scene. Through retinal adaptation processing, we cannot only see the clouds in sky of bright region, but also see the sand of dark region, even small rocks on the ground. It’s the result of light adaptation and spatial con-trast adaptation of the retina.
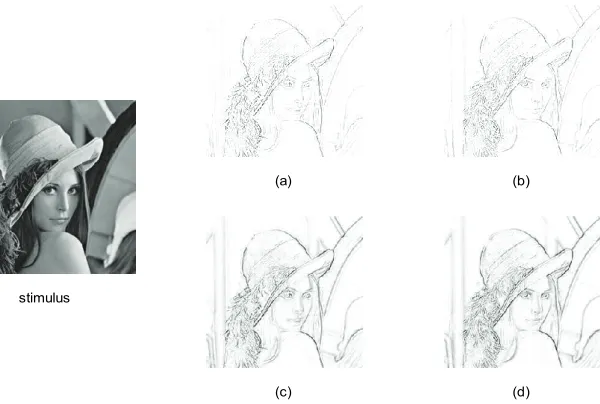
3.2 Boundary Contour Detection
In this section, we compare the boundary detection per-formance of dynamic normalization with that of classical
laplacian linear filtering method. Figures 5(a) and (b)
are ON and OFF boundaries of Lena image obtained by
laplacian method. Figures 5(c) and (d) are detection
[image:5.595.97.248.86.145.2] [image:5.595.132.464.373.467.2]results from dynamic normalization. As we can see from
Figure 5, the boundary contours obtained by dynamic normalization are smoother and more continuous, which will block the diffusion between different regions more effecttively in later filling-in processing, thus alleviating
(a) (b) (c)
Figure 4. Retinal adaptation simulation. (a) stimulus; (b) HC activity; (c) adaptation output
stimulus
(a) (b)
(c) (d)
[image:5.595.157.457.498.700.2]the fogging problem.
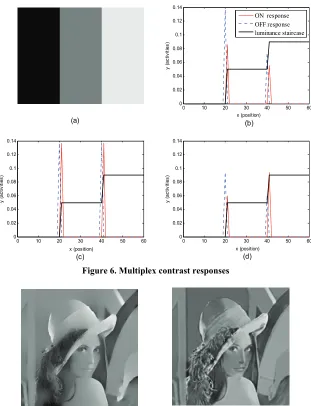
3.3 Multiplex Contrasts
For the synthetic stimulus in Figure 6(a), one-dimen-
sional luminance staircase is shown in (b)-(d) by the
black solid lines. The red solid lines denote ON re-sponses while the blue dashed lines correspond to OFF
responses. Figure 6(b) shows the responses of classical
center-surround receptive field. OFF responses are al-ways higher than ON responses around edges, and both decrease with luminance increase. The asymmetry prob-lem of ON and OFF responses is solved by
self-Inhibi-tion mechanism illustrated in Figure 6(c), where ON and
OFF responses are only sensitive to contrast and insensi-tive to luminance. Therefore, we could modulate ON responses with local brightness and OFF with local darkness, thus getting luminance-correlated multiplex
contrast responses. As seen in Figure 6(d), ON
re-sponses increase while OFF rere-sponses decrease as the luminance increases.
3.4 Surface Filling-in
Nonlinear diffusion is used to implement surface filling- in and recover absolute perceived lightness. Most fill-ing-in models have blurring, trapping and fogging prob-lems such as confidence-based filling-in. As described previously, in this paper, different boundaries are used for the brightness and the darkness diffusion layers. As a consequence, trapping can be weakened to some extent. Besides, the adoption of interaction zone could alleviate
fogging. Figure 7(a) shows the result of confidence-
based filling-in, demonstrating serious fogging problem.
Figure 7(b) is the filling-in result of the proposed model. It can be seen that absolute lightness is recovered while
(a)
0 10 20 30 40 50 60
0 0.02 0.04 0.06 0.08 0.1 0.12 0.14
(b)
y (
ac
tiv
itie
s)
x (position)
0 10 20 30 40 50 60
0 0.02 0.04 0.06 0.08 0.1 0.12 0.14
(c)
x (position)
y (
ac
tiv
itie
s)
0 10 20 30 40 50 60
0 0.02 0.04 0.06 0.08 0.1 0.12 0.14
(d)
y (
ac
tiv
itie
s)
x (position)
[image:6.595.142.453.290.696.2]ON response OFF response luminance staircase
Figure 6. Multiplex contrast responses
(a) (b)
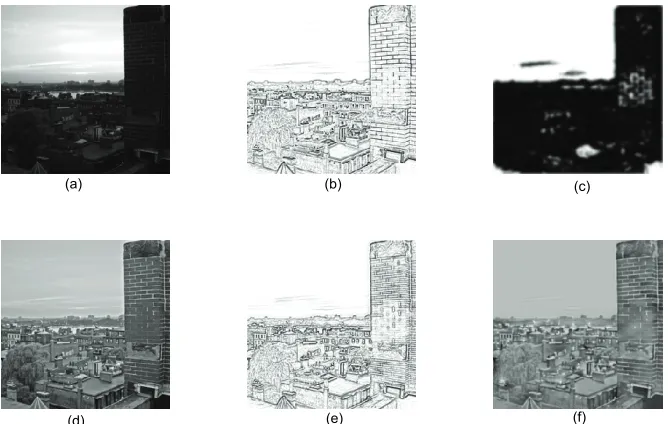
Figure 8. Lightness perception of a real-world image. (a) stimulus; (b) ON contour; (c) interaction zone; (d) retinal adapta-tion; (e) OFF contour; (f) perception result
reserving contrast, without fogging problem.
Finally, we test the performance of the whole model using a real-world image. Simulation results of different
processing stages are shown in Figure 8. We can found
that the proposed model could recover absolute lightness of natural images under varying illuminating conditions. Comparing with aFILM model, it can get smoother and more continuous contours than BCS, and explicitly wea-kens blurring, trapping and fogging problems to some degree. Moreover, the proposed model has the advantage of illuminating adaptation in comparison with Sepp’s brightness perception model. It provides an alternative approach for lightness perception.
4. Conclusions
In this paper, a perceptual lightness anchoring model based on visual cognition is proposed. It can recover ab-solute lightness of real-world images using filling-in mechanism from single-scale boundaries. Further, it can weaken trapping, blurring and fogging to some extent. Reasonable perceptual results could be obtained for nat-ural images under varying illumination conditions. The proposed model could be applied to image enhancement and image reconstruction in machine vision, and facili-tate robust processing of higher levels such as object recognition. However, there are not normative objective measurements to evaluate the performance of visual cog-nition model. Most measurements are qualitative, and it makes no exception for this paper. Additionally, this model recovers absolute lightness from single scale channel. So its ability of noise suppression is weaker
than multi-scale processing. We will study further in these aspects.
5. Acknowledgements
This work was supported by the National Natural Sci-ence Foundation of China (No. 60835005) and Scientific Research Plan Projects of NUDT (No. JC09-03-04). The authors are very grateful to the reviewers for their valu-able remarks and constructive comments on this paper.
REFERENCES
[1] A. Gilchrist, C. Kossyfidis, F. Bonato and T. Agostini, “An Anchoring Theory of Lightness Perception,” Psy-chological Review,Vol. 106, No. 4, 1999, pp. 795-834. [2] M. Anton-Rodrigurez, F. J. Diaz-Pernaz, J. F.
Diez-Hi-guera, M. Martinez-Zarzuela, D. Gonzalez-Ortega and D. Boto-Giralda, “Recognition of Coloured and Textured Images through a Multi-Scale Neural Architecture with Orientational Filtering and Chromatic Diffusion,” Neu-rocomputing,Vol. 72, No. 16-18, 2009, pp. 3713-3725. [3] A. Fazl, S. Grossberg and E. Mingolla, “View-Invariant
Object Category Learning: How Spatial and Object At-tention are Coordinated Using Surface-Based AtAt-tentional Shrouds,” Cognitive Psychology,Vol. 58, No. 1, 2009, pp. 1-48.
[4] S. Grossberg and S. Hong, “A Neural Model of Surface Perception: Lightness, Anchoring, and Filling-in,” Spatial Vision,Vol. 19, No. 2-4, 2006, pp. 263-321.
[5] W. Sepp and H. Neumann, “A Multi-Resolution Fill-ing-in Model for Brightness Perception,” 9th Interna-tional Conference on Artificial Neural Networks, 1999, pp. 461-466.
(c) (b)
(e) (f)
(a)
[6] M. Vanleeuwen, I. Fahrenfort, T. Sjoerdsma, R. Numan and M. Kamermans, “Lateral Gain Control in the Outer Retina Leads to Potentiation of Center Responses of Retinal Neurons,” The Journal of Neuroscience,Vol. 29, No. 19, 2009, pp. 6358-6366.
[7] H. Jouhou, K. Yamamoto, M. Iwasaki and M. Yamada, “Acidification Decouples Gap Junctions but Enlarges the Receptive Field Size of Horizontal Cells in Carp Retina,” Neuroscience Research, Vol. 57, No. 2, 2007, pp. 203- 209.
[8] M. S. Keil, G. Cristobal, T. Hansen and H. Neumann,
“Recovering Real-World Images from Single-Scale Boundaries with a Novel Filling-In Architecure,” Neural Networks, Vol. 18, No. 10, 2005, pp. 1319-1331.
[9] R. D. S. Raizada and S. Grossberg, “Context-Sensitive Binding by the Laminar Circuits of V1 and V2: A Unified Model of Perceptual Grouping, Attention, and Orientation Contrast,” Boston University, 2000.