ISSN Online: 2327-4379 ISSN Print: 2327-4352
DOI: 10.4236/jamp.2019.710149 Oct. 8, 2019 2169 Journal of Applied Mathematics and Physics
A Three-Dimensional Numerical Model for
Predicting the Weld Bead Geometry
Characteristics in Laser Overlap Welding of
Low Carbon Galvanized Steel
Kamel Oussaid, Abderrazak El Ouafi*
Department of Engineering, University of Quebec at Rimouski, Rimouski, QC, Canada
Abstract
Laser welding (LW) becomes one of the most economical high quality joining processes. LW offers the advantage of very controlled heat input resulting in low distortion and the ability to weld heat sensitive components. To exploit efficiently the benefits presented by LW, it is necessary to develop an inte-grated approach to identify and control the welding process variables in order to produce the desired weld characteristics without being forced to use the traditional and fastidious trial and error procedures. The paper presents a study of weld bead geometry characteristics prediction for laser overlap welding of low carbon galvanized steel using 3D numerical modelling and experimental validation. The temperature dependent material properties, metallurgical transformations and enthalpy method constitute the foundation of the proposed modelling approach. An adaptive 3D heat source is adopted to simulate both keyhole and conduction mode of the LW process. The simu-lations are performed using 3D finite element model on commercial software. The model is used to estimate the weld bead geometry characteristics for var-ious LW parameters, such as laser power, welding speed and laser beam di-ameter. The calibration and validation of the 3D numerical model are based on experimental data achieved using a 3 kW Nd:Yag laser system, a struc-tured experimental design and confirmed statistical analysis tools. The results reveal that the modelling approach can provide not only a consistent and ac-curate prediction of the weld characteristics under variable welding parame-ters and conditions but also a comprehensive and quantitative analysis of process parameters effects on the weld quality. The results show great con-cordance between predicted and measured values for weld bead geometry characteristics, such as depth of penetration, bead width at the top surface How to cite this paper: Oussaid, K. and El
Ouafi, A. (2019) A Three-Dimensional Numerical Model for Predicting the Weld Bead Geometry Characteristics in Laser Overlap Welding of Low Carbon Galva-nized Steel. Journal of Applied Mathemat-ics and PhysMathemat-ics, 7, 2169-2186.
https://doi.org/10.4236/jamp.2019.710149
Received: August 29, 2019 Accepted: October 5, 2019 Published: October 8, 2019
Copyright © 2019 by author(s) and Scientific Research Publishing Inc. This work is licensed under the Creative Commons Attribution International License (CC BY 4.0).
DOI:10.4236/jamp.2019.710149 2170 Journal of Applied Mathematics and Physics and bead width at the interface between sheets, with an average accuracy greater than 95%.
Keywords
Laser Welding, Low Carbon Galvanized Steel, Overlap Welding, Weld Bead Geometry Characteristics, 3D Modeling, Prediction Model, Finite Elements Method, Taguchi Method, ANOVA, Nd:YAG Laser Source
1. Introduction
The reduction of energy consumption and atmospheric pollution as well as the improvement of safety have led the automotive industry reconsider their design methods in order to decrease the weight of vehicles by using high performance materials. The tailored welded banks are now the major components constitut-ing the new vehicle body. This design approach aims to optimize the weight of the vehicle structure by joining sheets from various nuances of high resistance material and different thicknesses. Therefore, the quantity of welds in the car body was more than doubled in the last years. In these conditions, the aptitude of the welds to resist to diverse solicitations remains the main concern of engi-neers. This aptitude is conditioned largely by the weld cross section geometry characteristics [1]. The identification of the laser parameter adjustments that lead to desired welds characteristics, without being forced to use the traditional and fastidious trial and error procedures, requires accurate and robustly predic-tive modelling approaches.
DOI: 10.4236/jamp.2019.710149 2171 Journal of Applied Mathematics and Physics presented the best option especially for laser welding [15]. Gaussian rotary vo-lumetric heat source model proposed to simulate the heat input of laser energy in a finite element thermal analysis of laser welding of galvanized high-strength steel in a zero-gap lap joint configuration produced good results for the weld pool size prediction [13]. Models using the same type of heat source provided better results in the temperature fields estimation compared to other types of heat sources [14].
More recently, the combination of two types of heat sources, such as Gaussian conical combined with cylindrical heat source is proposed [16]. Nail head heat source resulting from the combination of point and line sources is used to de-scribe the keyhole formation [2]. Wang proposed another model using a poly-nomial heat source for welding based on a Gaussian heat density distribution, by combining disc source for surface heating and polynomial equation for volume-tric penetration [3]. Chande and Mazumder also investigated moving Gaussian heat source in a 3D laser welding modeling using finite differences numerical technique [4]. Despite the relatively good results obtained, the models perfor-mance remains quite limited. The advent of finite element computing software offered the possibility to build multi-physics and complex models integrating diverse interacting phenomena in the welding process. This permitted the de-velopment of many useful models to understand the evolution of welds forma-tion and to identify the effects of this evoluforma-tion on the quality of the resulting welds. As examples, the thermo-hydraulic 2D models developed to simulate the keyhole formation including the melting and vaporization of the metal [5] or to understand the evolution of the liquid/gas interface during pulsed laser welding [6].
Another study reported that convection heat transfer plays a very important role in the welding process and considered the most important factor influen-cing the shape and the geometry of the weld cross-section [16]. It is also re-ported in this study that convection heat transfer may be responsible for certain defects, such as variable penetration and lack of fusion. A hydrodynamic laser welding model including the effect of recoil pressure on the flow of molten metal is proposed reveal that the convective heat transfer induced by the recoil pressure is important for the laser absorption [17]. Chan investigated the flow in a molten pool generated by the laser by taking into account the convection of Marangoni [18]. The Marangoni phenomenon modifies the characteristics of the melting and solidification process, and makes the melt wider and shallower. The thermal prop-erties of the material are also significant factors in the formation and shape of the melting pool [19]. The prediction of the mechanical characteristics of the welds does not always require complex models. In a detailed literature review, Mack-wood and Crafer indicated that the thermal models are often sufficient and effi-cient in the case of laser welding [9]. However, in most studies, the heat sources are used in keyhole mode and conduction mode separately, and in most cases, the models are applied on laser welding in butt joint configuration.
DOI:10.4236/jamp.2019.710149 2172 Journal of Applied Mathematics and Physics of various laser welding parameters on the welding quality [20]. Laser power, welding speed, laser fiber diameter, gap between sheets and sheets thickness are combined and used to evaluate the variation of three geometrical characteristics of the weld: penetration depth, bead width at the surface and bead width at the interface. In this study, various improved statistical tools are used to investigate the effects of the welding parameters on the weld quality and to identify the possible relationship between these parameters and the geometrical characteris-tics of the weld. The investigation results reveal that there are many options can be considered for building an efficient welds quality prediction model. Results achieved using an artificial neural network (ANN) based simplified model demonstrated promising model performances.
Indeed, when a fast and efficient prediction model is needed, ANN offers many advantages especially in the case of computationally intensive predictions and real-time applications where numerical models are very slow and not adapted. ANN models have been used with success to model many welding process. However, ANN model can accurately predict the weld geometry as well as the change in weld pool profiles like between conduction mode and keyhole mode only if trained with good and appropriate data. Moreover, producing an accurate and flexible ANN model requires very large data to ensure efficient ANN learning and validation processes. On the other hand, the generation of the needed data using experiment is relatively long and expensive. Therefore, expe-rimentally validated 3D finite element method based models can be used to gen-erate acceptable and cost effective data.
DOI: 10.4236/jamp.2019.710149 2173 Journal of Applied Mathematics and Physics a consistent and accurate prediction of the weld bead geometry characteristics under variable welding parameters and conditions but also a comprehensive analysis of the average effects of the welding parameters on the weld quality. The results show great concordance between predicted and measured values of the weld characteristics.
The paper is organized in four parts as follows. The first presents an introduc-tion, a brief review and the objectives of the study. The second outlines suc-cinctly the numerical method, describes the model, the governing equations and the simulation parameters and conditions. The third discusses the numerical and experimental results. The fourth presents the conclusion of the work and outline the potential direction of future research.
2. Method and Materials
2.1. Model Description
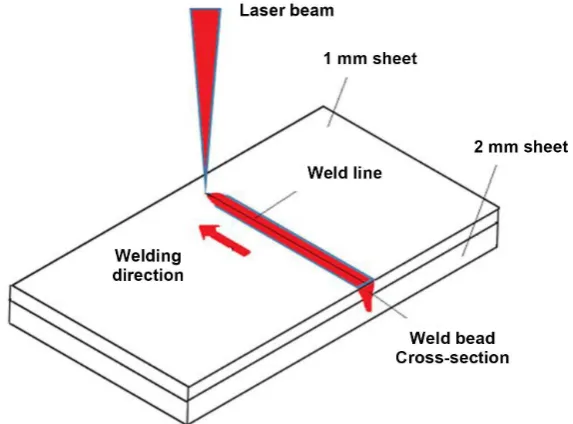
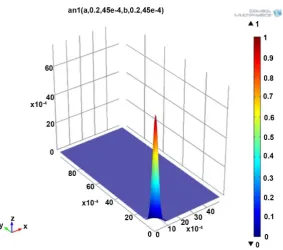
The 3D simulation model of the laser welding process in overlap joint configura-tion consists to irradiate two overlapped low carbon galvanized steel sheets with respective thickness of 1 and 2 mm, as presented in Figure 1. The laser beam di-rected to the upper surface moves along a straight line, which becomes the axis of the performed weld bead. The laser beam is represented as a moving 3D vo-lumetric heat source with a conical Gaussian distribution so that the integral of the air under the heat distribution curve equals to a unit as illustrated in Figure 2. The heat source model expressed as function of the laser welding parameters and the material properties is used to determine the size and the shape of the weld cross section. This representation allows to evaluate the weld bead geome-try characteristics variation as function of the laser welding parameters [8].
[image:5.595.229.516.491.703.2]The proposed model is however built under various simplifying assumptions such as: 1) the influence of zinc vapor diffusion on the thermal properties of
DOI:10.4236/jamp.2019.710149 2174 Journal of Applied Mathematics and Physics
Figure 2. Gaussian distribution of laser beam power.
weld zone is ignored. 2) The experimental investigations revealed a relatively li-mited effect of the gap size on different weld geometric characteristics. The maximum observed contribution of the gap in these characteristics variation represents approximately 5%. Therefore, the gap size is not considered as variable in the present model. 3) The material is considered homogeneous and isotropic. 4) The welded parts are considered free from any geometrical imper-fection, and finally 5) Fluid flows, Marangoni effect and the latent heat of vapo-rization are not considered in order to simplify the model and to avoid long si-mulations.
2.2. Heat Transfer Formulation
The proposed model is based on conduction heat transfer including melting phase change. Equation (1) called Fourier’s second law, describes the transient heat conduction in the solid. Solving this well-known equation permit to obtain the temperature field distribution in welded sheets at specific time and spatial coordinates.
(
)
2 d
, , , d
P
T
C k T Q x y z t
t
ρ = ∇ + (1)
where ρ, k, Cp and Q Denote respectively the material density, the thermal
con-ductivity, heat capacity and the heating power per unit volume.
DOI: 10.4236/jamp.2019.710149 2175 Journal of Applied Mathematics and Physics
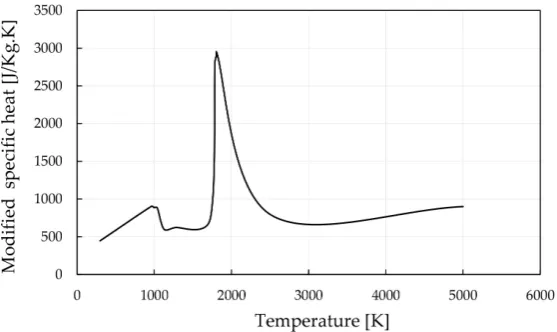
Figure 3. Temperature dependent specific heat including the enthalpy of fusion.
( )
2* 1
e
f T T
T
P P f
C C T L
T π
− −
∆
= +
∆ √ (2)
With Tf the melting point, Lf tent heat of fusion and ∆T a temperature
range of solid/liquid phase change set to 72 K.
2.3. Boundary and Initial Conditions
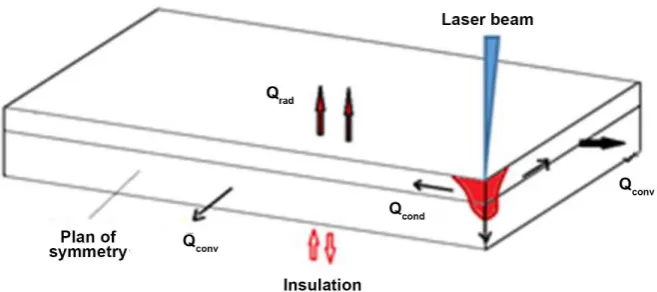
At the initial time, sheets temperature is uniform and set at the room tempera-ture T_0 = 295 K. Heat exchange between the welded parts and their external environment is integrated into the numerical model as a heat loss, which is ex-pressed by convection and radiation. The convection occurs in the top surface and frontal surfaces. The convection is expressed as:
(
0)
conv
Q =h T−T (3)
With h the natural convection coefficient and T0 the room temperature. The radiation is occurred at the top surface and expressed by the Stephan Boltzmann law:
(
4 4)
0
rad
Q =σε T −T (4)
With σ Stephan-Boltzmann constant and ε the material emissivity.
The bottom surface is supposed thermally insulated according to the following equation:
(
)
0n k T
− ∇ = (5)
DOI:10.4236/jamp.2019.710149 2176 Journal of Applied Mathematics and Physics
Figure 4. Heat transfer modes and boundary conditions applied to the laser welding process.
2.4. Heat Source Modeling
The identification of adequate heat source is the most important step in welding process model building. According to the literature, a conical heat source with Gaussian distribution is the simplest and the most appropriate for predicting the shape of the laser weld bead cross-section [21]. Depending on the density of la-ser energy and the interaction time with the metal parts, two welding modes are possible: the conduction mode and the keyhole mode. The conduction mode occurs before reaching the vaporization temperature of the metal. In this mode, the energy is absorbed directly by the metal and dissipated by conduction in all directions, thus favouring round and wide welds with small penetration. In key-hole mode, which is characterized by a high energy density and a sufficiently slow interaction time, the irradiated surface of the metal reaches rapidly the va-porization temperature. These vapours create an evacuation channel, which al-lows a better and deeper absorption of the laser beam energy, thus producing deep and sharp v-welds [22].
In General, to differentiate between the two welding modes during modeling, simply assign a heat source to each mode. A 2D surface heat source (Equation (6)) to the conduction mode and a 3D volumetric heat source (Equation (7)) to the keyhole mode. The transition between the two modes must take place at the vaporisation temperature, but this increases the model complexity, because it can happen, for the same laser conditions, to start the simulation with 2D heat source and finish with 3D heat source.
(
)
0(
)
(
0) (
2)
22 2 2
1
, , exp
2 2 2
x x
Q A R y vt
Q x y t
r r r
π
−
− −
= ⋅ − −
(6)
(
)
0(
)
(
0) (
2)
22 2 2
1
, , , exp
2 2 2 c
x x
Q A R y vt
Q x y z t A z
r r r
π
−
− −
= ⋅ − − −
(7)
DOI: 10.4236/jamp.2019.710149 2177 Journal of Applied Mathematics and Physics is calibrated by introducing two coefficients (m and n) to adapt respectively the weld bead width and the absorption depth of the laser beam. These coefficients are related to the laser parameters with the most significant contribution to the variation of weld characteristics [20].
(
)
0(
)
(
0) (
2)
22 2 2
1
, , , exp
2 ( ) 2 c
x x
Q A R y vt
Q x y z t nA z
r mr r
π − − − = − − −
(8)
where Q v0, , ,ARand r denote respectively laser power, welding speed, material absorptivity, material reflectivity and laser beam radius.
The coefficients m and n are estimated as function of the laser parameters us-ing the followus-ing empirical relationships.
(
)
6[ ]
[ ]
0 1.194 17310 0 18.33 m 649
n k T m Q W v d m
s
−
− ∇ = = − + +
(9)
[ ]
[ ]
6
0.565 8310 0 9.44 m 123
n Q W d m
s
−
= − + +
(10)
2.5. Geometry and Material Properties
The geometry is discretized using an extremely refined tetrahedral mesh at the neighborhood of the weld line and large mesh elements in the rest of the geome-try. A mesh convergence study is conducted to determine the optimal mesh size, by simulating the welding process using the same laser parameters setting (2500 [W] laser power, 55 [mm/s] welding speed and 395 [μm] laser beam diameter) and different mesh sizes around the weld line.
As illustrated in Figure 5, the temperature is evaluated at a specific time in two points, located respectively in the top surface and the interface of the melt-ing pool, accordmelt-ing to different mesh sizes. Convergence curves show that peratures become unchanged for mesh value less than 0.15 mm, otherwise, tem-peratures fluctuate due to errors in accuracy and truncation. To reduce the cal-culation time, the width and length of the geometry are reduced, on condition that the weld attributes are evaluated in the area where the welding process has reached its stationary state. The final dimensions of the meshed geometry are il-lustrated in Figure 6.
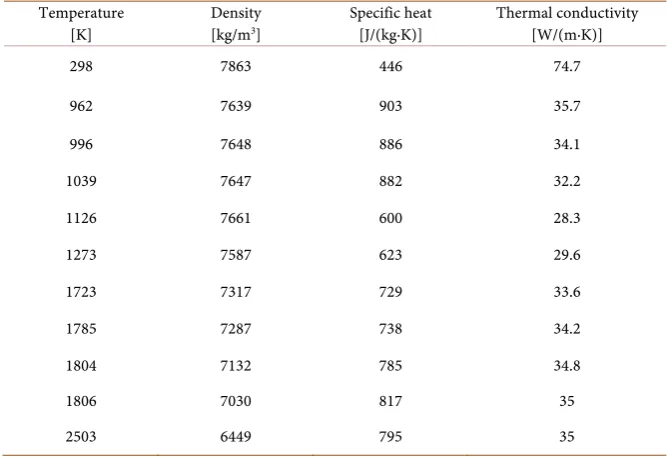
In order to validate the proposed model, typical ASTM A635 CS galvanized steel sheets with A40 coating type commonly used in the automotive industry are used to perform the overlap joint welds. The temperature dependant proper-ties of this low carbon steel, which are density, thermal conductivity and specific heat, integrated in model are summarized in Table 1. The material constants are presented in Table 2.
2.6. Laser Parameter Setting and Model Validation
DOI:10.4236/jamp.2019.710149 2178 Journal of Applied Mathematics and Physics
[image:10.595.214.534.268.451.2]Figure 5. Mesh convergence study.
[image:10.595.205.539.497.732.2]Figure 6. Finite element mesh of weld specimen.
Table 1. Temperature dependent properties of low carbon steel. Temperature
[K] Density [kg/m3] Specific heat [J/(kg∙K)] Thermal conductivity [W/(m∙K)]
298 7863 446 74.7
962 7639 903 35.7
996 7648 886 34.1
1039 7647 882 32.2
1126 7661 600 28.3
1273 7587 623 29.6
1723 7317 729 33.6
1785 7287 738 34.2
1804 7132 785 34.8
1806 7030 817 35
DOI: 10.4236/jamp.2019.710149 2179 Journal of Applied Mathematics and Physics
Table 2. Constant properties of low carbon steel.
Property Symbol Value Unit
Temperature liquidus TL 1806 K
Temperature solidus TS 1734 K
Latent heat of fusion Lf 244 kJ/kg
Material emissivity ε 0.6
Material Absorptivity A 800 1/m
Material reflectivity R 0.3 -
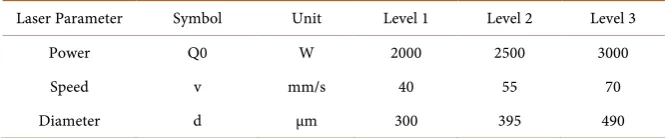
Table 3. Welding process parameters.
Laser Parameter Symbol Unit Level 1 Level 2 Level 3
Power Q0 W 2000 2500 3000
Speed v mm/s 40 55 70
Diameter d μm 300 395 490
power, welding speed and laser beam diameter). These parameters and levels are fixed following a series of preliminary tests [20]. Both for simulations and expe-riments, the weld cross section dimensions are measured in the stationary state zone to evaluate three weld geometry characteristics: depth of penetration (DOP), bead width at the top surface (WS) and bead width at the interface be-tween sheets (WI). The cutting plane is located in the middle of the work piece and simulation results are evaluated at time t = L/2v.
The total computation time depends on the welding speed: time_end = L/v, while the time step depends on the laser beam diameter, such the position of the laser beam at time t_i is located at a distance s = 2/3 *d from its previous posi-tion, ie at time t_(i-1).
Where L is the model geometry length, d the laser beam diameter and v the welding speed.
3. Results and Discussions
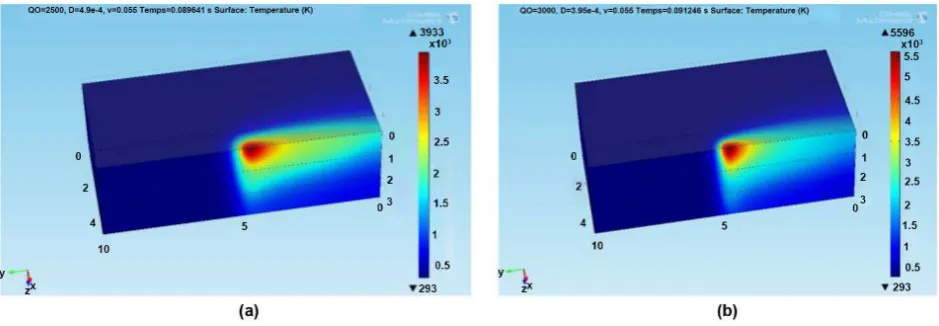
The contours of the weld cross sections are determined from the temperature fields based on the location of points reaching the liquidus temperature. The weld penetration depth and the weld seam width, respectively at the surface and at the interface are measured on the cross sections of the weld using an adapted Matlab indexing algorithm. Figure 7 and Figure 8 show examples of typical si-mulation and experimental results. The predicted bead characteristics are then compared to the measurements obtained from the experiments. The model per-formance is evaluated using various statistical criteria estimating the prediction errors.
[image:11.595.206.541.253.322.2]DOI:10.4236/jamp.2019.710149 2180 Journal of Applied Mathematics and Physics
[image:12.595.209.535.281.425.2]Figure 7. Simulation results for (a) P = 2500 W, V = 55 mm/s and D = 490 μm, and (b) P = 3000 W, V = 55 mm/s and d = 395 μm.
Figure 8. Typical cross section shape of overlap welded galvanized sheets.
obtain a satisfactory prediction error estimate. The following four traditional es-timates from forecasting techniques are often used: 1) the coefficient of deter-mination (R2), 2) the Mean Absolute Error (MAE), 3) the Mean Absolute Per-cent Error (MAPE), 4) the Mean Root Squared Error (MRSE), and 5) the Rela-tive Mean Root Squared Error (RMRSE). They can be defined mathematically as:
(
)
(
)
2 1 2 2 1 ˆ 1 n i n i i i i y y R y y = = − = − −∑
∑
(11)1 1 ˆ n i i i
MAE y y
n =
=
∑
− (12)( )
1 ˆ 1 100 % n i i i i y y APEn = y
−
=
∑
(13)(
)
21 1 ˆ i n i i
MRSE y y
n =
=
∑
− (14)( )
100 % MRSE RMRSEy
DOI: 10.4236/jamp.2019.710149 2181 Journal of Applied Mathematics and Physics The combination of these statistical tools provides a very clear picture of the model performance by providing a satisfactory prediction error estimates. The performance of the model, based on the selected five criteria, is presented at Ta-ble 4. The results reveal a good agreement between predicted and measured bead geometry characteristics. The model provides an R2 less than 90% the three
weld characteristics. R2 reaches 96%. The maximum observed MAPE remains
less than 7.5% representing about 7%, 2.5% and 7.5 for DOP, WS and WI re-spectively. The maximum observed RMRSE remains less than 3.5% representing 3.04%, 1.09% and 3.32 for DOP, WS and WI respectively. The best model per-formance is obtained for WS with prediction errors 3 times lower than for DOP and WI. The highest errors are obtained for WI. This is explained by slight vari-ation of the gap during the experiments. Globally, with such good results, the model is considered adequate to be used without difficulty in predictive strate-gies.
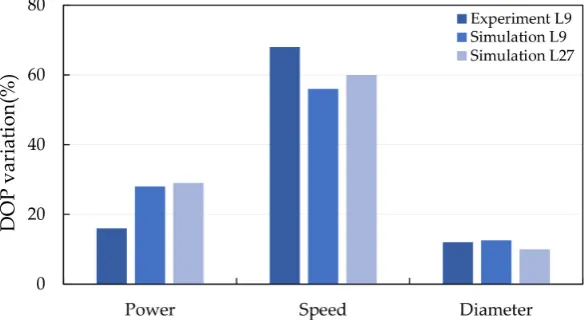
Another dimension of the model evaluation consists to compare the laser pa-rameters effects on the weld bead geometry characteristics extracted from ANOVA performed on the L9 experimental data with those extracted from
ANOVA performed on simulation data. The simulation data are generated from a structured L27 factorial design using the same parameter as in the
experimenta-tion. The choice of L27 is motivated by the possibility to evaluate the effect of the
laser parameters interaction on the variation weld bead geometry characteristics. The interaction cannot be evaluated by a fractional design.
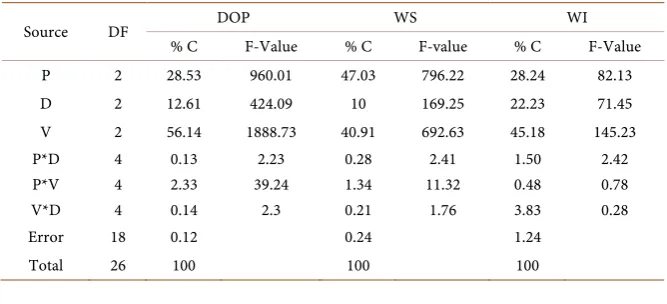
[image:13.595.206.539.497.553.2]Table 5 summarises the ANOVA results based on the simulation data. The laser parameters effects, in term of percentage contributions of the (% C), on the variation of the three weld characteristics are practically the same as in the case of the experimental data. Figure 9, Figure 10 and Figure 11 illustrate the com-parison of the % C obtained respectively from an L9 experimental data, an l9
Table 4. Performance of the prediction of weld geometry characteristics.
R2 MAE MAPE MRSE RMRSE
DOP 90.94% 146.33 6.94% 60.22 3.04%
WS 96.09% 30.56 2.44% 13.84 1.09%
[image:13.595.206.540.583.735.2]WI 94.12% 102.11 7.28% 40.75 3.32%
Table 5. Simplified ANOVA results for DOP, WS and WI.
Source DF DOP WS WI
% C F-Value % C F-value % C F-Value P 2 28.53 960.01 47.03 796.22 28.24 82.13 D 2 12.61 424.09 10 169.25 22.23 71.45 V 2 56.14 1888.73 40.91 692.63 45.18 145.23 P*D 4 0.13 2.23 0.28 2.41 1.50 2.42 P*V 4 2.33 39.24 1.34 11.32 0.48 0.78
V*D 4 0.14 2.3 0.21 1.76 3.83 0.28
Error 18 0.12 0.24 1.24
DOI:10.4236/jamp.2019.710149 2182 Journal of Applied Mathematics and Physics
[image:14.595.228.523.272.428.2]Figure 9. Laser parameters contribution to the variation of DOP.
Figure 10. Laser parameters contribution to the variation of WS.
Figure 11. Laser parameters contribution to the variation of WI.
[image:14.595.240.508.466.632.2]DOI: 10.4236/jamp.2019.710149 2183 Journal of Applied Mathematics and Physics
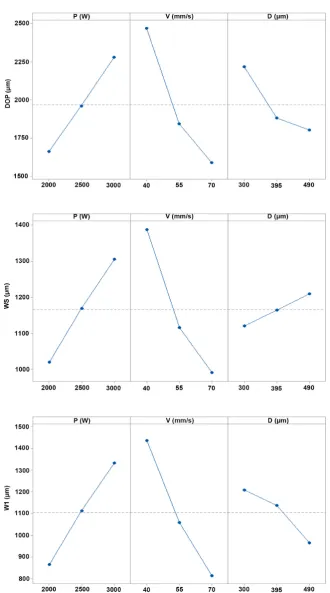
Figure 12. Effects of laser parameters on weld characteristics variation.
cha-DOI:10.4236/jamp.2019.710149 2184 Journal of Applied Mathematics and Physics racteristics, while the laser beam diameter effect remains relatively limited. The evaluation of the laser parameters interaction shows also non-significant effects. The total contribution of all interactions does not exceed 6%. It represents 2.6%, 1.83% and 5.81 for DOP, WS and WI respectively. These results are validated by the graphs of effects of the laser parameters on the weld bead geometry characte-ristics presented in Figure 12. An F-test is conducted to confirm the laser para-meters contributions and effects based conclusions.
4. Conclusions
The present paper presents an integrated approach for building a forecasting 3D finite element model able to predict weld bead geometry characteristics for laser welding of low carbon galvanized steel in overlap configurations. An improved adaptive 3D heat source is used for simulating both keyhole and conduction mode. The implementation of the model is supported by a heat source calibra-tion technique using specific modelling factors defined as funccalibra-tion of the laser parameters to adapt respectively the weld bead width and the absorption depth of the laser beam.
A commercial 3 kW Nd:Yag laser system, a structured experimental design and improved statistical analysis tools are used to evaluate the modelling ap-proach and to confirm the prediction model accuracy. Extensively numerical simulations carried out through 3D finite element method reveal great concor-dance between modelling and experimental results. The comparison of predicted and measured weld geometric characteristics reveals an average accuracy greater than 95%. The prediction errors originate principally from experimental errors as well as from the considered assumptions. Globally, the results demonstrate that the numerical simulation can effectively lead to a consistent and accurate weld bead geometry characteristics prediction model under variable welding pa-rameters and conditions and provide an appropriate framework for comprehen-sively qualitative and quantitative analysis of the effects of welding process pa-rameters on the weld quality.
With the encouraging results obtained using this model, the laser overlap welding of low carbon galvanized steel will be the subject of additional and in-tensive investigations to generate more simulation and experimental data in or-der to develop an efficient ANN predictive modelling approach.
Conflicts of Interest
The authors declare no conflicts of interest regarding the publication of this paper.
References
[1] Ribolla, A., Damoulis, G.L. and Batalha, G.F. (2005) The Use of Nd:Yag Laser Weld for Large Scale Volume Assembly of Automotive Body in White. Journal of Mate-rials Processing Technology, 164-165, 1120-1127.
DOI: 10.4236/jamp.2019.710149 2185 Journal of Applied Mathematics and Physics [2] Kazemi, K. and Goldak, J.A. (2009) Numerical Simulation of Laser Full Penetration
Welding. Computational Mat. Science, 44, 841-849. https://doi.org/10.1016/j.commatsci.2008.01.002
[3] Wang, J., Han, J., Domblesky, J.P., Yang, Z., Zhao, Y. and Zhang, Q. (2016) Devel-opment of a New Combined Heat Source Model for Welding Based on a Polynomi-al Curve Fit of the ExperimentPolynomi-al Fusion Line. The International Journal of Ad-vanced Manufacturing Technology, 87, 1985-1997.
https://doi.org/10.1007/s00170-016-8587-3
[4] Chande, T. and Mazumder, J. (1984) Estimating Effects of Processing Conditions and Variable Properties upon Pool Shape, Cooling Rates, and Absorption Coeffi-cient in Laser Welding. Journal of Applied Physics, 56, 1981-1986.
https://doi.org/10.1063/1.334231
[5] Courtois, M., et al. (2012) Keyhole Formation during Spot Laser Welding: Heat and Fluid Flow Modeling in a 2D Axisymmetric Configuration. Proceedings of the COMSOL Conference, Milan, 1-6.
[6] Bruyere, V., Touvrey, C. and Namy, P. (2014) A Phase Field Approach to Model Laser Power Control in Spot Laser Welding. Proceedings of the COMSOL Confe-rence, Cambridge, 1-6.
[7] Steen, W.M. and Mazumder, J. (2010) Laser Material Processing. Springer Science & Business Media, Berlin. https://doi.org/10.1007/978-1-84996-062-5
[8] Rosenthal, D. (1946) The Theory of Moving Source of Heat and Its Application to Metal Treatment. Transactions of the ASME, 68, 849-866.
[9] Friedman, E. (1975) Thermo-Mechanical Analysis of the Welding Process Using the Finite Element Method. Journal of Pressure Vessel Technology, 97, 206-213. https://doi.org/10.1115/1.3454296
[10] Ashby, M.F. and Easterling, K.E. (1984) The Transformation Hardening of Steel Surfaces by Laser Beams I. Hypo-Eutectoid Steels. Acta Metallurgica, 32, 1935-1948. https://doi.org/10.1016/0001-6160(84)90175-5
[11] Goldak, J., Chakravarti, A. and Malcolm, B. (1984) A New Finite Element Model for Welding Heat Sources. Metallurgical and Materials Transactions B, 15, 299-305. https://doi.org/10.1007/BF02667333
[12] Cline, H.E. and Anthony, T. (1977) Heat Treating and Melting Material with a Scanning Laser or Electron Beam. Journal of Applied Physics, 48, 3895-3900. https://doi.org/10.1063/1.324261
[13] Davis, M., Kapadia, P., Dowden, J., Steen, W.M. and Courtney, C.H.G. (1986) Heat Hardening of Metal Surfaces with a Scanning Laser Beam. Journal of Physics D:
Applied Physics, 19, 1981-1997. https://doi.org/10.1088/0022-3727/19/10/024
[14] Bradley, J.R. (1988) A Simplified Correlation between Laser Processing Parameters and Hardened Depth in Steels. Journal of Physics D: Applied Physics, 21, 834-837. https://doi.org/10.1088/0022-3727/21/5/027
[15] Mackwood, A.P. and Crafer, R.C. (2005) Thermal Modelling of Laser Welding and Related Processes: A Literature Review. Optics & Laser Technology, 37, 99-115. https://doi.org/10.1016/j.optlastec.2004.02.017
[16] Chukkan, J.R., et al. (2015) Simulation of Laser Butt Welding of AISI 316L Stainless Steel Sheet Using Various Heat Sources and Experimental Validation. Journal of Materials Processing Technology, 219, 48-59.
https://doi.org/10.1016/j.jmatprotec.2014.12.008
DOI:10.4236/jamp.2019.710149 2186 Journal of Applied Mathematics and Physics Temperature Field in the Beam Interaction Zone during Laser Material Processing.
Journal of Physics D: Applied Physics, 32, 1819-1825. https://doi.org/10.1088/0022-3727/32/15/309
[18] Chan, C., Mazumder, J. and Chen, M.M. (1984) A Two-Dimensional Transient Model for Convection in Laser Melted Pool. Metallurgical and Materials Transac-tions A, 15, 2175-2184. https://doi.org/10.1007/BF02647100
[19] Bannour, S., Abderrazak, K., Mhiri, H. and Le Palec, G. (2012) Effects of Tempera-ture-Dependent Material Properties and Shielding Gas on Molten Pool Formation during Continuous Laser Welding of AZ91 Magnesium Alloy. Optics & Laser Technology, 44, 2459-2468. https://doi.org/10.1016/j.optlastec.2012.03.034
[20] Oussaid, K., El Ouafi, A. and Chebak, A. (2019) Experimental Investigation of Laser Welding Process in Overlap Joint Configuration. Journal of Materials Science and Chemical Engineering, 7, 16-31. https://doi.org/10.4236/msce.2019.73002
[21] Kannatey-Asibu Jr., E. (2009) Principles of Laser Materials Processing. John Wiley & Sons, Hoboken. https://doi.org/10.1002/9780470459300