doi:10.4236/jssm.2011.42024 Published Online June 2011 (http://www.SciRP.org/journal/jssm)
Implementation of Agility Concepts into Oil
Industry
Ibrahim Hassan Garbie
Department of Mechanical and Industrial Engineering, Sultan Qaboos University, Muscat, Oman. Email: garbie@squ.edu.om
Received January 12th, 2011; revised March 2nd, 2011; accepted March 27th, 2011.
ABSTRACT
Petroleum companies have great interest in developing their countries through improving their resources to be more competitive. They are also trying to maintain a high level of responsiveness to achieve agility and to remain competitive in the global marketplace especially after instability of oil prices and global financial crisis. Agile systems (AS) is con-sidered as the next industrial revolution. Agile systems are concon-sidered as production and/or management philosophies that integrate the available technology, people, production strategiesand organization management systems. Although agility is the set of capabilities and competences that the petroleum companies need to thrive and prosper in a continu-ously changing and unpredictable business environment, measuring the level of agility in these companies is still unex-plored according to the capabilities and competences. There are limited number of scientific papers have mentioned agility measurements in industrial organizations as a general concept and in oil industry as a specific concern. In this paper, a conceptual model will be proposed to measure the agility level of the petroleum companies based on existing technologies, level of qualifying human resources, production strategies, and organization management systems. Sev-eral case studies will be presented to demonstrate the proposed issues and technique through an agility questionnaire which is used for assessing the agility level of these companies. These studies provide the readers with an insight into the companies and their agility levels.
Keywords: Agility Measurements, Petroleum Companies, Oil Industry
1. Introduction
Oil industry has undergone many evolutionary stages and paradigm shifts in going from a low production (accord-ing to demand and the production itself) to mass produc-tion (due to increasing in market demands and/or to in-crease revenue); then to lean production (to dein-crease and/or control oil prices), to recommended next stage (agile oil production). Business are restructuring and reengineering themselves in response to the challenges and demands of the twenty-first century [1]. The petro-leum companies of the twenty first century will have to overcome the challenges of demanding customers who will seek crude oil quantity with stable oil prices. Petro-leum companies competing primarily based on explora-tion and producexplora-tion zones although oil prices actually competed in the global marketplace. The oil consumption is growing day after day. The average local and interna-tional consumption of oil grew by high percentage com-paring with past consumption.
Agility in petroleum companies is considered as a new
oil industry revolution which it addresses new ways of running petroleum companies to meet these challenges. Agile system (AS) in oil industry is defined as the capa-bility of surviving and prospering in a competitive envi-ronment of continuous and unpredictable change by re-acting quickly and effectively to changing oil fields pro-duction driven by markets demand and instability in oil prices. The AS is also considered as a new expression that is used to represent the ability of a petroleum com-pany to survive and thrive in the face of continuous change. These changes can occur in exploration areas, drilling a well, production strategies, and technology used. Agility in oil industry is neither mass production strategy nor lean production strategy. Nowadays these strategies are not really considered new although they have been available for previous several decades and it should follow a new strategy so called “Agile oil indus-try”.
get-ting higher. There seems to be no end in sight. Now, however, petroleum companies must be able to rapidly develop and produce crude oil to meet customer needs and keep the oil prices stable. These companies are global firms. To explore and produce more oil, several companies are working in the country (e.g., Oman, KSA, etc.). There are technical petroleum services in each country to widen consultancy services. The requirements for economies of scale, based on global marketplace of robust demand, are coming into direct conflict with the requirements for economic growth and oil demand. In the past, economies of scale regarding oil production ruled the oil industry and everybody knew that heavy produc-tion and full utilizaproduc-tion of wells capacity was the way to make money. This style of oil production resulted in fixed wells that could not be easily changed and config-ured. That is, maintaining continuous new technology in exploration, drilling and production while utilizing peo-ple and equipment to cost-effectively exploratory a heavy crude oil. While some developing countries such as China, India and Brazil need fuel to feed their growing economics, members of the organization of petroleum countries (OPEC) says higher prices are not in the group’s interest and threaten recovery although oil prices may hit $100 in 2011 on demand from BRIC nations (Brazil, Russia, India and China) although the global economy’s sluggishness will persist into 2011. The health of global oil demand is extremely robust and that is something expecting to continue into next years.
Agile system does not represent a series of techniques much as it represents a fundamental change in production and/or management philosophies [1]. It is not about small scale improvements but an entirely different way of do-ing business with a primary emphasis flexibility and quick response to the changing markets. However, there is a need for a systemic approach to evaluate and study agility in oil industry. Such as, British petroleum (BP) company has already moved for fast evolution after Gulf Mexico crisis to shake up the organization. They have announced plans to reorganize (reconfigure) the com-pany’s critical exploration and production business and to establish a global safety division with broad auditing and rule setting powers. The BP Company is going to make sure it is among the best in the world at managing risk going forward.
In order to update the level of petroleum companies for competition or oil industry modernization programs, this new concept “agility” should be introduced into these companies. Evaluation of petroleum companies for agility is still the most important issue for the next pe-riod, and it will be highly considered. This will lead to a great change in the traditional company. There will be changes in production strategies such that company will
quickly respond to customer demand with a reasonable price. There will be other changes in some areas such as the following: production support, production planning and control, quality assurance, maintenance, marketing, engineering, human resources, finance, and accounting. These changes will cause a revolution in the petroleum companies such that “agility” is based on compressing the time of production.
This paper focuses on the evaluation of petroleum companies for oil industry modernization considering agility concepts and it is organized into several sections. Section 1 presents the background of agile concepts in petroleum companies. Section 2 reviews previous studies related to measuring agility as a general concept. Analy-sis of petroleum companies regarding agility issues is proposed in Section 3. Section 4 introduces the proposed measurement methodology of agility. In Section 5, case studies are illustrated. Finally, the conclusion and rec-ommendation for future work is given in Section 6.
2. Literature Review
a few questions and the authors suggested the estimation value of agility should be the mean for all questions. They did not use a numerical example or case study to illustrate their approach. Product flexibility can be con-sidered as the agility measure [12].
A novel model to measure agility level of the manu-facturing firms based on existing technologies, level of qualifying people, manufacturing strategies, and man-agement systems and the business process was presented [13]. A suggested analysis for evaluation of industrial enterprises based on new performance criteria complex-ity and agilcomplex-ity was introduced by Garbie [14]. A frame-work for research and development of agile manufactur-ing system by describmanufactur-ing the issues related with agility was discussed [15,16]. The adoption of key strategies, usage of technology organizational issues and human resource development factors were identified as enablers of agility. The phase of management by concentrating on team-based work (team attributes) necessary to facilitate agile manufacturing by the help of framework to balance the work system was highlighted by Yauch [17]. An agil-ity index was measured by an approximate reasoning analogous method taking into account the knowledge included in fuzzy IF-THEN rules [18]. The methodology was based on group of quantitative metrics which uses operational characteristics such as changeover time, product variety, and number of manufacturing routes by focusing on four infrastructures to formulate mathemati-cal model. These were production infrastructure, market infrastructure, people and information infrastructure. A comprehensive questionnaire was presented for monitor-ing various agility factors.
An empirical research was performed for analyzing agility in four production plants belonging to multina-tional companies in Spain: Opel, 3M, John Deere and Airbus [19]. A comparison between firms based on their general characteristic was made by reviewing their pro-duction system (i.e. types of production processes volume and type of products and layout), business environment (i.e. high or medium, level of diversity), organizational structure (functional or customer oriented), and their manufacturing objectives for competitiveness such as, quality, cost delivery and innovation. A framework con-sists of strategic and tactical assessment structures was presented for evaluation of agile workforce based on cross training and their coordination [20]. The literature avail-able on agile manufacturing system and proposed a classi-fication scheme to identify the major areas needed for agility was reviewed [21]. Nine major areas were identi-fied; product and manufacturing system design, process planning, production planning scheduling and control, information systems, material handling storage systems, supply chain, human factors and business practices.
A conceptual framework was proposed for explaining the design, structure, implementation and alignment of supply chain agility based on two elements, product in-formation and behavior/relationship of supply chain [22]. The literature review was studied dealing with the crite-ria for agile manufacturing (AM) system by Ramesh [23]. The meaning and definitions of AM were identified in form of management criteria and technology criteria. A research work reported in literature on agile manufac-turing (AM) and highlighted the phase of information technology was explored (i.e. computer aided designing CAD, computer aided manufacturing CAM, rapid proto-typing RP) as agile characteristic [24]. The possibility of applying finite element analysis (FEA) and CAD/CAM concepts in organization was examined to acquire char-acteristics of AM was examined [25]. For this purpose the component of electronic switch manufacturing com-pany was chosen as the candidate of research. A theoreti-cal analysis was performed for reviewing the concepts of flexibility, agility and responsiveness in operations man-agement literature to clarify the difference between these terms [26]. On the basis of literature review, they consid-ered that the term ‘flexibility’ is most commonly associ-ated with inherent property of systems which allows them to change within pre-established parameters, while the term “agility” described as an approach to organize the production system that allows for fast reconfiguration in the face of unforeseeable changes and that requires resources that are beyond the reach of a single company. The term “responsiveness” was characterized by ac-tion/outcome or behavior of a business that involves de-cisions about how much and when to utilize competen-cies and capabilities to accommodate stimuli.
characteristics of agile companies.
Analysis and measuring the agility level in petroleum companies is considered as a new evaluation and is still an ill-structured problem , and until now, the concepts of agility level is still unclear and unknown not only in most petroleum companies but also in almost all oil industry. The contribution of this paper is to analyze and evaluate the petroleum companies considering agility concepts (issues) for oil industry modernization. These issues can be presented as a framework for analysis and evaluation of petroleum companiesconsidering agility.
3. Analysis of Petroleum Companies for
Agility
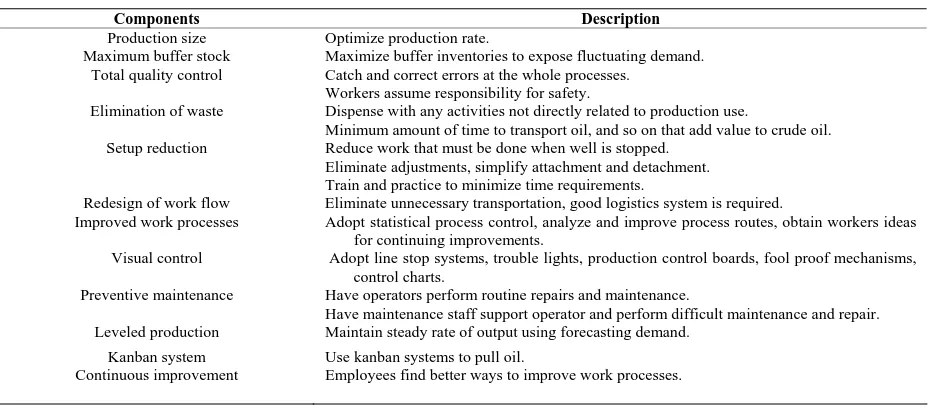
In order to implement the agile concepts and thinking, there will be some components that should be identified. Table 1 includes the components of the agile company. The agile company has been built on some concepts such as the following: trying to decrease time of exploration and drilling, achieving customer’s demand in less time, and minimizing buffer stock [30-32]. These components can be used to the application of agility to the petroleum company and make the company succeed.
Petroleum company’s agility level measurements are still ambiguous and ill-structured because they subjec-tively described assessments and are unsuitable and inef-fective classical techniques. There are six important questions to be asked concerning agility as a general such as the following [13]:
1) How far down the path is a company towards be-coming a business organization?
2) How and to what degree does the organizational at-tributes affect the company’s business performance?
3) How do you measure or evaluate the agility of a company?
4) How can a company improve its agility? 5) Which factors are more important than others? 6) How can companies identify the adverse factors for improving?
Based on the theories behind “agility”, this section suggests four dimensions to focus on agile capabilities (technology, people, production strategies, and organiza-tion management). They are considered to be the pillars of agility. As the overall problem of measurement is lim-ited to the four dimensions, the fundamental questions, what to measure, how to measure it, and how to evaluate the results will be determined. The analysis could be per-formed in an interview survey by quantifying the impor-tance from 1 to 10. This analysis is also proposed from a exploration and drilling, and production perspectives, which mean they have some delimitation by distributing a questionnaire among oil industry experts in different sectors of the company. These questions might not be enough but give an idea of how the company is strug-gling today and give an indication of influences in the future.
[image:4.595.66.531.507.710.2]The research methodology used in this paper is im-plementing a proposed technique based on a question-naire. The purpose is to perform an agility using the questionnaire to identify the current level of performance within the company with respect to the following four dimensions of agility. The aim is to produce a good set of results and from these determine an index (as a percent-age) for where they think or perspective they are at the moment and another index for where they should be with respect to becoming a more agile company.
Table 1. Components of the agile petroleum company.
Components Description
Production size Optimize production rate.
Maximum buffer stock Maximize buffer inventories to expose fluctuating demand. Total quality control Catch and correct errors at the whole processes.
Workers assume responsibility for safety.
Elimination of waste Dispense with any activities not directly related to production use.
Minimum amount of time to transport oil, and so on that add value to crude oil. Setup reduction Reduce work that must be done when well is stopped.
Eliminate adjustments, simplify attachment and detachment. Train and practice to minimize time requirements.
Redesign of work flow Eliminate unnecessary transportation, good logistics system is required.
Improved work processes Adopt statistical process control, analyze and improve process routes, obtain workers ideas for continuing improvements.
Visual control Adopt line stop systems, trouble lights, production control boards, fool proof mechanisms, control charts.
Preventive maintenance Have operators perform routine repairs and maintenance.
Have maintenance staff support operator and perform difficult maintenance and repair. Leveled production Maintain steady rate of output using forecasting demand.
Kanban system Use kanban systems to pull oil.
3.1. Analysis Form of Technology
Technology is the usage and knowledge of tools, tech-niques, crafts, systems or methods of organization. It refers to a collection of techniques. It is the current state of humanity’s knowledge of how to combine resources to produce oil, to solve problems, and fulfill needs. It in-cludes technical methods, skills, processes, techniques, tools and raw materials. It is the practical application of knowledge especially in a particular area and a capability given by the practical application of knowledge. It is often a consequence of science and engineering. Oil and gas are considered among the world’s most important resources. The oil and gas industry plays a critical role in driving the global economy.
The technology plays a very important role in the promotion of a petroleum company. The implementation of new technologies in exploration (seismic reflection, gravity, magnetic, electrical), drilling and transportation was estimated to be the capability with most need to im-prove including the development projects. There are many fundamental reasons to adopt technology to en-hance agility: reduces the exploration time, reduces the oil delivery time to customer, enhances the flexibility in selecting a drill site, and improves understanding and control of the production processes. The real issues are how to find or develop appropriate technology and how to quickly and inexpensively deploy this technology to access to a reservoir up to several kilometers from the drill rig. The main issues in technology concentrate on the following: the latest available modifications, quality of implementation drilling process, applying preventive maintenance of equipments to let machines more reliable, use of mobile rigs (e.g., jackups, semi-submersibles, drill ships) in onshore and offshore (shallow and/or deep wa-ter), ability to implement new exploration and drilling technology, use new material handling system in moving and transporting oil, ability for internal design changes, easy access to information technology throughout proc-esses on the shop floor, and so on.
3.2. Analysis Form of People
The level of education for the workers is a very impor-tant part. The suggested analysis will be introduced to measure the agility level of petroleum companies with regards to people and give an indication of what will influence the petroleum companies in the future. In this analysis, a learning manufacturing firm will be referred to as a learning organization, knowledge organization, center for learning, and total quality learning organiza-tion. Petroleum companies are built on knowledge work-ers. It can be assumed that the next wave of economic growth will come from knowledge-based companies. The
major issues regarding people rely on the degree of quali-fication of the workers starting from job analysis and recruitment, job enlargement, job enrichment, interper-sonal skills and communication, continuous learning and education, improved workforce capability and flexibility, managing culture, conflict and stress, leadership roles, motivation of the workers and employees to attend courses and various training, and so on.
3.3. Analysis Form of Production Strategies
Analysis of production strategies is related to the present and future, but it is developed by examining the past. The production strategies in petroleum companies are involv-ing several major processes: exploration; drillinvolv-ing; devel-opment; production and transportation. Therefore, it is an inherently uncertain process. With respect to exploration, once a promising geological structure has been identi-fied, the presence of hydrocarbons, thickness and internal pressure of a reservoir is to drill exploratory boreholes. A pad for a single exploration occupies between 4000-15000 square meters. When exploratory drilling is suc-cessful, more wells are drilled to determine the size and the extent of the field. The appraisal stage aims to evalu-ate the size and nature of the reservoir (oil field). The number of wells required to exploit the hydrocarbon res-ervoir varies with the size of the resres-ervoir and its geol-ogy. Large oilfields can require a 100 or more wells to be drilled whereas smaller fields may only require ten or so. Additional wells so called injection wells are required to maintain constant production rate.
3.4. Analysis Form of organization Management
Change and uncertainty dominate today’s business envi-ronment. The analysis form of management can be ap-plied through some questions which help us to maintain (or rise) the productivity of any company with high per-formance. These questions include asking about new wells or oilfields, organizing tasks between workers, ganization structure and process used to control the or-ganization management levels, applying technology in management and all infrastructures, and company’s stra-tegic plans.
The assessment questions regarding the above four dimensions are not included due to page limitations but interested readers are welcome to contact the author for copies.
4. The Proposed Fuzzy Mathematical
Approach
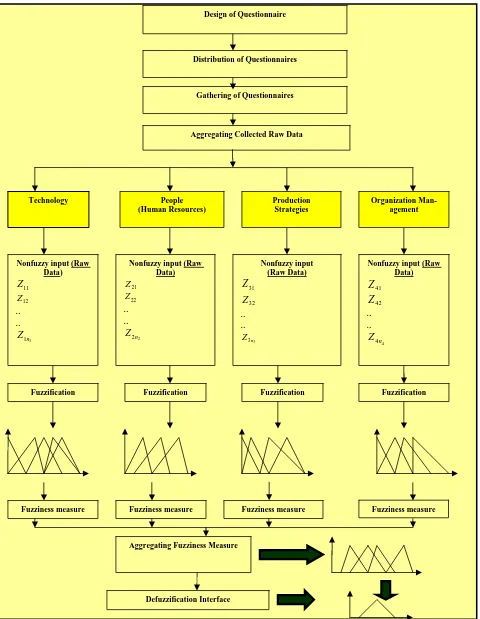
Figure 1. Flow chart of estimating agility level (Garbie et al., 2008).
Technology People
(Human Resources)
Production Strategies
Organization Man-agement
Nonfuzzy input (Raw Data)
21 Z
22
Z
.. ..
2
2n Z
Nonfuzzy input (Raw Data)
31 Z
32
Z .. ..
3
3n
Z
Nonfuzzy input (Raw Data)
41
Z
42
Z .. ..
4
4n Z
Nonfuzzy input (Raw Data)
11 Z
12 Z .. ..
1
1n Z
Aggregating Collected Raw Data Gathering of Questionnaires Distribution of Questionnaires
Design of Questionnaire
Fuzzification Fuzzification Fuzzification Fuzzification
Fuzziness measure Fuzziness measure Fuzziness measure Fuzziness measure
Aggregating Fuzziness Measure
fication interface. The fuzzy mathematical equations will be adopted to combine all frameworks and their corre-sponding parameters to determine the overall agility. This technique was developed by Garbie et al., [13]. All these issues will be explained in the following steps:
Step 1: Questionnaires are designed for each infra-structure including all essential elements.
Step 2: Questionnaires are distributed to specific ex-perts in different departments.
Step 3: Questionnaires containing raw values are gath-ered separately.
Step 4: Raw data are aggregated.
Step 5: Data are divided into the four infrastructures (technology, people, production strategies, and organiza-tion management).
Step 6: The fuzzification interface is used to transform crisp data into fuzzy data using the following equation [33].
ii
Z WV
x
BV WV
(1)
where:Zi = raw value of each attribute or each question (WV <
Z
i < BV)
xi = linear transformation index value (member-ship), BV = best value = 10, WV = worst value = 1
Step 7: The measure of the fuzziness (f) of each infra-structure (e.g., technology (tech)) can be modified and expressed as follows (Equation 2) based on fuzziness measure of an infrastructure [13,33]:
1 2 2 . 1 1 22 ( ) 1
( .) 1
tech n tech i i j tech x f tech n
(2)where: j = status of fuzzy member triangle (pessimistic, optimistic, and most likely), ntech= number of attributes regarding technology infrastructure
Similarly, measuring the fuzziness (f) of people (p), production strategy (p – s), and organization manage-ment (o – m) can be also modified and expressed as the following Equations (3), (4) and (5), respectively:
1 2 2 1 1 22 ( ) 1
( ) 1 p n p i i j p x f p n
(3)
1 2 2 1 1 22 ( ) 1
( ) 1
p s n
p s i i
j
p s x
f p s
n
(4)
1 2 2 1 1 22 ( ) 1
( ) 1
o m
n
o m i i
j
o m
x
f o m
n
(5)where: j = status of fuzzy member triangle (pessimistic, optimistic, and most likely), np= number of attributes regarding people infrastructure, nps= number of attrib-utes regarding production strategies infrastructure, no m = number of attributes regarding organization management infrastructure
Step 8: The aggregate measure (agg.) of the fuzziness (f) for all infrastructures is determined. At this level, the output of the four infrastructures is entered into a global measure for all infrastructures to compute the agility fuzziness index as follows:
12 21
1 2
2 ( ) 1
( . ) 1
infrastructure n infrastructure i i j infrastructure x f agg n
(6)Step 9: Evaluate the defuzzification values using the following equation [35]. The output from Step 8 is a fuzzy membership function for the petroleum company's agility level, which can be defuzzified to yield a non-fuzzy output value (crisp data are needed) from an in-ferred fuzzy output.
2 4
p m o
X (7)
where: p = pessimistic, o = optimistic, m = most likely Step 10: Assess the current agility level (ALcurrent). The output from Step 9 is the current value of the com-pany's agility level.
Step 11: Estimate the agility needs level (ALneed) as follows:
Agility need level = 1– Assessment of current agility level.
1
need current
AL AL (8) All these steps are deeply shown in Figure 1.
5. Case Studies and Implementation
In order to test the proposed analysis measurement pre-sented in the previous section, two case studies were per-formed. The objective of these studies was to analyze agility level according to the proposed analysis and evaluate the proposed methodology. In order to analyze the concept of “agility”, an interview survey was carried out in two petroleum companies in Oman. The results from the case studies will be presented in this section.
5.1. Case study No. 1 (ABC Company)
ser-vice representing in knowledge, technical serser-vices and innovation and teamwork. They have focused on lever-aging these assets to deliver solutions that improve cus-tomer performance. Today, the real-time technology ser-vices and solutions enable customers to translate acquired data into useful information, and then transform this in-formation into knowledge for improved decision mak-ing-anytime, anywhere. Harnessing information tech-nology offers enormous opportunities to enhance effi-ciency and productivity. This is a quantum leap from providing traditional ‘just-in-case’ information to deliv-ering “just-in-time” knowledge that meets the changing needs of customers. ABC Company beliefs diversity spurs creativity, collaboration and understanding customers’ needs. It employs over 105,000 people of more than 140 nationalities working in approximately 80 countries. The employees are committed to working with customers to create the highest level of added value. Knowledge communities and special interest groups with ABC or-ganization enable teamwork and knowledge sharing un-encumbered by geographic boundaries.
There are technology innovations With 25 research and engineering facilities worldwide emphasis on developing innovative technology that adds value for customers. For example, in 2009, ABC Company invested $802 million in research and development (R&D). The ABC Company has principal offices in Paris (France), Houston (USA) and The Hague, from which the executive management team directs all ABC operations worldwide. The ABC Code of Ethics and policies apply to all Company direc-tors, officers, and employees. They are designed to help each employee handle business situations professionally and fairly. One of the greatest strengths is the diversity of workforce, with men and women of many nationalities and backgrounds working together and sharing common objectives. The ABC Company does not have a 'national-ity' which describes its culture, but operates in a truly global fashion throughout the world. The company en-courages fair employment practices worldwide and offer equal opportunities to all employees. The Company tries to take family considerations into account in any decisions about personnel matters or assignments.
As mentioned before, agility audit questionnaires were distributed among departments: exploration, drilling and production department, engineering and research and development department, transportation, marketing de-partment, and oil industry experts. The evaluations from their point of view on the suggested questions for agility dimensions with respect to all infrastructures are shown. It represents agility audit questionnaires based on the four different types of infrastructures and number of questions in each type (technology (29) questions, people (89), production strategies (13), and organization
man-agement (21). First, the fuzzy membership functions of all the basic and high level attributes will be estimated. In order to keep this case simple, fuzzy membership func-tions for all attributes are assumed to be triangular. In this analysis, a transformation process can be used to normalize the alternative values (raw data) in relation to the best and worst values for a particular criterion. As also was discussed previously, BV and WV are assigned by the domain experts. Second, compute the fuzziness measure for each infrastructure individually (technology, people, production strategies, and organization manage-ment). Third, the aggregate measure of fuzziness for all infrastructures will be estimated. The values of individ-ual and aggregate fuzziness are shown in Table 2.
The next step is to determine the appropriate defuzzi-fication value (DV) through the agility aggregate fuzzy membership function (0.5419, 0.7012 and 0.7136) using Equation (7). Then, the defuzzification value is as fol-lows:
0.6675
ABC
DV
The defuzzification value represents the current ABC Company’ agility level (AL).
ABC 0.6675
AL
This means that the capabilities and abilities of the ABC Company to compete in oil market is approxi-mately 66.75% and the level of agility needed to stay in competition is 100% – 66.75% = 33.25%. This value means that the level of oil industry modernization for this company is 33.25 percent to compete. The agility level has a range from 0 to 100%, with a value of 0 or close to 0 indicating the worst possible agility level and a value of 100% or close to 100% indicating the best possible agility level. As was discussed previously, the agility level is based on the technology, people, production strategies, and organization management infrastructures. Each of these infrastructures (i.e., technology, people, production strategies, and management) has also a range from 0 to 100%. Finally, measures of agility in each in-frastructure can be estimated individually. Table 3 shows the current agility level and agility needed for every in-frastructure in ABC Company.
Table 2. Agility levels of ABC Company.
Type of agility Current agility
(%)
Agility needed (%)
Technology 59.67 40.33
People 44.67 55.33
Production Strategies 60.20 39.80 Organization
Man-agement 49.25 50.75
Total ABC agility
level 66.75 33.75
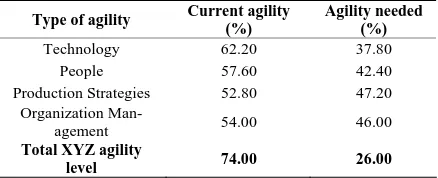
Table 3. Agility level of XYZ Company.
Type of agility Current agility
(%)
Agility needed (%)
Technology 62.20 37.80
People 57.60 42.40
Production Strategies 52.80 47.20 Organization
Man-agement 54.00 46.00
Total XYZ agility
level 74.00 26.00
people which represents the lowest value although people are considered as the most important assets.
5.2. Case study No. 2 (XYZ Company)
XYZ is an international oil and gas exploration and pro-duction company. It is the fourth largest US oil and gas company based on market capitalization of $ 66 billion at year 2009 with nearly 30,000 employees and contractors on four continents. The XYZ engages in oil and natural gas exploration and production in three core regions: the United States, Middle East/North Africa and Latin Amer-ica. It is worldwide leader in applying advanced technol-ogy to boost production from mature oil and nature gas fields and access hard-to-reach reserves. The XYZ Oman operations are concentrated at the giant A1 oil field in south central Oman, the A2 field in northern Oman, and adjacent areas. During its 30 years tenure in Oman, the XYZ has increased production, reserves and scope. To-day the XYZ Company is considered the country's sec-ond largest oil producer.
At A1 oil field, the XYZ has implemented an aggres-sive drilling and development program including a major pattern steam flood project for enhanced oil recovery. As of year 2009, the exit rate of gross daily production was over 10 times higher than the production rate in 2005 when XYZ assumed operation of the field. The XYZ plans to steadily increase production through continued expansion of the team flood project. Table 3 shows the current agility level and agility needed for every infra-structure in XYZ Company.
It can be noticed from Table 3 that the levels of cur-rent agility for production strategies and organization management infrastructures are the lowest ones although
they are still at a medium level. This means that they focused on management rules representing in organiza-tion objectives, organizing tasks and work, company structure, and so on. With respect to technology and peo-ple infrastructures, their values were the highest and they also need more development to increase their capability and competence.
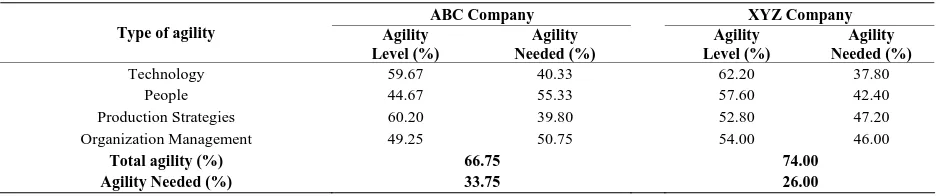
It seems from Table 4 that technology in both compa-nies represents the highest value which includes knowl-edge tools, new techniques, methods and how to combine resources to produce oil. These values (agility of tech-nology) in ABC and XYZ companies are close to equal (59.67% and 62.20%) although ABC Company is used mainly as a service company and the XYZ Company is used for operations. This means technology in petroleum companies or in oil industry is the most important issue.
With respect to people or human resources, it can be noticed that agility level in ABC Company is lower than XYZ Company. This indicates the human resources in XYZ Company are better or more qualifying than the human resources in ABC Company. This will lead to observe that operation companies need more learning and educating people than service companies. Also, with re-spect to production strategies, there is an increasing in agility level in service companies than operation compa-nies representing in exploration, drilling, production, and transportation.
Regarding organization management, the ABC pany (service) has lower agility value than XYZ Com-pany (operation). This means the organization structure in operation companies is more flexible and it has good strategic plans than service companies which are some-times limited or restricted with the region itself. Gener-ally and according to these studied companies and lim-ited with available data, it can be said that the total agil-ity of operation companies is more than total agilagil-ity of service companies. This will lead to confirm the concepts of implementation agility as one of most important pro-duction philosophies which were recommended by Gar-bie [36].
6. Conclusions and Recommendations for
Future Work
[image:9.595.64.283.222.311.2]Table 4. Comparison between ABC Company and XYZ Company.
ABC Company XYZ Company
Type of agility Agility
Level (%)
Agility Needed (%)
Agility Level (%)
Agility Needed (%)
Technology 59.67 40.33 62.20 37.80
People 44.67 55.33 57.60 42.40
Production Strategies 60.20 39.80 52.80 47.20
Organization Management 49.25 50.75 54.00 46.00
Total agility (%) 66.75 74.00
Agility Needed (%) 33.75 26.00
It is recommended that companies address agility is-sues early in evaluating the petroleum companies' levels. Its enablers were identified and the proposed methodol-ogy of measurement was offered to illustrate enablers along with the four infrastructures (technology, people, production strategies, and organization management) of petroleum company agility. Analyzing the huge amount of the collected data is challenging and time consuming. As a consequence of this, a fuzzy logic approach has been described in this study. By measuring the fuzziness of each infrastructure individually, the agility aggregate fuzziness measure and defuzzification value are esti-mated using the proposed approach after modifying some terms to evaluate the petroleum company that is consid-ering agility. The application of the proposed approach is applied to famous two international companies. The re-sults show that the agility level of these companies is at above medium level and still needs more development in different infrastructures to become more competitive. These case studies conducted at Service and Operation Companies was used to add a real industrial perspective. They provided a basis for assessing and discussing the implementation of agile system. Most of petroleum com-panies think that they have a full agility level and they did not require more agility based on buying the latest technologies. This leads not to say that agile system is totally inapplicable.
The contribution of this paper is to introduce a new definition of agile system into petroleum companies (op-eration, service, retail) although this concept still unclear regarding to petroleum companies although they applied most of agile requirements. Also analysis and evaluation of the petroleum companies considering agility concepts (issues) for oil industry modernization is recommended.
For further research, the author plan to apply agility questionnaire in many petroleum companies to valid the proposed approach and discussing deeply which infra-structure is more important than others. Also the author has been planning to use the current agility levels of sev-eral different petroleum companies to introduce a new strategy of reconfiguration and/or reorganizing of the petroleum company to cope with different environments.
7. Acknowledgements
The author would like to acknowledge the financial sup-port provided by the Sultan Qaboos University (Grant No. IG/ENG/MIED/10/01) to carry out this research work.
REFERENCES
[1] A. Gunasekaran, E. Tirtiroglu and V. Wolstencroft, “An Investigation into the Application of Agile Manufacturing in an Aerospace Company,” Technovation, Vol. 22, No. 7, 2002, pp. 405-415.
[2] G. Khashsima, “A Model for Measuring Organizational Agility in Iran Television Manufacturing Industry: A Fuzzy Logic Framework,” IEEE International Engineer-ing Management Conference, New York, 2-4 November 2003, pp. 354-358.
[3] Y. C. Shih and C. T. Lin, “Agility Index of Manufactur-ing Firm - A Fuzzy Logic Based Approach,” IEEE Inter-national Engineering Management Conference, Cambridge, 18-20 August 2002, pp. 445-470.
[4] L. M. Meade and J. Sarkis, “Analyzing Organizational Project Alternatives for Agile Manufacturing Processes: An Analytical Network Approach,” International Journal of Production Research, Vol. 37, No. 2, 1999, pp.
[5] N. C. Tsourveloudis and K. P. Valavanis, “On the Meas-urement of Enterprise Agility,” Journal of Intelligent and Robotic Systems, Vol. 33, No. 3, 2002, pp. 329-342.
[6] M. Jackson and C. Johansson, “An Agility Analysis from a Production System Perspective,” Integrated Manufac-turing Systems, Vol. 14, No. 6, 2003, pp. 482-488.
[7] R. E. Giachetti, L. D. Martinez, O. A. Saenz and C. S. Chen, “Analysis of the Structural Measures of Flexibility and Agility Using a Measurement Theoretical Frame-work,” International Journal of Production Economics, Vol. 86, No. 1, 2003, pp. 47-62.
[8] B. M. Artet and R. E. Giachetti, “A Measure of Agility as the Complexity of the Enterprise System,” Robotics and Computer-Integrated Manufacturing, Vol. 20, No. 6, 2004,
pp. 495-503.
International Journal of Production Economics, Vol. 62, No. 1-2, 1999, pp. 7-22.
[10] H. Sharifi and Z. Zhang, “Agile Manufacturing in Prac-tice-Application of a Methodology,” International Journal of Operations and Production Management, Vol. 21, No. 5-6, 2001, pp. 772-794.
[11] Z. Zhang and H. Sharifi, “A Methodology for Achieving Agility in Manufacturing Organizations,” International Journal of Operations and Production Management, Vol. 20, No. 4, 2000, pp. 496-512.
[12] D. B. Sieger, A. B. Badiru and Mibatovic, M., “A Metric for Agility Measurement in Product Development,” IIE Transactions, Vol. 32, 2000, pp. 637-645.
[13] I. H. Garbie, H. R. Parsaei and H. R. Leep, “A Novel Approach for Measuring Agility in Manufacturing Firms,” International Journal of Computer Applications, Vol. 32, No. 2, 2008, pp. 95-103.
[14] I. H. Garbie, “New Evaluation of Industrial Enterprises,”
Proceedings of ICAMM, Muscat, 13-15 December 2010, pp. 13-15.
[15] A. Gunasekaran, “Agile Manufacturing: A framework for Research and Development,” International Journal of Production Economics, Vol. 62, 1999, pp. 87-105.
[16] A. Gunasekaran, “Design and Implementation of Agile Manufacturing Systems,” International Journal of Eco-nomics, Vol. 62, 1999, pp. 1-6.
[17] C. A. Yauch, “Team-Based Work and Work System Bal-ance in the Context of Agile Manufacturing,” Applied Ergonomics, Vol. 38, 2007, pp. 19-27.
[18] R. C. Kharbanda, “Measurement of Agility in Manufac-turing Systems. A fuzzy Logic Approach,” Proceedings of the World Congress on Engineering, London, 2-4 July 2008.
[19] D. V. Bustelo and L. Avella, “Agile Manufacturing: In-dustrial Case Studies in Spain,” Technovation, Vol. 26, 2006, pp. 1147-1161.
[20] W. J. Hopp and M. P. V. Oyen, “Agile Workforce Eva- luation: A Framework for Cross-Training and Coordina-tion,” IIE Transactions, Vol. 36, No. 10, 2004, pp.
919-940.
[21] L. M. Sanchez and R. Nagi, “A Review of Agile Manu-facturing Systems,” International Journal of Production Research, Vol. 39, No. 16, 2001, pp. 3561-3600.
[22] H. Sharifi, H.S. Ismail and I. Reid, “Achieving Agility in Supply Chain through Simultaneous Design Of and De-sign For Supply Chain,” Journal of Manufacturing Tech-nology Management, Vol. 17, No. 8, 2006, pp. 1078-1098.
[23] G. Ramesh, “Literature Review on the Agile Manufac-turing Criteria,” Journal of Manufacturing Technology Management, Vol. 18, No. 2, 2007, pp. 182-201.
[24] S. Vinodh, G. Sundararaj and S. R. Devadasan, “Total Agile Design System Model via Literature Exploration,”
Industrial Management and Data Systems, Vol. 109, No.
4, 2009, pp. 570-588.
[25] S. Vinodh, G. Sundararaj, S. R. Devadasan, D. Kuttalin-gam and D. RajanayaKuttalin-gam, “Achieving Agility in Manu-facturing through Finite Element Mould Analysis,”
Journal of Manufacturing Technology Management, Vol. 21, No. 5, 2010, pp. 604-623.
[26] E. S. Bernardes and M. D. Hanna, “A Theoretical Review of Flexibility, Agility and Responsiveness in the Opera-tions Management Literature: Towards a Conceptual Definition of Customer Responsiveness,” International Journal of Operations and Production Management, Vol. 29, No. 1, 2009, pp. 30-53.
[27] E. O. Adeleye and Y. Y. Yusuf, “Towards Agile Manu-facturing: Models of Competition and Performance Out-comes,” International Journal Agile Systems and Man-agement, Vol. 1, No. 1, 2006, pp. 93-110.
[28] S. Vinodh, G. Sundararaj, S. R. Devadasan, R. Maharaja, D. Rajanayagam and S. K. Goyal, “DESSAC: A Decision Support System for Quantifying and Analyzing Agility,”
International Journal of Production Research, Vol. 46, No. 23, 2008, pp. 6759-6780.
[29] E. Bottani, “Profile and Enablers of Agile Companies: An Empirical Investigation,” International Journal of Pro-duction Economics, Vol. 125, No. 2, 2010, pp. 251-261.
[30] B. H. Maskell, “Software and the Agile Manufacturer - Computer Systems and World Class Manufacturing,” Productivity Press, Portland, 1994.
[31] J. C. Montgeomery and L. O. Levine, “The Transition to Agile Manufacturing Staying Flexible for Competitive Advantage,” ASQC Quality Press, Milwaukee, 1996. [32] J. D. Oleson, “Pathways to Agility-Mass Customization
in Action,” John Wiley & Sons, Hoboken, 1998.
[33] J. H. Paek, Y. W. Lee and T. R. Napier, “Selection of Design/Build Proposal Using Fuzzy-Logic System,”
Journal of Construction Engineering and Management, Vol. 118, 1992, pp. 354-358.
[34] H. J. Zimmermann, “Fuzzy Set Theory and Its Applica-tions,” 2nd Edition, Kluwer Academic Publishers, Bos-ton, 1991.
[35] E. S. Lee and R. L. Li, “Comparison of Fuzzy Numbers Based on the Probability Measure of Fuzzy Events,”
Computer and Mathematics with Applications, Vol. 15,
1988, pp. 887-896.
(GEC),” Journal of Service Science and Management, Vol. 3, No. 4, 2010, pp. 419-428.