STUDY OF CORRELATION BETWEEN PLANTER ARCH INDEX AND BMI IN YOUNG ADULTS
1,*
Kunika K Jaiswal,
1
BPT, MPT Cardiorespiratory Sciences, SPB
2,3BPT,
ARTICLE INFO ABSTRACT
Background:
rigid lever during gait propulsion. The assessment of plantar arch development, by the relationship between arch region width and heel region width obtained on a footp
Staheli young adults
according to age group i.e, 20
with the help of Staheli’s PLANTER ARCH INDEX. The footprint was taken and A value (Width of central region of footprint) and B value (Width of heel region of footprint) were calculated and both value were correlated and result was found. The study design was Correlation. The statistical analysis was Pearson’s Corelation.
their BMI was calculated. According to Pearsons’s Cor
value of left side (0.43) suggest that there is a positive correlation.
index is easy to obtain from footprints and that there are no differences in Right and Left Side. There is a significant correlation between plantar arch index and BMI. This may lead to long term flat feet due to changes in arches especially medial longitudinal arch. There is no difference in right side and left side to BMI. Both are correlating with BMI.
Copyright © 2018, Kunika K Jaiswal et al. This is an open use, distribution, and reproduction in any medium, provided
INTRODUCTION
The foot and ankle form a complex system which consists of 28 bones, 33 joints, 112 ligaments, controlled by 13 extrinsic and 21 intrinsic muscles. It functions as a rigid structure for weight bearing and it can also function as a flexible structure to conform to uneven terrain and supporting body weight, providing balance, shock absorption, transferring ground reaction forces, compensating for proximal malalignment, and substituting hand function in individuals with upper extremity amputation/paralysis (Houglum et al., 2012
foot provide functions of force absorption, base of support and acts as a rigid lever during gait propulsion.
longitudinal arch, lateral longitudinal arch and are the 3 arches that compromises arches of foot.
supported by the plantar aponeurosis, by the small muscles in the sole of the foot, by the tendons of
*Corresponding author: Kunika K Jaiswal,
BPT, MPT Cardiorespiratory Sciences, SPB Physiotherapy College Surat, Dr D. Y. Patil College, Pune.
DOI: https://doi.org/10.24941/ijcr.31778.08.2018
ISSN: 0975-833X
Article History: Received 14th May, 2018 Received in revised form 16th June, 2018
Accepted 27th July, 2018 Published online 31st August, 2018
Citation: Kunika K Jaiswal, Viddhi Patel and Komal Nagekar
International Journal of Current Research, 10, (08), 72948
Key Words: Body Mass Index, Plantar arch Index, Flat Foot.
RESEARCH ARTICLE
STUDY OF CORRELATION BETWEEN PLANTER ARCH INDEX AND BMI IN YOUNG ADULTS
Jaiswal,
2Viddhi Patel and
3Komal Nagekar
BPT, MPT Cardiorespiratory Sciences, SPB Physiotherapy College Surat, Dr D. Y. Patil College, Pune
BPT, SPB Physiotherapy College Surat
ABSTRACT
Background: The arches of foot provide functions of force absorption, base of support and acts as a rigid lever during gait propulsion. The assessment of plantar arch development, by the relationship between arch region width and heel region width obtained on a footp
Staheli‟s. Objectives: The purpose of study the correlation between Planter Arch Index and BMI in young adults. Methods: All 30 participants were given informed consent and were assessed according to age group i.e, 20-25 years. The BMI was calculated and planter arch index was taken with the help of Staheli’s PLANTER ARCH INDEX. The footprint was taken and A value (Width of central region of footprint) and B value (Width of heel region of footprint) were calculated and both lue were correlated and result was found. The study design was Correlation. The statistical analysis was Pearson’s Corelation. Results: All subject were assess with the steheli’s planter arch index and their BMI was calculated. According to Pearsons’s Correlation, the r value of right side (0.36) and r value of left side (0.43) suggest that there is a positive correlation.
index is easy to obtain from footprints and that there are no differences in Right and Left Side. There a significant correlation between plantar arch index and BMI. This may lead to long term flat feet due to changes in arches especially medial longitudinal arch. There is no difference in right side and left side to BMI. Both are correlating with BMI.
open access article distributed under the Creative Commons Attribution provided the original work is properly cited.
The foot and ankle form a complex system which consists of 28 bones, 33 joints, 112 ligaments, controlled by 13 extrinsic and 21 intrinsic muscles. It functions as a rigid structure for it can also function as a flexible structure to conform to uneven terrain and supporting body weight, providing balance, shock absorption, transferring ground reaction forces, compensating for proximal malalignment, and iduals with upper extremity 2012). The arches of foot provide functions of force absorption, base of support and acts as a rigid lever during gait propulsion. The medial longitudinal arch, lateral longitudinal arch and transverse arch are the 3 arches that compromises arches of foot. The arch is plantar aponeurosis, by the small muscles
BPT, MPT Cardiorespiratory Sciences, SPB Physiotherapy College
.08.2018
the Tibialis anterior and posterior and Peroneus longus, and by the ligaments of all the articulations involved
Gray, 1821-1865). Peroneus longus tendon plays an im role in maintaining the lateral border of the arch
1821-1865). The medial and lateral pillar of the arch is formed by medial and lateral longitudinal arch respectively. The arch is maintained by posterior tibialis tendon and peroneus l tendon which cross the plantar surface from medial to lateral and lateral to medial respectively
There are two deformities ’flat feet’ and ‘pes cavus’.
is an alteration of the longitudinal and transverse arch of the foot, which determines an increased footprint on the ground involves multiple joints and can cause forefoot pathologies. The pes planus commonly known as flat feet or arches is a medical condition in which the arc showing the length of the leg is flattened outwards or downwards. Flat feet may affect one of the legs or both, and not only increases the amount of leg that acts on the leg structure, but also interferes with normal foot function. As a result, those with a flat foot experience upsetting during periods of prolonged time (Cavangah, 1987).
International Journal of Current Research
Vol. 10, Issue, 08, pp.72948-72953, August, 2018
Jaiswal, Viddhi Patel and Komal Nagekar. 2018. “Study of correlation between planter arch index and 72948-72953.
Available online at http://www.journalcra.com
z
STUDY OF CORRELATION BETWEEN PLANTER ARCH INDEX AND BMI IN YOUNG ADULTS
Komal Nagekar
Physiotherapy College Surat, Dr D. Y. Patil College, Pune
The arches of foot provide functions of force absorption, base of support and acts as a rigid lever during gait propulsion. The assessment of plantar arch development, by the relationship between arch region width and heel region width obtained on a footprint, is proposed by Engel and correlation between Planter Arch Index and BMI in All 30 participants were given informed consent and were assessed s. The BMI was calculated and planter arch index was taken with the help of Staheli’s PLANTER ARCH INDEX. The footprint was taken and A value (Width of central region of footprint) and B value (Width of heel region of footprint) were calculated and both lue were correlated and result was found. The study design was Correlation. The statistical analysis All subject were assess with the steheli’s planter arch index and relation, the r value of right side (0.36) and r value of left side (0.43) suggest that there is a positive correlation. Conclusion: The plantar arch index is easy to obtain from footprints and that there are no differences in Right and Left Side. There a significant correlation between plantar arch index and BMI. This may lead to long term flat feet due to changes in arches especially medial longitudinal arch. There is no difference in right side and
ribution License, which permits unrestricted
and posterior and Peroneus longus, and by the ligaments of all the articulations involved (Henry Peroneus longus tendon plays an important role in maintaining the lateral border of the arch (Henry Gray, The medial and lateral pillar of the arch is formed by medial and lateral longitudinal arch respectively. The arch is maintained by posterior tibialis tendon and peroneus longus tendon which cross the plantar surface from medial to lateral and lateral to medial respectively (Henry Gray, 1821-1865).
There are two deformities ’flat feet’ and ‘pes cavus’. Flat feet is an alteration of the longitudinal and transverse arch of the foot, which determines an increased footprint on the ground, it involves multiple joints and can cause forefoot pathologies. The pes planus commonly known as flat feet or arches is a medical condition in which the arc showing the length of the ttened outwards or downwards. Flat feet may affect one of the legs or both, and not only increases the amount of leg that acts on the leg structure, but also interferes with normal foot function. As a result, those with a flat foot ring periods of prolonged time
INTERNATIONAL JOURNAL OF CURRENT RESEARCH
The symptoms of the flat foot include softness of the palm of the foot, collapse of the ligaments, rapid fatigue of the leg, pain with pressure and instability of the middle structure of the feet (Queen et al., 2007). Flexible flatfoot function normally. Most children are born with very little arch in the feet. As they grow and walk, the soft tissues along the bottom of the feet tighten, which gradually shapes the arches of the feet (Messier, 1988). Arch Index -As a sensitive podographic indicator was later on confirmed in different studies (Staheli et al., 1987). It has been established the Arch Index, derived from footprint to show a significant negative correlation with the navicular height (Maheshwari, 1997). Arch index also varies with age, falling into the normal adult range by age 5 year. Whether among obese or non-obese people, school-aged children or adults, or men or women from different countries, arch index values fall into the different ranges of arch index values suggested and used as a potential method to classify high-arched, normal, and low-arched foot types. An arch index of less than 0.21 has been said to be indicative of a cavus foot, while if greater than 0.26 is indicative of planus foot whereas Arch Index between 0.21~0.26 corroborates normal arch height.
Reliability of these measurements in classifying foot type has not been investigated. Arch index values, based on the contact area of the middle section of the plantar footprint, have been used to determine foot type. Arch index values calculated by footprint analysis have been obtained from force plate. The high arched cavus foot has been associated with low back facet syndrome and knee pain, while the low arched planus foot has been linked with pathological including Moron‟s neuroma, plantar fasciitis, hallux abductor valgus, chrondomalcia patella and shin splints (Daneshmandi et al., 2003). The assessment of plantar arch development, by the relationship between arch region width and heel region width obtained on a footprint, is proposed by Engel and Staheli‟s. This relationship is greatly reduced up to 4 years old, and the standard deviation through this age group is very high, showing a large variation at the initial foot arch development. The longitudinal arch during childhood shows a wide variation, and, from 4 years old on, this relationship remains at about 0.75 in average If PAI is greater than 1.15, then it is considered as flat foot. PAI = A/B Plantar arch index = A/B
A - Width of central region of footprint.
B - Width of heel region of footprint.
In normal feet with presence of an arch, the stress will be distributed in an even manner so that the person will not experience any kind of pain. Under an abnormal condition that occurs due to lack of stretching of muscles, bones and tendons, there will be absence of arch among these people. In this condition, all the weight will be concentrated in smaller area on the feet and generates a lot more pain than normal (Singrolay, 2016). Body Mass Index (BMI) is an indicator of functional and easily estimated relative weight and is largely linked to most direct obesity measures. The BMI depends to a large extent on the physical composition. BMI is a tool for evaluating healthy body weight. BMI is calculated by measuring the ratio of individual weight to height squared and is used to determine obesity and overweight. Several reports have shown that overweight and obesity may affect foot structure in children and adults (Dowling et al., 2001; Daneshmandi et al., 2003)
BMI = Weight/(Height)2
Main contributing factors for the increase in body mass index is sedentary lifestyle, foods in high fat and calories. Stress is also an important factor for obesity. Growing older, this can lead to less muscle mass and a lower metabolism making it easier to gain weight. Body mass index is used differently for children. It is calculated the same way as for adults, but then compared to typical values for other children of the same age. The Body mass index is generally used as a mean of correlation between groups related by genera mass and can serve as a vague means of estimating adiposity (Gardner, 1989).Thus in the study we are going to conclude correlation between Plantar Arch Index and BMI.
MATERIALS AND METHODOS
Materials
Pen, Pencil, Book, Scale
Blank Paper
Ink
Weighing Machine
Stadiometer.
The Study Group of 30 Normal young individual of age group 20-25 years.
Inclusion Criteria
Subject having age criteria of 20-25 years.
Willing to participate.
Exclusion Criteria
History of Trauma fracture of lower limb and pelvic.
Presence of open wound on foot
Recent injury.
METHODOLOGY
Procedure: Firstly, inform consent was taken from the
Figure 1. Normal foot lateral view
[image:3.595.40.289.55.417.2]Figure 2. Lateral and Medial arch of foot
Figure 3. Deformities of the foot
Figure 4. Presentation of BMI classification
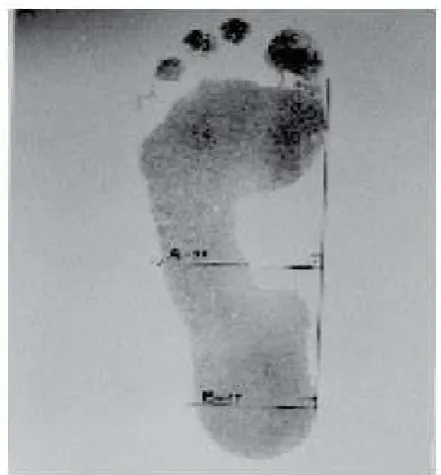
[image:3.595.318.549.342.603.2]We requested the young adult to stand up and perform a small flexion of the ipsilateral knee (about 30º), with the aid of the investigator and, then, to go back to the initial position, removing the foot from the platform. The investigator control foot position on the platform so as to prevent foot slip, a fact that would invalidate the test, which should show a clear footprint. Calculation of the Plantar Arch Index was done. It establishes a relationship between central and posterior regions of the footprint, and it is calculated as follows: a line is drawn tangent to the medial forefoot edge and at heel region. The mean point of this line is calculated from this point, a perpendicular line is drawn crossing the footprint. The same procedure is repeated for heel tangency point. Thereby, they are marked as support width of the central region to the foot (A) and of the heel region (B) in millimeters.
Figure 5: Measurement of the width of the central region (A) and heel region (B) of the foot, in millimetres, on footprint. The plantar arch index is obtained by dividing A value by B value
Figure 6. Measurement of the width of the central region (A) and heel region (B) of the foot, in millimetres, on footprint. The plantar arch index is obtained by dividing A value by B value.
The plantar arch index (PI) is obtained by dividing the A value by B value (PI = A/B).
RESULTS AND STATISTICAL ANALYSIS
For the analysis, data were obtained using Staheli‟s arch index and BMI. The analysis was done using SPSS software and Pearson’s correlation co-efficient (r) was calculated, the values obtained were r= (0.363) right feet and (0.432) left feet and P value for right feet (0.049) and left feet (0.017) was found out. Their values showed positive correlation between both BMI and Staheli’s arch index.
[image:3.595.44.280.423.602.2]Table 1. Classification of BMI
[image:4.595.35.290.261.455.2]The Table 2. and Graph 1 shows the values of the no. of student in age group of 20-25 years having different BMI classification.
Table 2. No. of Subjects in Underweight, Normal and Overweight
No of student.
Underweight 8
Normal 21
Overweight 1
[image:4.595.308.561.298.470.2]Graph 1. Graphical presentation of no. of student in underweight, normal and overweight
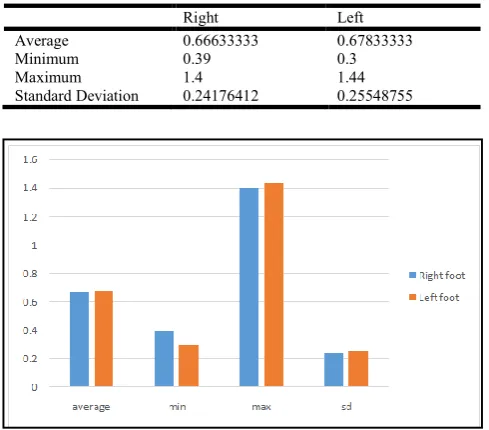
Table 3. Values for Average, minimum, maximum, and standard deviation of the measurement of the central region of arch (A) and heel (B) on footprint, and of the plantar arch index (PI) for
the right and left foot
Right Left
Average 0.66633333 0.67833333
Minimum 0.39 0.3
Maximum 1.4 1.44
Standard Deviation 0.24176412 0.25548755
Graph 2. Graphical representation of Average, Minimum, Maximum and Standard Deviation of Right Foot and Left Foot
Table 4 shows correlation value i.e, pearsons correlation of right side and left side with BMI and P values for the same which signifies that there is correlation between right side and left side and BMI with values r (Right)=0.363 , r (Left)=0.432 respectively.
Table 4. Correlation value(r), P value and significant level of right feet and left feet.
Correlation value(r) P value Significant level
Rt. Feet 0.363* 0.049 Significant
Lt. feet 0.432* 0.017 Significant
*Correlation is significant at the 0.05 level (2-tailed) Observation shows that correlation between BMI and planter arch index PI is significant for both the sides with correlation value 0.36 for right side and 0.43 for left side and p<0.05 for both the side.
Graph 3 and Graph 4 represents scatter diagram of correlation of Right side with BMI and correlation of Left side with BMI respectively. There is positive correlation between Planter Arch Index and BMI.
Graph 3. Garphical representation of correlation between BMI and RIGHT SIDE PLANTER ARCH INDEX
Graph 4. Graphical representation of correlation between BMI and LEFT SIDE PLANTER ARCH INDEX
DISCUSSION
[image:4.595.311.556.496.675.2] [image:4.595.41.286.552.767.2]machine. BMI were calculated by weight (kg) /Height (meter)2. In this study we calculated PI (planter index) by using Staheli`s planter arch index method and correlation of PI and BMI was done. The foot has two functions: to be a strong and stable support for the body, and the lever to ambulation. This double function makes feet to present a unique behaviour during ambulation, when it is submitted to a successive load and unload cycle. The deformation experienced by the medial longitudinal arch during support makes feet to be the region suffering the highest variations in a human body. So, as the weight of the human body increases the biomechanical changes takes place and it can lead to flat feet. The conclusion can be related to the fact that ambulation and arch of the feet which changed can lead to flat feet.
Similarly, the orthopaedic examination served to recognize disorders that are known to change feet consistency. The identification of congenital problems, particularly involving the feet postural abnormalities of the spine, pelvis, hips and knees Achilles Tendon shortening and restraint to subtalar joint movements are essential for ruling out the possibility of secondary flat feet. In previous study, Pranali .V. Gaikwad and Dr. Shyam .D. Ganvir conducted the study of PREVALENCE OF FLAT FEET IN SCHOOL GOING BOYS AND GIRLS IN AHMEDNAGAR DISTRICT. This study suggests that there is a significant association between flat foot and age. Prevalence of flat foot decreases with advancing age. From the result it is concluded that Flat foot is highly prevalent in the ages between 9-15 years. Similarly from the present study we concluded that it is also common among the age group of 20-25 years. In one study done by D.Krupa Daniel et al A STUDY ON PREVALENCE OF FLAT FEET AMONG SCHOOL CHILDREN IN KANCHIPURAM POPULATION. The study shows that Flat foot is highly prevalent in the ages between 5-9. In our study there were 30 subjects out of them 8 subjects were under weight, 21 were normal and 1 was overweight. Thus, through conclusion of the study it suggested that, when mass increases then there is increased static and dynamic plantar pressures, causing significant change to the structure of the foot. However, long-term mass increases associated with obesity appeared to flatten the medial longitudinal arch of the subjects as confirmed by an increased area of foot contact with the ground. Although obesity and overweight is a temporary, but it can be the cause of flatfoot. Therefore subjects should pay attention to increasing weight that may cause flatfoot and also other problems in the future.
Conclusion
In our study, we concluded that there is a significant correlation between plantar arch index and BMI. This may lead to long term flat feet due to changes in arches especially medial longitudinal arch. There is no difference in right side and left side to BMI. Both are correlating with BMI.
REFERENCES
Anton Tudor, Lana Ruzic et al. 2009. Flat-Footedness Is Not a Disadvantage for Athletic Performance in Children Aged 11 to 15 Years 123:386–392.
Arnaldo Jose Hernandez, Luiz Koichi Kimura et al. 2007. Prevalence of flat feet: a study with 100 children aged 5-9 years; 15(2):68-71.
Ashwini Chougala, Vidit Phanse et al. 2015. Screening of body mass index and functional flatfoot in adult 2015,3 (3):1037-41.
Bertani A., Cappello A., Benedetti, MG., Simoncini, L., Catani, F. 1999. Flat foot functional evaluation using pattern recognition of ground reaction data. Clinical
Biomechanics, 14: 484–493.
Cavangah PR. and Rodgers MM. 1987. The arch index: An useful measure from footprint. J Biomechanics., 20: 547-51. 13.
Daneshmandi H, Rahnema N, Mehdizadeh R. 2003. Relationship between obesity and flatfoot in high school boys and children. Int J Sports Sci Eng., 3:43-49.
Daneshmandi H., Rahnema N., Mehdizadeh R. 2003. Relationship between obesity and flatfoot in high school boys and children. Int J Sports Sci Eng., 3:43-49.
Dowling AM, Steel JR, Baur LA. 2001. Does obesity influence foot structure and plantar pressure patterns in prepubescent children? Int J Obese., 25: 845-852.
Dr Jaya Shanker Tedla Ph.D,Vijaya Kumar K et al. 2014. Normative Data for Foot Posture Index (FPI-6) and Association of Foot Posture with Anthropometric Parameters in School Children from Mangalore 2(3):107-15.
Feridun Cilli, M.D. et al. 2013. Oscan Pelican et al Prevalence of flatfoot in Turkish male adolescents 2009; 20 (2):90-92. Gianmarco Troiano, Nicola Nante et al. 2017. Pes planus and
pes cavus in Southern Italy 53(2): 142-145.
Henry Gray (1821–1865). Anatomy of the Human Body. 1918. Hironmoy Roy, Kalyan Bhattacharya et al. 2012. Arch Index:
An Easier Approach for Arch Height, 5 (2) :137 -146. Houglum PA, Bertoti DB. 2012. Brunnstrom's clinical
kinesiology. FA Davis.
Imran Amjad,Mansoor Ali et al Prevalence of the flat foot in 6-10 years old school going children; 38(4):385-387. Jairo Andre de Oliveira Alves et al. 2014. Height of the foot
longitudinal arch and anterior cruciate ligament injuries; 22(6):312-314.
Johanna Elsabe de Villiers Foot metrics and shoe fit in South African school-aged children and adolescents 2014;6(1), 27–39.
Karen J. Mickle, Julie R. Steele, PhD et al. 2008. Is the Foot Structure of Preschool Children, 28:593-596.
M.J. Gardner. And D.G. 1989. Altman. Statistics with confidence. British Medical Association: London.
Maheshwari. J. 1997. Essential orthopaedics 2nd edition. Page number 275-276.
Messier SP, Pittala KA. 1988. Etiologic factors associated with selected running injuries. Medicine & Science in Sports & Exercise 20, 501-509-8566-1365-.
Mohamad Amin Pourhoseingholi et al Comparison of Arch Index of Flat Foot and Healthy Foot in Pre-school Children 2013; 2(3): 15-18.
Pranali, V. Gaikwad et al. 2017. Prevalence of flat feet in school going boys and girls in ahmednagar district;6 (7); 2250-1991.
Pranati, T, K. Yuvraj Babu et al. 2017. Assessment of Plantar Arch Index and Prevalence of Flat Feet among South Indian Adolescent Population, 9(4), 490-492.
Queen RM, Mall NA, Hardaker WM. and Nunley JA. 2007. Describing the Medial longitudinal arch using foot print indices and a clinical grading system. Foot Ankle Int. 28(4): 456-62.
Rajendra Singrolay et al. 2015. Study of correlation between planter arch index and BMI. ISRO Journal of Dental and
Medical Sciences, 14(7):83-86.
Singrolay, Rajendra, and Rajendra Singh Kasha. 2016. "Staheli‟s plantar arch index measured by simple footprint method is an effective diagnostic tool for flat foot as other radiological methods-A comparative study." International
Journal of Scientific Research 4.9.
Staheli LT, Chew DE, Corbett M. 1987. The longitudinal arch.
J Bone Joint SurgAm., 69:426-8.