correction of holographic atom traps
Graham D Bruce, Matthew Y H Johnson, Edward Cormack, David A W Richards, James Mayoh and Donatella Cassettari
Scottish Universities Physics Alliance, School of Physics and Astronomy, University of St Andrews, St Andrews, Fife KY16 9SS, UK
E-mail: [email protected],[email protected]
Abstract. We show that a phase-only spatial light modulator can be used to generate non-trivial light distributions suitable for trapping ultracold atoms, when the hologram calculation is included within a simple and robust feedback loop that corrects for imperfect device response and optical aberrations. This correction reduces the discrepancy between target and experimental light distribution to the level of a few percent (RMS error). We prove the generality of this algorithm by applying it to a variety of target light distributions of relevance for cold atomic physics.
Keywords: Ultracold atoms, optical trapping, aberration compensation, computer generated holography
PACS numbers: 37.10.Gh Atom traps and guides ; 42.40.Jv Computer-generated holograms ; 42.40.Lx Diffraction efficiency, resolution, and other hologram characteristics
A recent area of interest in the field of cold atomic physics is the development of non-trivial spatially-and temporally-varying optical trapping geometries, with interesting examples already demonstrated using techniques including acousto-optic deflection [1–4], amplitude-modulation [5, 6] and phase-modulation [6– 15] of trapping light. Optical traps generally offer increased trap complexity at small length-scales, but at the disadvantage of increased likelihood of small-scale potential roughness [16]. Any local roughness in the intensity of the light pattern creates a varying energy landscape, which could cause heating or fragmentation of the atom cloud [17].
[image:2.612.320.546.56.309.2]Fourier-engineered optical traps (those based on phase-only spatial modulation of the light to tailor the intensity in the Fourier plane of an optical system) have predominantly taken the form of arrays of discrete traps [8, 9] or Laguerre-Gauss beams [10]. Recently, a new calculation method for phase-only holograms of arbitrary complexity directly addressed the issue of roughness. This algorithm, the Mixed-Region Amplitude Freedom (MRAF) [16] variant of the Gerchberg–Saxton iterative Fourier transform algorithm [18], calculates smooth and accurate light patterns for use as optical atom traps. However, other than in special cases [12], the output of this algorithm does not give high-quality optical traps when applied to real devices and must be further adjusted [11, 13, 14]. We present a simple, robust and generally-applicable algorithm to improve the accuracy of optical traps generated by phase-only spatial light modulators (SLMs).
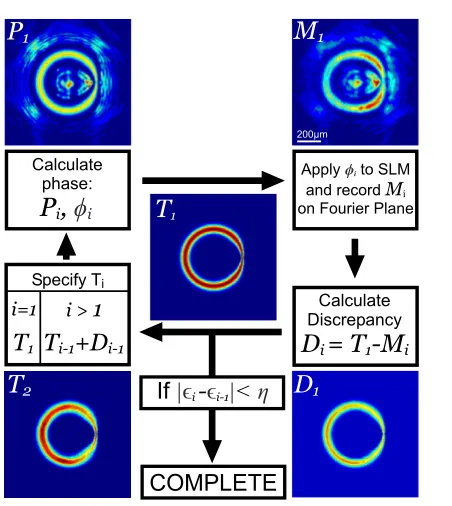
The phase modulation required to produce the optical traps is initially calculated using the MRAF algorithm. For a given target intensity T1 in the Fourier (i.e. output) plane, this algorithm iteratively optimizes a proposed phase-only hologram by emphasising accuracy of the electric-field amplitude within a subset of the output plane (known as the Signal Region). The target amplitude √T1 should contain the pattern of interest plus a surrounding area with zero amplitude. The amplitude is unconstrained in the remainder of the output plane (the Noise Region). The zero-amplitude region between the target pattern and the unconstrained amplitude ensures that atoms trapped in the Signal Region cannot tunnel into whatever intensity distribution is generated in the Noise Region. Calculations of trap quality are performed considering only non-zero pixels within the
Figure 1. Block diagram outlining the basic principle of the feedback algorithm, showcasing the example of a ring trap with a restriction.
Signal Region (a subset known as the Measure Region, which contains the target). Upon stagnation of the MRAF routine, the algorithm returns an optimized phase pattern φ1 on the SLM plane and a predicted intensityP1, which closely resemblesT1, on the output plane.
Our apparatus for the production of red–detuned optical traps where atoms will be trapped in intensity maxima has been previously introduced in Refs [11,12]. A 1064 nm laser beam illuminates the full active area of an SLM. Each of the 256×256 pixels can impart 256 phase levels between 0 and 2π on the light, which is then focussed by af = 100 mm achromatic doublet. The focal plane of the lens constitutes the Fourier plane, which is imaged using a CCD camera.
Signal Region towards the initial targetT1, as shown in figure 1. The error signal for this feedback loop is the discrepancy Di, which is quantified within the
Measure Region asDi= ˜T1−M˜i, whereidenotes the
iteration number and the tilde signifies normalisation. We normalize by the mean value of all pixels in the output brighter than 50% of the maximum target value. We choose this normalization as it is resistant to both low-level background noise and particularly bright, single-pixel, noise. A corrected target pattern
˜
Ti+1= ˜Ti+Diis then generated which compensates for the discrepancies. This new target serves as the input for another iteration of MRAF, and generates a new phase φi+1. The whole process is repeated until the output pattern reaches a stagnation point, defined to be after three subsequent iterations of feedback which improve the root mean square (RMS) error i by less
than a set tolerance value η, i.e. when|i−i−1|< η for three subsequent values of i. For the examples below we have set η = 0.01%. The algorithm is sufficiently robust that successful pattern production does not require pre-calculated wavefront corrections, such as those provided by the SLM manufacturer or acquired using a Shack-Hartmann wavefront sensor.
In practice we have found that increased accuracy can be achieved by introducing a gain parameterαto the feedback loop which is scheduled such thatα >0.5 for initial iterations to correct for large discrepancies and can be decreased as the improvement between iterations stagnates in order to impart more finely-tuned corrections. Thus, ˜Ti+1becomes ˜Ti+1= ˜Ti+αDi
where αis empirically optimized and typically ranges from 0.3 to 0.6 for later iterations depending on the pattern.
We test the feedback algorithm on a variety of patterns of interest, including a ring with a restriction, a Gaussian double-well and various arrays of discrete spots. A summary of the improvements to these optical traps due to the feedback process, along with the number of iterations required (ι) and the light-usage efficiency (Γ), can be found in table 1. After few iterations of the feedback loop, the measured light profiles shown in figure 2 (continuous light patterns) and figure 3 (discrete spot patterns) show increased accuracy and more closely resemble their target patterns.
As an evaluation metric we use the RMS error,
i= s
1
NMR X
MR
˜
Mi−Ti˜ 2
, (1)
[image:3.612.319.532.74.534.2]where NMR denotes the number of pixels in the measure region. In real optical traps, atoms at temperatures higher than 10% of the trap depth will quickly evaporate from the trap [20]. Following this, we also include the RMS error (10%) of only those
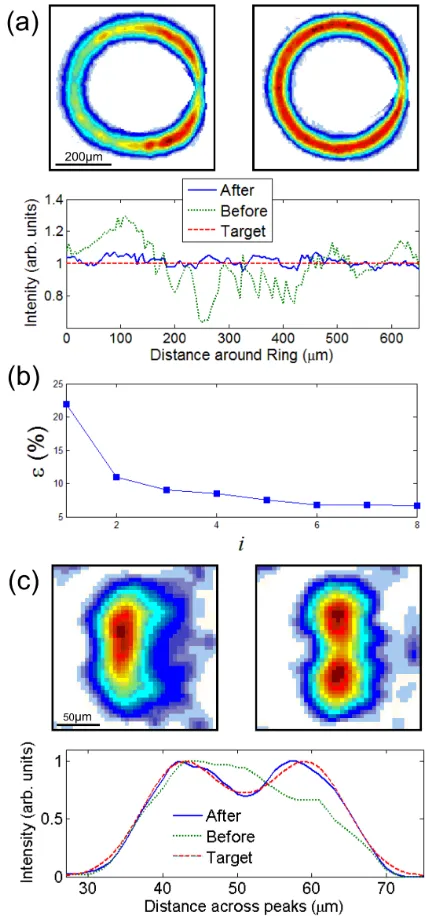
Figure 2. Continuous patterns optimized by feedback. (a) A ring pattern with a Gaussian radial distribution and a restriction (as in figure 1), showing the measured Signal Region intensity using the initial MRAF-calculated phase profile (left) and after 8 iterations of feedback optimization (right), which improve
(10%) from 9.8% to 2.1%. (Below) The intensity around
the circumference showing the target pattern (red), and the measured profile before (green) and after (blue) feedback. (b) RMS error progression for the ring pattern, recorded at each step of the feedback algorithm. (c) A Gaussian double well, showing Signal-Region intensity before (left) and after (right) feedback. (Below) A cut across the centre of the two wells, showing normalized intensity for the initial, final and target patterns. For this pattern,(10%)improved from 5.5% to 0.7%
Table 1.Summary of improvements, including error, iterations (ι) and Efficiency (Γ).
[%] (10%) [%]
Pattern i=1 i=ι i=1 i=ι ι Γ [%]
Indented Ring 21.9 6.7 9.8 2.1 8 21.5 Double Well 19.0 5.5 5.5 0.7 10 20.0 Square Lattice 22.0 15.3 3.6 2.3 10 14.8 Ring Lattice 13.7 10.0 2.5 1.1 10 17.5
pixels within 10% of the brightest pixel - the trapping minimum - as another figure of merit. Finally, light-usage efficiencies Γ have been calculated for each of the final output patterns. Around 50% of the light incident on the SLM in our experimental set-up is diffracted into the first-order and goes on to make up the hologram (Signal and Noise regions). To find the overall trap efficiency, we multiply the efficiency of the hologram (the percentage of first-order light in the Signal Region) with the 50% SLM efficiency.
The measured Signal Region intensity for the indented ring is shown in figure 2(a). The main deviation in the initial output is a left-right intensity gradient due to the reduced diffraction efficiency of the SLM at larger deflection angles. This initial pattern has = 21.9%, and (10%) = 9.8% . The feedback process corrects for this intensity gradient and also corrects the width of the ring, improving to 6.7% and (10%) to 2.1%. Along the circumference, large fluctuations have been suppressed by the feedback process as shown in the plot in figure 2(a). A stagnation point is reached after 8 iterations of the feedback loop, as plotted in figure 2(b). In this example the value ofαchanges from 0.6 to 0.3 after the third iteration. This evolution of the RMS error is typical for most of our feedback optimizations, showing a major improvement in the first iteration, followed by smaller improvements converging to a more accurate pattern. Most patterns are optimized in fewer than 10 iterations of feedback, which takes around 10 minutes to complete. The final optimised phase pattern is saved for future use in cold atoms experiments.
The final value of (10%) is sufficiently low for experiments of interest in this atom ring-trap. If a ring with 80µm radius and 12µm width is generated with 3.5 mW of laser power, the trap depth is 69 nK. If a Bose–Einstein condensate of 105 87Rb atoms is trapped in this ring at zero magnetic field, the chemical potential is sufficiently low (µ= 6.9 nK) for the atoms to be confined. In particular, this trap can be used for studies of superfluid effects; fluctuations of 2.1% in the trap depth are smaller thanµ/5, which is sufficiently low that the superfluidity of the gas persists [21]. This ring pattern may be used to study transport phenomena [22], while indented rings have also been
suggested for the study of sonic black hole analogs in atomic condensates [23, 24].
A pattern which particularly demonstrates the robustness of the algorithm is the Gaussian double well shown in figure 2(c), which has many uses for investigating fundamental quantum mechanics [19]. Before feedback the initial output is aberrated to the extent that it resembles a single-well potential. After 10 iterations (during which αis fixed at 0.6) the two wells are clearly distinguishable.
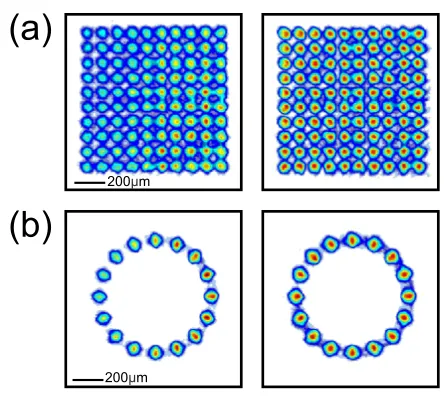
Figure 3. Discrete patterns. Signal Region intensity of (a) a 10×10 square lattice and (b) a 16-spot ring lattice before (left) and after (right) feedback. Errors in the trapping minimum decrease from 3.6% to 2.3% for the square lattice and from 2.5% to 1.1% for the ring lattice.
In figure 3 the target patterns are different arrangements of simple Gaussian spots of the same intensity. The simple square array is analogous to an optical lattice with the underlying spatially-varying potential removed, while the ring lattice is an experimental geometry which is interesting for quantum simulation [25, 26], but which cannot be created using more conventional methods such as standing waves. Our feedback algorithm corrects the size and position of aberrated spots within 10 iterations. We measure a decrease in from 22.0% to 15.3% for the square lattice, and from 13.7% to 10.0% for the ring lattice, whilst(10%) is reduced from 3.6% to 2.3% for the square lattice, and from 2.5% to 1.1% for the ring lattice.
[image:4.612.316.539.199.397.2]is not required with our algorithm. Moreover, our algorithm is sufficiently general to be applicable to both discrete and continuous patterns. The optimization in Ref [14] considers only the height of distinct spots of light, quoting an improved standard deviation of these heights from 19% to 1.4%. Our algorithm corrects also the position and shape of the spots. For comparison, we measure the standard deviation of heights for the ring (square) lattice spots and find an improvement from 20.3% to 1.3% (12.5% to 2.1%). The optimization of continuous light distributions performed in Ref [13] gives light patterns withbetween 6% and 9%, which is again comparable to the values we achieve for the indented ring and double well (6.7% and 5.5% respectively).
In summary, the feedback algorithm is sufficiently robust to correct for large aberrations in the experimentally generated optical traps within few iterations, bringing optical trap discrepancies to the percent level. However, we note that it is important to use the feedback method in conjunction with a hologram–calculation algorithm that suppresses optical vortices at the outset. This is because the feedback is less effective at correcting defects at small length-scales. The MRAF algorithm used here is appropriate with well-chosen initial conditions, while the recently–proposed Conjugate Gradient optimization algorithm [27] is also suitable, and we have already performed initial tests of the compatibility of feedback with Conjugate Gradient optimization, with promising results.
Improvements may be made to the feedback algorithm upon its integration into a cold atoms experiment. The sensitivity of cold atoms to any trapping potential roughness means that we envisage continuing to use the feedback loop by taking in-situ images of the trapped atoms [5, 28] rather than directly imaging the light profile. Furthermore, recent developments of high numerical aperture microscope objectives for cold-atoms [3, 29–32] could be combined with our approach to produce more finely detailed traps, although this may require more sophisticated calculation stages such as those performed in Ref [33].
Acknowledgments
The authors acknowledge helpful conversations and experimental assistance from S. L. Bromley, T. Harte, G. Smirne and L. Torralbo-Campo, and funding from EPSRC UK and the Leverhulme Trust Research Program Grant RPG-2013-074.
References
[1] Houston N, Riis E and Arnold A S 2008J. Phys. B: At. Mol. Opt. Phys. 41211001
[2] Henderson K, Ryu C, MacCormick C and Boshier M G 2009 New J. Phys. 11043030
[3] Zimmermann B, M¨uller T, Meineke J, Esslinger T and Moritz H 2011New J. Phys. 13043007
[4] Trypogeorgos D, Harte T, Bonnin A and Foot C 2013Opt. Express2124837-46
[5] Muldoon C, Brandt L, Dong J, Stuart D, Brainis E, Himsworth M and Kuhn A 2012New J. Phys. 14073051 [6] Lee J G and Hill III W T 2014 Rev. Sci. Instrum. 85
103106
[7] McGloin D, Spalding G, Melville H, Sibbett W and Dholakia K 2003Opt. Express11158–66
[8] Bergamini S, Darqui´e B, Jones M, Jacubowiez L, Browaeys A and Grangier P 2004J. Opt. Soc. Am.B211889–94 [9] Boyer V, Godun R M, Smirne G, Cassettari D, Chan-drashekar C M, Deb A B, Laczik Z J and Foot C J 2006 Phys. Rev.A73031402
[10] Franke-Arnold S, Leach J, Padgett M J, Lembessis V E, Ellinas D, Wright A J, Girkin J M, ¨Ohberg P and Arnold A S 2007Opt. Express158619–25
[11] Bruce G D, Mayoh J, Smirne G, Torralbo-Campo L and Cassettari D 2011Phys. Scr.T143014008
[12] Bruce G D, Bromley S L, Smirne G, Torralbo-Campo L and Cassettari D 2011Phys. Rev.A84053410
[13] Gaunt A L and Hadzibabic Z 2012Sci. Rep.2721 [14] Nogrette F, Labuhn H, Ravets S, Barredo D, B´eguin L,
Vernier A, Lahaye T and Browaeys A 2014Phys. Rev.X
4021034
[15] Bowman D, Ireland P, Bruce G D and Cassettari D 2015 Multi-wavelength holography with a single Spatial Light Modulator for ultracold atom experiments arXiv:1501.01185
[16] Pasienski M and DeMarco B 2008Opt. Express162176–90 [17] Fort´agh J, Ott H, Kraft S, G¨unther A and Zimmermann C
2002Phys. Rev.A66041604
[18] Gerchberg R W and Saxton W O 1972Optik35237–46 [19] Milburn G J, Corney J, Wright E M and Walls D F 1997
Phys. Rev.A554318–24
[20] O’Hara K M, Gehm M E, Granade S R and Thomas J E 2001Phys. Rev.A64051403
[21] Ryu C, Andersen M F, Clad´e P, Natarajan V, Helmerson K and Phillips W D 2007Phys. Rev. Lett. 99260401 [22] Brantut J-P, Meineke J, Stadler D, Krinner S and Esslinger
T 2012Science3371069–71
[23] Garay L J, Anglin J R, Cirac J I and Zoller P 2000Phys. Rev. Lett.854643–7
[24] Garay L J, Anglin J R, Cirac J I and Zoller P 2001Phys. Rev.A63023611
[25] Olmos B and Lesanovsky I 2011Phys. Chem. Chem. Phys.
134208–19
[26] Kaminishi E, Kanamoto R, Sato J and Deguchi T 2011 Phys. Rev.A83031601
[27] Harte T, Bruce G D, Keeling J and Cassettari D 2014Opt. Express2226548–58
[28] Andrews M R, Mewes M-O, van Druten N J, Durfee D S, Kurn D M and Ketterle W 1996Science27384–87 [29] Alt W 2002Optik113142–144
[30] Bakr W S, Gillen J I, Peng A, F¨olling S and Greiner M 2009 Nature46274–77
[31] Sherson J F, Weitenberg C, Endres M, Cheneau M, Bloch I and Kuhr S 2010Nature46768–72
[32] Haller E, Hudson J, Kelly A, Cotta D A, Peaudecerf B, Bruce G D and Kuhr S 2015 Single–atom imaging of fermions in a quantum-gas microscope arXiv:1503.02005 [33] Lin J, Rodr´ıguez-Herrera O G, Kenny F, Lara D and Dainty