1
The UK prevalence of hereditary haemorrhagic telangiectasia and its
association with sex, socioeconomic status and region of residence: A
population-based study.
Authors
J W Donaldson1, T M McKeever1, I P Hall2, R B Hubbard1, A W Fogarty1
1 Division of Epidemiology and Public Health, University of Nottingham, Nottingham, UK
2
Division of Therapeutics and Molecular Medicine, University of Nottingham, Nottingham,
UK
Corresponding author
Dr James Donaldson
Clinical Research Fellow, Division of Epidemiology & Public Health
University of Nottingham, Clinical Sciences Building
Nottingham City Hospital, Hucknall Road
Nottingham, NG5 1PB
Tel: 0115 823 1379
Fax: 0115 823 1337
E-mail: james.donaldson@nottingham.ac.uk
Contributors
JD (Guarantor) was involved in the study conception and design, performed the majority of
2
and RH contributed to the study design and interpretation of findings. All authors were
involved in revising and approving the manuscript before submission.
Word Count
2,963
Keywords
Hereditary Haemorrhagic Telangiectasia, Epidemiology, Prevalence, Sex, Socioeconomic
status
What is the key question?
What is the current prevalence of Hereditary Haemorrhagic Telangiectasia (HHT) in the UK
and how does it vary with respect to age, sex, socioeconomic status and geographical
location?
What is the bottom line?
Using a representative UK general practice database we estimate the prevalence of HHT to
be at least 1 per 9,500 which is more common than previously documented in the UK,
though still likely to represent an underestimate of the true prevalence.
Why read on?
We identify particular under-recognition in the diagnosis of HHT in males and those from
less affluent socioeconomic groups with a significant variation in diagnostic rates between
3
ABSTRACT
Background
Hereditary Haemorrhagic Telangiectasia (HHT) is an autosomal dominant genetic disorder of
aberrant blood vessel development characterised by arteriovenous malformations. HHT is
associated with significant morbidity due to complications including epistaxis,
gastrointestinal bleeding and stroke and may be associated with reduced life expectancy.
We explored the hypothesis that a diagnosis of HHT is associated with sex, socioeconomic
status and geographical location.
Methods
We used The Health Improvement Network, a longitudinal, computerised general practice
database covering 5% of the UK population to calculate prevalence estimates for HHT
stratified by age, sex, socioeconomic status and geographical location.
Results
The 2010 UK point prevalence for HHT was 1.06 per 10,000 person years [95% confidence
interval (CI): 0.95-1.17] or 1 in 9400 individuals. The diagnosed prevalence of HHT was
significantly higher in females compared to males [adjusted prevalence rate ratio (PRR) 1.53,
95% CI: 1.24-1.88] and in those from the most affluent socioeconomic group compared to
the least [adjusted PRR 1.74, 95% CI: 1.14-2.64]. The PRR varied between different regions
of the UK being highest in the South West and lowest in the West Midlands [adjusted PRR
for former compared to latter 1.86, 95% CI: 1.61-2.15].
4
HHT is much more common in the UK population than previously demonstrated, though this
updated figure is still likely to be an underestimate of the true prevalence. HHT appears to
be significantly under-diagnosed in men which is likely to reflect their lower rates of
consultation with primary care services, though it is possible that there may be a gender
differential in disease severity and hence presentation. There is significant under-diagnosis
in patients from lower socioeconomic groups and a marked variation in the prevalence of
diagnosis between different geographical regions across the UK that requires further
investigation.
INTRODUCTION
Hereditary Haemorrhagic Telangiectasia (HHT) is an autosomal dominant genetic disorder of
blood vessel development characterised by mucocutaneous telangiectases and by
arteriovenous malformations (AVMs) in solid organs[1, 2]. HHT is associated with significant
morbidity due to bleeding complications such as epistaxis and gastrointestinal haemorrhage
and from embolic complications including cerebral abscess and stroke[3], which are often
associated with pulmonary arteriovenous malformations (PAVMS)[4]. HHT may also be
associated with reduced life expectancy[5, 6].
HHT can be identified by clinical or genetic screening of family members of affected
individuals but is too often diagnosed as a result of advanced complications of the disease. A
recent expert panel has recommended screening all possible or confirmed HHT cases for
5
understanding and quantifying the burden of disease and informing healthcare planning for
this under-recognised condition. There are few data regarding differences in geographical
prevalence of HHT in the UK or associations with sex, age and socioeconomic status, and
this is important as understanding these relations may increase knowledge of factors that
modify both development and diagnosis of the disease.
Hence, the aim of this study was to determine, using a representative sample of the UK
population obtained via an electronic general practice database, a contemporary prevalence
of diagnosed HHT and its association with age, sex, geographical location and deprivation
status.
METHODS
Study population
This study utilised an anonymised, computerised, longitudinal general practice database
known as The Heath Improvement Network (THIN) which has been validated for
epidemiological research[8, 9]. The THIN database records a variety of patient clinical and
lifestyle data from consultations both in primary and secondary care including medical
conditions, symptoms, medications and sociodemographic details. At the time of data
extraction (September 2011), THIN covered 5% of the UK population with 3.46 million
patients actively followed prospectively from 440 general practices[10].
6
We initially identified all recorded diagnoses (by medical Read codes) between the years
2000 and 2010 of Hereditary Haemorrhagic Telangiectasia (G770.00) and
Rendu-Osler-Weber Disease (G770.11). Given the high prevalence of HHT in individuals with pulmonary
AVMs[11] we also searched for Read codes pertinent to pulmonary AVMs (we excluded any
individuals previously identified as having Read codes for HHT or Rendu-Osler-Weber
disease to prevent double-counting). Population denominator values were derived from the
annual mid-year populations contributing to THIN. The results presented in this paper are
for patients coded as Hereditary Haemorrhagic Telangiectasia (G770.00) or Rendu-
Osler-Weber Disease (G770.11) only. A repeat analysis of a wider population was conducted
which included all the Read codes listed in Table 1.
Statistical methods
Data for 2010 (the most recent complete data year) were used to calculate a point
prevalence for HHT. We stratified our results by sex, age group (<15 years, 15-49 years and
50+ years), geographical location and socioeconomic status. Geographical location was
defined by UK Health Authority areas and socioeconomic status was based on the Townsend
index score in quintiles[12]. Given the relatively small numbers available for analysis by
health authority in 2010, we used combined data from 2000-2010 to calculate prevalence
estimates for HHT between different health authorities in the UK adjusting for the use of
repeated measures (see below). We were able to look for any significant changes in the
prevalence of HHT over the 10 year period between 2000 and 2010. Prevalence estimates
taken over multiple years were adjusted by direct standardisation to the 2010 THIN
population. Random effects modelling (Huber’s Method) allowed for the non-independent
7
adjusting the standard errors of the final model. We used Poisson regression to compare
prevalence rate ratios, controlling for year, age, sex, Townsend score and health authority.
Statistical tests of significance were performed using the likelihood ratio method unless
otherwise stated. All analyses were carried out in Stata SE12 (Stata Statistical Software:
Stata/SE12.0 for Windows; Stata Corporation, College Station, Texas, USA). The research
protocol for this study was approved by the THIN Scientific Review Committee.
RESULTS
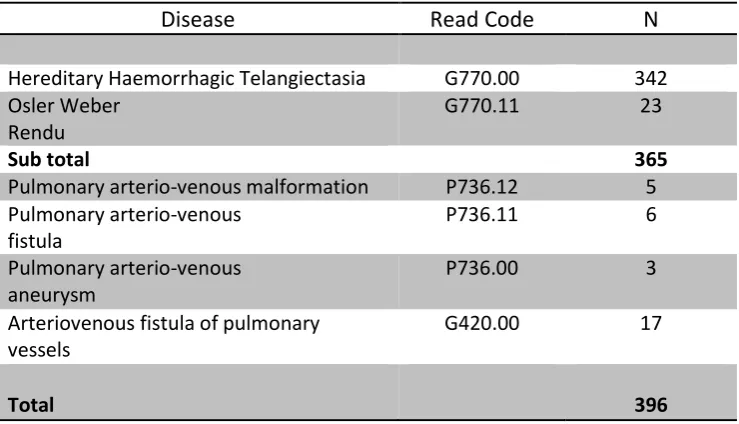
We identified a total of 563 individuals diagnosed with HHT/Rendu-Osler-Weber Disease in
the THIN database from the years 2000–2010 with 365 cases contributing to the calculated
point prevalence in 2010. Table 1 presents the total number of diagnosed cases identified in
2010 stratified by Read code.
Disease Read Code N
Hereditary Haemorrhagic Telangiectasia G770.00 342 Osler Weber
Rendu
G770.11 23
Sub total 365
Pulmonary arterio-venous malformation P736.12 5 Pulmonary arterio-venous
fistula
P736.11 6
Pulmonary arterio-venous aneurysm
P736.00 3
Arteriovenous fistula of pulmonary vessels
G420.00 17
[image:7.595.114.484.514.726.2]Total 396
8
Overall Prevalence
The point prevalence of HHT in 2010 was 1.06 per 10,000 (95% CI: 0.95-1.17) or 1 per 9,400.
In the sensitivity analysis using broader diagnostic criteria (combining all Read codes from
Table 1) the point prevalence in 2010 increased to 1.15 per 10,000 (95% CI: 1.04-1.26) or 1
per 8,700.
Prevalence by Sex and Year
The prevalence of a diagnosis of HHT was strongly related to sex, with a higher prevalence
rate in females compared to males for all years between 2000 and 2010 (Fig 1). In 2010 the
point prevalence in women was 1.29 per 10,000 person years (95% CI: 1.12-1.46) and for
men was 0.82 per 10,000 person years (95% CI: 0.69-96). After adjusting for age, deprivation
status and geographical location, the prevalence rate ratio (PRR) in 2010 for HHT was higher
in women compared with men (PRR 1.59, 95% CI: 1.30-1.94, p<0.0001). The prevalence rate
for both men and women has remained relatively constant over the last 10 years.
Prevalence by Sex and Age group
Prevalent cases from 2010 were grouped into 3 different age categories (<15 years, 15-49
years and 50 years and over) and stratified by sex (Fig 2). The unadjusted prevalence rate in
both sexes was lowest in those aged <15 years and highest in the 50+ age group though the
adjusted prevalence rate ratios across the age groups did not differ significantly (p test for
9
Crude Prevalence rates (95% CI) per 10,000 person-years
Crude prevalence rate ratios (95% CI)
[image:9.595.95.502.70.376.2]Mutually adjusted prevalence rate ratios
(95% CI)*
Sex
Male 0.84 (0.70-0.98) 1.00 1.00
Female 1.28 (1.11-1.44) 1.56 (1.25-1.95) 1.53 (1.24-1.88) P=0.0001
Age group (years)
<15 years 0.61 (1.15-1.77) 1.00 1.00
15-50 years 0.84 (0.71-0.98) 1.39 (0.88-2.19) 1.39 (0.96-2.02) >50 years 1.58 (1.35-1.81) 2.62 (1.69-4.07) 2.53 (1.76-3.63)
p<0.0001 p=0.29ᵒ
Townsend Score
1 (Least deprived) 1.31 (1.07-1.55) 1.93 (1.29-2.89) 1.74 (1.14-2.64) 2 1.05 (0.81-1.29) 1.55 (1.701-2.38) 1.36 (0.88-2.11) 3 1.10 (0.85-1.35) 1.62 (1.03-2.55) 1.50 (0.97-2.31) 4 0.87 (0.63-1.10) 1.28 (0.79-2.08) 1.23 (0.78-1.94) 5 (Most deprived) 0.68 (0.43-0.93) 1.00 1.00
9 (Missing values) 1.34 (0.77-1.91) 1.98 (1.12-3.52) 2.20 (1.25-3.88) P=0.026
Table 2. Crude prevalence rates and prevalence rate ratios of HHT derived from Poisson regression modelling using The Health Improvement Network dataset in 2010.
*Adjusted for sex, age group, Townsend score and health authority
ᵒp-trend across age categories
Prevalence by Deprivation status
The prevalence of HHT was inversely associated with socioeconomic deprivation (Table 2).
The crude prevalence rate in the most deprived group (Townsend score: quintile 5) was 0.68
per 10,000 (95% CI: 0.43-0.93) compared to 1.31 per 10,000 in the least deprived quintile
(95% CI: 1.07-1.55). After adjusting for the effects of age, gender and geographical location,
the prevalence rate ratio was higher in those in the least deprived socioeconomic group
when compared to those in the most deprived group (PRR 1.74, 95% CI: 1.14-2.64,
p<0.0001).
10
There was substantial variation in estimates of the crude prevalence of HHT across the UK
when stratified by health authority over the 10 year period 2000-2010 (Fig 3). The adjusted
prevalence rate ratio varied almost twofold across the different UK health authority
boundaries (PRR 1.86, 95% CI: 1.61-2.15, p<0.0001) with the lowest adjusted prevalence in
the West Midlands and the highest prevalence in the South West (Table 3).
Crude prevalence rates (95% CI) per 10,000 person-years
Crude prevalence rate ratios (95% CI)
[image:10.595.92.504.268.527.2]Mutually adjusted prevalence rate ratios
(95% CI)*
Health Authority
West Midlands 0.78 (0.69-0.88) 1.01 (0.85-1.19) 1.00
East Midlands 0.85 (0.71-1.00) 1.09 (0.89-1.34) 1.08 (0.88-1.33)
London 0.78 (0.69-0.87) 1.00 1.13 (0.96-1.34)
South East Coast 1.02 (0.92-1.13) 1.32 (1.13-1.54) 1.30 (1.11-1.52) Northern Ireland 0.93 (0.77-1.09) 1.20 (0.97-1.48) 1.30 (1.05-1.61) East of England 1.07 (0.95-1.18) 1.37 (1.16-1.61) 1.35 (1.15-1.59) Scotland 1.07 (0.97-1.17) 1.37 (1.18-1.59) 1.45 (1.25-1.69) North West 1.14 (1.03-1.25) 1.46 (1.26-1.70) 1.48 (1.27-1.72) South Central 1.23 (1.13-1.33) 1.58 (1.37-1.82) 1.54 (1.33-1.77) Yorkshire & Humber 1.37 (1.18-1.55) 1.75 (1.46-2.10) 1.76 (1.46-2.11) Wales 1.35 (1.20-1.51) 1.73 (1.47-2.04) 1.77 (1.50-2.09) North East 1.35 (1.14-1.55) 1.73 (1.42-2.10) 1.80 (1.48-2.19) South West 1.51 (1.39-1.63) 1.94 (1.68-2.23) 1.86 (1.61-2.15)
p<0.0001
Table 3. Crude prevalence rates and prevalence rate ratios derived from Poisson regression modelling of HHT prevalence using The Health Improvement Network dataset between 2000 and 2010
*Adjusted for age, sex and Townsend score
Sensitivity Analysis
The above analyses were repeated to include all Read codes listed in Table 1, rather than
11
in qualitative trends of our results nor significance values for these trends. There was a
slight change in the prevalence rate ratios calculated for the different health authority areas
in the sensitivity analysis, with HHT or PAVMs diagnosed most commonly in Yorkshire rather
than the South West (data not shown).
DISCUSSION
Summary of results
This is the first study to use a national primary care population-based database to explore
sex, socioeconomic and regional differences in the prevalence of hereditary haemorrhagic
telangiectasia, as well as providing national prevalence figures for the United Kingdom. The
2010 point prevalence for HHT in the UK is 1.06 per 10,000 (or 1 per 9,400) which has
remained relatively stable between 2000 and 2010. The prevalence estimate is higher when
Read codes likely to be associated with HHT are included (1 per 8,700) and is higher still if
the prevalence in females is considered to be more representative of the population as a
whole (1 per 7,800). The prevalence increases with age. The diagnosed prevalence ratio of
HHT was 59% higher in women than in men and 74% higher in those from the least deprived
socioeconomic group when compared to those in the most deprived group. In addition, we
have demonstrated a substantial geographical variation in the diagnosed prevalence of HHT
12
Strengths and Weaknesses
This is the first population-based study of HHT using a primary care database in the UK
general population. With a total of 365 HHT prevalent cases identified in 2010 our study
sample size is almost four times larger than the last UK estimate undertaken in 1992[13], is
nationally representative and comparable in size with epidemiological studies conducted in
other countries[6, 14, 15]. We have been able to stratify our prevalence estimates by sex,
age group, deprivation status and geographical location without the risk of bias that may
occur either from low response rates (as have been observed in previous surveys of HHT
prevalence in the UK[13]) or from case-series in specialist centres which may lack a
denominator population or represent cases referred for specialist care with potentially
more severe disease.
There are potential limitations to the study which should be addressed. The first is that of
the validity of the HHT diagnoses, which are recorded by general practitioners in the THIN
database whilst the clinical diagnosis is generally made in secondary care. In practice, we are
reasonably confident that the vast majority of these diagnoses will be correct with the
increasing involvement of clinical geneticists in the screening and diagnosis of HHT which
should result in more reliable information being conveyed to the primary care practitioner,
and hence entered into the database. It seems very unlikely that a primary care practitioner
would enter a diagnosis of HHT into the database unless it was supported by
correspondence from secondary care. The consistency of our calculated prevalence of HHT
with other comparable estimates from previous studies also supports the reliability of our
findings. One further limitation that complicates all studies of HHT prevalence at present is
13
explain the higher prevalence of PAVMs as defined by radiological criteria (and by inference,
HHT) in patients who were participating in a recent Japanese CT screening program for lung
cancer[16] than we observed in our dataset which did not use this radiological definition of
the disease. Diagnosis is often confounded by the heterogeneous clinical presentation of
HHT due to its variable genetic penetrance and expressivity[17]. An average time lag of 25
years separates disease onset and first definite diagnosis[18]. Hence, our prevalence
estimates represent those with diagnosed HHT, and are likely to be lower than the true
prevalence defined as all individuals with a mutation compatible with the disease. The fact
that our data show the prevalence of the disease has been stable in both sexes over the last
decade would suggest that the consistency in coding practice over this period has been
maintained.
We used the Townsend score which is a deprivation index based on area as it was not
possible to access individual-level deprivation data. This score presumes that individuals
living within a geographical area have a similar deprivation status which may not be the
case. However, there is evidence to suggest that the Townsend scores calculated at a district
level are good proxy measures for individual levels of deprivation[19].
Interpretation of results
Reasons for the marked sex difference between the diagnosed prevalence of HHT require
careful consideration. One study from the Dutch Antilles showed a 33% increased
prevalence ratio of a ‘definite’ diagnosis of HHT in females compared with males (using the
Curacao criteria)[15], and a recent US paper found a female:male ratio of 1.54, with HHT
being diagnosed more commonly in females[20]. Other studies have reported a more
14
the offspring of affected individuals will have a 50% chance of inheriting a mutation and this
should not per se be associated with a sex bias. Our data show a significant difference in
diagnosis of HHT in women compared with men which appears to be greatest between the
ages of 15 and 49. One possible explanation for this observation is that the higher diagnosed
prevalence of HHT in females we observed is due to a difference in access to healthcare
resources. Women have significantly higher rates of consultation with primary care
providers during the ages of 15 to 70 years with many consultations due to issues
surrounding contraception, pregnancy and childcare, and this may explain an increased
ascertainment of symptomatic females with HHT[21, 22]. A possible alternative explanation
for the disparity between sexes may be that the expression of the HHT phenotype is more
common in females with the gene mutation. Little is known about the role of other genetic
factors (such as moderator genes) or environmental factors that may modify the HHT
phenotype but there is limited evidence that symptoms such as epistaxis may be amenable
to treatment via manipulation of oestrogen and progesterone levels[23]. During pregnancy
there is an increased risk of developing complications of HHT[24, 25] and it has been
suggested that this may represent a modification of the HHT vasculature by female
hormones or be secondary to the haemodynamic changes of pregnancy. Clarifying whether
the sex differential in diagnosis of HHT is due solely to behavioural factors or may be partly
due to biological reasons is an important area for further research.
The reduced prevalence of diagnosed HHT in those from lower socioeconomic groups has
multiple potential explanations which encompass controversial issues such as the proximity
and quality of healthcare services provided in more deprived areas, as well as differentials in
15
is internationally recognised that health and healthcare access inequities vary along social
gradients[26] and one study looking at health seeking behaviour in those from more
deprived areas with asthma found that these populations reported a higher prevalence of
respiratory symptoms but had lower consultation rates for those symptoms[27].
Explanations such as varying access to health care, differing perceptions of symptom
severity or less positive views of health care services were postulated to explain this
disparity[27, 28].
Finally, we have observed an almost two-fold difference in diagnosed prevalence
throughout the UK; least common in the West Midlands and most common in the South
West. A pattern of geographical variability has been seen in in other studies, most notably
in the landmark French paper which first identified a particularly high concentration of
affected individuals in the Ain, Jura and Deux-Sevres regions of the country[29]. They
attributed their findings to a local founder effect where an initial new mutation had given
rise to a cluster of affected individuals that then gradually moved by diffusion to involve
other nearby regions[30]. It is not possible to say whether our findings could represent
genetic clusters of the disease in the UK or if they are the result of variations in local primary
or secondary care recording practice or access to healthcare resources. Further work should
try to address this as there may be regions of the UK with a disproportionate
under-diagnosis of HHT, thus exposing individuals to the avoidable risk of the complications of this
disease.
Comparison with existing literature
Table 4 provides a summary of the HHT prevalence estimates of different studies conducted
16
different methodologies which, in part, explains the differing results. Certain areas such as
the Dutch Antilles and the Ain department of France have shown particularly high
prevalence of the disease. Elsewhere, most studies indicate a prevalence between 1 and 1.6
per 10,000 (or between 1 per 6,000 and 1 per 10,000) and our study estimate falls within
this range, although data from individuals with health insurance in the USA provide
estimates as low as 1 per 33,000[20]. Our findings with respect to age are consistent with
previous work with the prevalence of HHT being higher in older age groups, suggesting that
the disease has an age-related penetrance[17] or alternatively that the likelihood of
diagnosis is related to longevity. No other studies have looked at the prevalence of diagnosis
by deprivation status and most studies have been restricted to a small geographical area
excepting the epidemiological data from France which also shows a wide variation in
prevalence depending on geographical location[29, 31, 32]. Further research should
consider the influence of disease severity on the diagnosed prevalence rate and its
potentially confounding effect on our observations with respect to sex, socioeconomic
17 Year of
study
Year of estimate
Authors Study setting and methodology Study size Prevalence rate (per 10,000)
Prevalence rate
2013 2010 Donaldson et al UK primary care database 365 1.06 1 per 9,400
2013 2005-2010
Grosse et al[20] US health insurance database 1203 0.3 1 per 33,000
2003 1998 Westermann et al [15]
Screening extended pedigree of previously identified cases in Antilles, Netherlands
112 7.51 1 per 1,300
2002 2002 Dakeishi et al[14]
Screening extended pedigree of cases referred to tertiary centre in Akita prefecture, Northern Japan
23 1.25 1 per 8,000
1999 1995 Kjeldsen et al[6] Regional patient database, Fyne county, Denmark
73 1.56 1 per 6,400
1995 1994 Guttmacher et al[33]
Postal questionnaire of
identified cases in Vermont, USA
34 0.61 1 per 16,400
1992 1991 Jessurun et al[34]
Study of cases hospitalised to one centre in Leeward Islands, Antilles, Netherlands
32 1.94 1 per 5,200
1992 1990 Porteous et al[13]
Postal questionnaire study of cases in Newcastle, “Northern Region”, UK
79 0.25 1 per 40,000
1989 1989 Bideau et al[29] Postal questionnaire study of cases identified by physicians in France (52 departments)
406 1.20 1 per 8,300
1984 1983 Plauchu et al[31] Postal questionnaire study of cases identified by physicians in Ain department, France
[image:17.595.29.570.74.466.2]150 4.25 1 per 2,400
Table 4. Summary of previous prevalence studies of HHT
Implications
This is the first contemporary study in a representative UK population to estimate the
prevalence of HHT and suggests that it is much more common than the previously thought,
and similar to the prevalence seen in other countries. Assuming that the prevalence of HHT
in males is the same as for females, the “true” estimate of total prevalence would be closer
to 1.28 per 10,000 or 1 per 7800 (the figure calculated for females alone). A similar
18
UK (the health authority with the highest crude prevalence of HHT) estimates a prevalence
of 1.9 per 10,000 and would equate to at least 11,800 cases of HHT in a population of 62.3
million in 2010[35]. The lower diagnostic rate of HHT in males and those from less affluent
social backgrounds suggests a sociological (or alternatively a biological role) in the
presentation of HHT, while the previously unreported regional differences is an observation
that requires validation in other datasets. Future research would ideally draw on a national
rare disease database with integrated clinical information and genetic samples allowing
greater understanding of the presentation of the disease, the genotype-phenotype
relationship in HHT and the influences upon it of moderator genes and external
environmental factors.
Acknowledgements
We acknowledge Mr C Smith, Division of Epidemiology and Public Health, University of
Nottingham for his assistance with data extraction for the manuscript.
Competing Interests None
Funding
JD is funded jointly by a grant from the University of Nottingham and Nottingham University
Hospitals NHS Trust. RBH is the GSK/BLF Chair of Respiratory Epidemiology.
19
Fig 1. The UK prevalence of hereditary haemorrhagic telangiectasia by sex and year (2000-2010) with total prevalent cases tabulated
Fig 2. The prevalence of hereditary haemorrhagic telangiectasia by sex and age group in 2010
Fig 3. The crude prevalence of hereditary haemorrhagic telangiectasia (per 10,000) by UK health authority area (2000-2010)
REFERENCES
1 Govani FS, Shovlin CL. Hereditary haemorrhagic telangiectasia: a clinical and scientific review. Eur J Hum Genet 2009;17:860-71.
2 Shovlin, CL. Hereditary haemorrhagic telangiectasia: pathophysiology, diagnosis and treatment. Blood Rev 2010;24:203-19.
3 Cottin V, Chinet T, Lavole A et al. Pulmonary arteriovenous malformations in hereditary hemorrhagic telangiectasia: A series of 126 patients. Medicine 2007;86:1-17.
4 Shovlin CL, Jackson JE, Bamford KB et al. Primary determinants of ischaemic stroke/brain abscess risks are independent of severity of pulmonary arteriovenous malformations in hereditary haemorrhagic telangiectasia. Thorax 2008;63:259-66.
5 Sabba C, Pasculli G, Suppressa P et al. Life expectancy in patients with hereditary haemorrhagic telangiectasia. QJM 2006;99:327-34.
6 Kjeldsen AD, Vase P, Green A et al. Hereditary haemorrhagic telangiectasia: a population-based study of prevalence and mortality in Danish patients. J Intern Med 1999;245:31-9. 7 Faughnan ME, Palda VA, Garci-Tsao G et al. International guidelines for the diagnosis and
20
8 Lewis JD, Schinnar R, Bilker WB et al.Validation studies of the health improvement network (THIN) database for pharmacoepidemiology research. Pharmacoepidemiol Drug Saf
2007;16:393-401.
9 Ruigomez AE, Martin-Merino E, Rodriguez LAG. Validation of ischemic cerebrovascular diagnoses in the health improvement network (THIN). Pharmacoepidemiol Drug Saf 2010;19:579-85.
10 EPIC. THIN Data Guide for Researchers. 2011.
11 van Gent MWF, Post MC, Snijder RJ et al. Real prevalence of pulmonary right-to-left shunt according to genotype in patients with hereditary hemorrhagic telangiectasia: a
transthoracic contrast echocardiography study. Chest 2010;138:833-9. 12 Townsend P. Deprivation. J Soc Policy 1987;16:125-146.
13 Porteous ME, Burn J, Proctor SJ. Hereditary haemorrhagic telangiectasia: a clinical analysis. J Med Genet 1992;29:527-30.
14 Dakeishi M, Shioya T, Wada Y et al.Genetic epidemiology of hereditary hemorrhagic telangiectasia in a local community in the northern part of Japan. Hum Mutat 2002;19:140-8.
15 Westermann CJJ, Rosina AF, De Vries V et al. The prevalence and manifestations of
hereditary hemorrhagic telangiectasia in the Afro-Caribbean population of the Netherlands Antilles: a family screening. Am J Med Genet A 2003;116:324-8.
16 Nakayama M, Nawa T, Chonan T et al. Prevalence of Pulmonary arteriovenous
malformations as estimated by low-dose thoracic CT screening. Intern Med 2012;51:1677-81.
21
18 Pierruci P, Lenato GM, Suppressa P et al. A long diagnostic delay in patients with Hereditary Haemorrhagic Telangiectasia: a questionnaire-based retrospective study. Orphanet J Rare Dis 2012;7:33-46.
19 Adams J, Ryan V, White M. How accurate are Townsend Deprivation Scores as predictors of self-reported health? A comparison with individual level data. J Public Health 2005;27:101-6. 20 Grosse SD, Boulet SL, Grant AM et al. The use of US health insurance data for surveillance of
rare disorders: hereditary hemorrhagic telangiectasia. Genet Med 2013 Advance online publication doi:10.1038/gim.2013.66.
21 Kapur N, Hunt I, Lunt M et al. Primary care consultation predictors in men and women: a cohort study. Br J Gen Pract 2005;55:108-13.
22 Hippisley-Cox J, Vinogradova Y. Trends in Consultation rates in General Practice 1995/1996 to 2008/2009: Analysis of the Q Research database. Report to The Health and Social Care Information Centre 1999.
23 Jameson JJ, Cave DR. Hormonal and Antihormonal Therapy for Epistaxis in Hereditary Hemorrhagic Telangiectasia. Laryngoscope 2004;114:705-709.
24 Shovlin CL, Winstock AR, Peters AM et al. Medical complications of pregnancy in hereditary haemorrhagic telangiectasia. QJM 1995;88:879-87.
25 Shovlin CL. Sodhi V, McCarthy A et al. Estimates of maternal risks of pregnancy for women with hereditary haemorrhagic telangiectasia (Osler-Weber-Rendu syndrome): suggested approach for obstetric services. BJOG 2008;115:1108-15.
26 Butler DC, Petterson S, Phillips RL et al. Measures of Social Deprivation That Predict Health Care Access and Need within a Rational Area of Primary Care Service Delivery. Health Serv Res 2012;48:539-559.
22
28 Hart, JT. The inverse care law. Lancet 1971;7696:405-12.
29 Bideau A, Plauchu H, Brunet G et al. Epidemiological investigation of Rendu-Osler disease in France: its geographical distribution and prevalence. Population 1989;44:3-22.
30 Brunet G, Lesca G, Genin E et al. Thirty Years of Research into Rendu-Osler-Weber Disease in France: Historical Demography, Population Genetics and Molecular Biology. Population 2009;64:273-292.
31 Plauchu H, Bideau A. Epidemiologie et constitution d'un registre de population a propros d'une concentration geographique d'une maladie hereditaire rare. Population 1984;4-5:765-786.
32 Bideau A, Brunet G, Heyer E et al. An abnormal concentration of cases of Rendu-Osler disease in the Valserine valley of the French Jura: a genealogical and demographic study. Ann Hum Biol 1992;19:233-47.
33 Guttmacher AE, McKinnon WC, Upton MD. Hereditary hemorrhagic telangiectasia: a disorder in search of the genetics community. Am J Med Genet 1995;52:252-3.