Power Flow Control for Power and Voltage Management in
Future Smart Energy Communities
A Fazeli†, M Sumner*, E Christopher*, M Johnson*
* University of Nottingham, Nottingham, NG7 2RD, UK, mark.sumner@nottingham.ac.uk † Alstom Grid, St Leonard’s Avenue, Stafford, ST17 4LX, UK
Keywords: DSM, Smart Grid, Voltage Regulation.
Abstract
The Community Power Flow Control (CPFC) Algorithm has been proposed as a technique for managing electrical power and energy within small communities. The CPFC manages the resources in the community (DSM, energy storage, RES) in order to control the community’s instantaneous power flow according to a target set by a higher-level management system. This paper investigates the capability of the CPFC to manage local distribution voltage levels. The power flow data for a community has been used together with transformer and cable impedance models to demonstrate the variation of the distribution voltage in a community with significant penetration of PV and EV. The CPFC is shown to manage the voltage levels along a feeder within the statutory limits, even when there is significant export.
1 Introduction
The electrification of heat and transport in addition to the uptake of Distributed Generation (DG) in the residential sector are expected to affect the operation of the distribution networks, and would not be possible unless the required degree of active management and control is incorporated within this system. In particular the integration of these emerging resources is expected to cause voltage instability for the radial low voltage distribution network.
Voltage stability can be defined as the ability of a power system to maintain steady and acceptable voltage at all the buses in the system at normal operating conditions, after being subjected to a disturbance [1]. Voltage instability can occur when a disturbance causes a sudden and uncontrollable decline in voltage. There are various factors which could cause voltage instability including:
• Contingencies (line or generator outage due to faults) • Load disturbances
• Improper operation of voltage control devices • System faults
In the absence of voltage compensation devices, the reduction of voltage as a result of load increase would eventually reach a critical point, beyond which any further load increase would lead to a complete voltage collapse and a blackout [2]. As
continuous and uninterrupted delivery of power to consumers is the vital functionality of electric power systems, different regulatory limits for variation of voltage and frequency have been put in place. In particular for the UK low voltage network the voltage statutory limits are +10% and -6% of the 230 Volts nominal voltage [3].
2. The Community Power Flow Controller
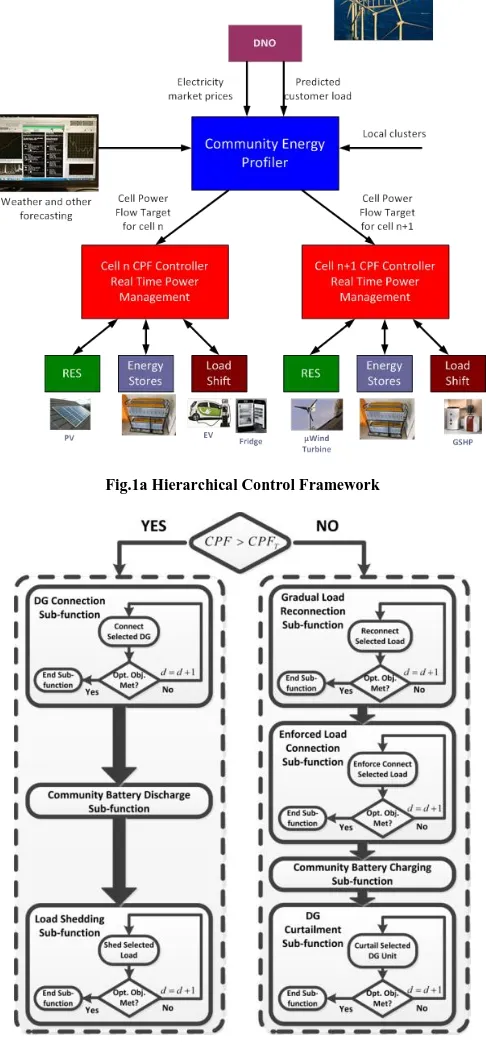
The Community Power Flow Control Algorithm is part of a hierarchical approach to electrical power and energy management proposed in [4,5] and illustrated in Fig.1.a. The CPFC algorithm manages the instantaneous power drawn from the distribution network by the energy community according to a Community Power Flow Target (CPFT) passed to it from a higher level of the hierarchical smart grid control framework. The CPFC manages all of the energy resources within the community including embedded storage (fridges, heat pumps and related thermal stores such Direct Heat Water Cylinders (DHWC)), time-displaceable loads (washing machines, dryers, dishwashers, electric vehicles (assuming NO vehicle to grid (V2G))) and explicit electrical energy storage such as the battery, V2G etc. The CPFC optimises the use of these resources on a second by second basis according to the decision making flowchart of Fig. 1.b [5] to ensure that the community follows as closely as possible the CPFT. It can thus serve as the basis for a Virtual Power Plant. The CPFT itself is generated by the higher level energy management algorithm - the Community Energy Profiler (CEP) - and its profile is continually changed according to an optimisation function, which at present aims to minimise the community's energy cost, self-consumption, peak current drawn from the network or a weighted combination of all three. The CEP can use information from the network operators (for example Time of Use tariffs), and from neighbouring communities to determine the CPFT, together with any prediction of the available local resources (PV, wind, microCHP) and community loading for a particular time period (day/week/peak period).
The cooperative optimal dispatch of cold loads and community energy storage unit has shown the effectiveness of cooperative resource dispatch, towards meeting the common objective function of maintaining community's power flow below a pre-specified threshold.
Fig.1a Hierarchical Control Framework
Fig.1b. Hierarchical Control Framework
In order to investigate the impact of different penetration levels of EV and DG on voltage stability within the low voltage distribution network, and also examine the effectiveness of the CPFC algorithm at indirectly regulating
the voltage at different nodes, a model of the LV network supplying a community of 100 dwellings has been created. For this work the CPFT is set at a constant level each day which is the average net consumption predicted for the community based on average consumption and average renewable energy source (RES) production each day. For this work, a year’s work of community loading has been extracted from the electricity demand model at [6], and PV data is available from local measurements with 5 min resolution, providing community equipment usage and power flow data which can be optimised by the CPFT. The structured management of the resources is able to control the CPF close to its CPFT, and in particular significantly reduces the evening peaks [5].
3. Modelling a Small Distribution System
Load flow analysis is the process of calculating the steady state voltage magnitude and phase angle at every bus and the power flow in each branch of the distribution network given the status of generators and loads. The voltage is determined by solving a set of nonlinear equations representing the net active and reactive powers flowing out of each bus. Because these equations exhibit nonlinear characteristics, they must be solved iteratively [7].
It is worth mentioning, that having studied different load flow analysis techniques including Newton Raphson, Gauss-Seidel and Kersting’s Ladder Iterative [8], it became apparent that such methods have different characteristics in terms of applicability to different network topologies and simulation speed, and hence are suitable for different purposes. For example an ant colony optimisation algorithm has been developed in [9] and used to perform power flow analysis for a transmission network with FACTs devices. It reported that since operation of FACT devices is introduced into the problem the resultant power balance equations are much more non-linear. However the developed power flow technique presented in [9] is capable of solving the power balance equations for that system. A modified version of the forward propagation method has been presented in [10]. [10] applies this method to a radial distribution network with distributed generation, and has demonstrated the accuracy and convergence speed of the proposed method.
Before explaining the adopted modelling approach in this project, it is necessary to demonstrate the selected network topology and the methodology used for calculating the impedances of this network’s cables.
3.1 The network topology and parameters
[image:2.595.46.289.161.682.2]comparison with the transmission network, the low voltage distribution networks are mostly resistive [11], [12].
Fig. 2 Schematic of the candidate network, connecting a secondary transformer to 100 dwellings
Therefore the feeder inductance is assumed to be zero. The impedance of the LV feeder depends on its cable characteristics (cross section, material), in addition to its overall length. Since the feeder length would determine its overall resistance and the resultant voltage drop across the feeder, it is important to determine this parameter with respect to the maximum tolerated voltage drop across the feeder length. Therefore the maximum feeder length is calculated so that the voltage drop at the feeder end node does not fall below the lower statutory limit of 216.2Vrms. This calculation includes the After Diversity Maximum Demand (ADMD) which represents the average power per dwelling, and the resistivity of the feeder conductor. A three phase 185mm2, mains LV cable with an aluminium core has been
selected from [13]. The value of ADMD obtained from [14] is 2kW and the maximum feeder length is calculated as 3.07km. This feeder length has a total feeder resistance of 0.47Ω. Assuming that the dwellings are equally distanced from one another, every feeder section between different dwellings has been assumed to have a resistance of 0.0047Ω. Having calculated the total feeder length and impedance for the network under investigation, Kersting’s ladder iterative load flow analysis technique has been used to determine the voltage variation at every bus across the feeder with a time resolution of 1 second.
The ladder iterative technique is an algorithm developed specifically to compute power flow for radial networks. This method relies heavily on application of Kirchhoff’s Current Law (KCL) and Kirchhoff’s Voltage Law (KVL) at all connection buses across the network, in a series of forward and backward sweeps in order to converge to a solution [15]. This method is essentially comprised of two iterative calculation stages termed the forward and the backward sweeps in which the line currents and bus voltages are respectively determined. For the network topology under consideration shown in Fig.2, the forward sweeps starts from the feeder end point (i.e. bus 100). In order to start the first iteration the voltage is assumed to be equal to the reference voltage of 1p.u. The value of the load power is also known at every bus. It is then possible to calculate the line current in each bus.
Having calculated the bus currents and assuming a value of 1p.u. for the voltage at bus 100, the voltage at the adjacent bus can be calculated by applying KVL. These steps are consecutively applied between adjacent nodes in order to
calculate the line currents, until the second bus is reached. At this point the last calculated line current is compared with its previous value. If the difference between the two line current values is less than the convergence tolerance (10-6) the loop
terminates, otherwise the backward sweep is executed. The backward sweep starts at bus 2, where the value of the line current between bus 2 and bus 3 calculated in the forward
sweep is used to determine a new value for voltage at bus 3. Then the load current is simply calculated by applying Ohm’s
law and the application of KCL at bus 3 gives the line current between bus 3 and bus 4. The backward sweep continues until the last bus voltage (i.e. V100) is calculated. Upon termination
of the backward sweep, the forward sweep is initiated using the most recently calculated value of V100 as an input. The
execution of both the forward and the backward sweeps continues until the voltage variation at all the buses converges to a value less than the specified tolerance.
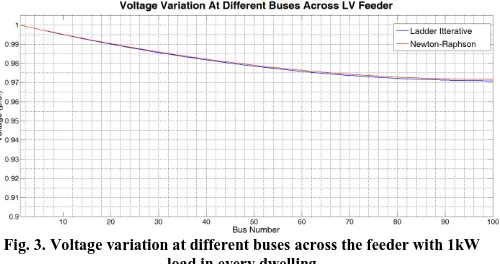
[image:3.595.307.557.358.490.2]After performing the Ladder Iterative load flow analysis technique on the network topology shown in Fig. 2, the voltage magnitude at every bus across the feeder is calculated. Fig. 3 shows the voltage variation obtained at the100 different buses, with an approximate drop of 3% at bus 100.
Fig. 3. Voltage variation at different buses across the feeder with 1kW load in every dwelling
An entire day’s worth of simulation using the Ladder Iterative technique takes 18 minutes 43 seconds which is an acceptable simulation speed for this work.
4 Simulation Scenarios
As highlighted before, the electrification of heat and transport in addition to the integration of distributed generation, are envisaged to occur in the near future. However the integration of these emerging load and generation units are expected to affect the operation of the distribution network, and would not be possible unless the required degree of active management and control is incorporated at different levels of the system. In particular significant voltage variation beyond the statutory limits is expected for the radial low voltage distribution networks which could consequently lead to voltage instability.
4.1 The Load Model
and also examine the effectiveness of the CPFC algorithm at indirectly regulating the voltage at different nodes, a model of the LV network supplying a community of 100 dwellings has been created as described in [5]. The model runs a real time simulation of 100 different dwellings. The electricity demand model presented in [6] is used to quantify the variation of electrical appliance load throughout the day. Bespoke time domain models for each of these pieces of equipment are used to obtain a year’s worth of loading data for each simulated house, sampled at 1 minute intervals. The simulation also includes LI-Ion battery, Photovoltaic Panels, Ground Source Heat Pumps and Electric Vehicle models. The CPFC algorithm can interact with equipment to shed or enforce connect suitable devices based on the requirement to follow the community power flow target. The community power flow is quantified by adding the power from different DERs (i.e. battery, PV, GSHP and EV) and the appliance load from all households.
The electrical loads and DERs from each of the 100 house-models is connected to one of the nodes of the distribution system shown in Fig 2 to demonstrate the variation of voltage along the radial feeder with time during the day.
4.2 Voltage Variation with No EV or PV
The voltage drop across the LV feeder is directly proportional to the feeder length and the distance from the secondary transformer. Therefore while the voltage at the connection node between the secondary transformer and the LV feeder could be effectively regulated close to the nominal value, the voltage at the feeder end node would suffer the most significant variation. This effect will be more profound when there is either an increase in load or distributed generation, as both cases entail an increase in feeder current and consequently a significant voltage drop across the feeder.
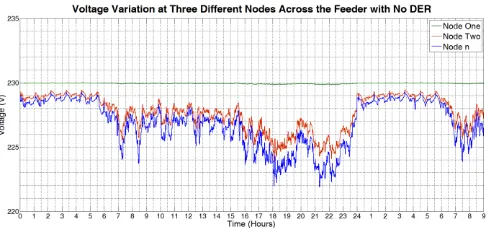
This point is illustrated in Fig. 4 which shows the voltage variation at three different equally distanced nodes across the feeder. The voltage variation at the different nodes are obtained from the LV network model (with no electric vehicles or embedded PV generation), in which the Ladder Iterative power flow analysis technique is performed at every second during a period of 1 day and 9 hours. Node one in Fig. 4. represents the feeder connection point to the secondary transformer. Node two is the feeder middle point and node n is the feeder end point.
According to Fig. 4. the voltage at the end node suffers the most significant reduction, as a result of significant voltage drop across the feeder length.
4.3 Load Growth with and without CPFC
In order to study the effect of load growth on voltage variation at the LV level, three different penetrations of electric vehicles within a community of 100 dwellings are modelled and the simulation results are presented in this section. Fig.5 shows the variation of voltage at the feeder end
[image:4.595.305.550.138.253.2]node with 30% EV, 50% GSHP and PV penetration levels. It is worth noting that in order to investigate the worst case scenario, the allocation of these resources starts from the dwelling at the feeder end node.
Fig. 4. Voltage variation at three nodes across the feeder for a community of 100 dwellings with no EV or DG
According to Fig. 5. when there is no control of active power (red trace), the voltage magnitude falls below the lower statutory limit repeatedly (shown by the green dotted line of Fig 5.). This is caused as a result of EV charging during the evening hours. The voltage can reach a value as low as 200V, if there is no control of active power.
[image:4.595.306.554.467.582.2]The application of the CPFC algorithm significantly reduces the occurrence of voltage excursions below the lower statutory limit (blue trace). However minor voltage excursions still occur during the interval 23:00 - 04:00 hours of the second day. This is primarily due to simultaneous reconnection of electric vehicles for charging – all are configured for overnight charging.
Fig. 5. Variation of voltage at the end of feeder with 30% EV
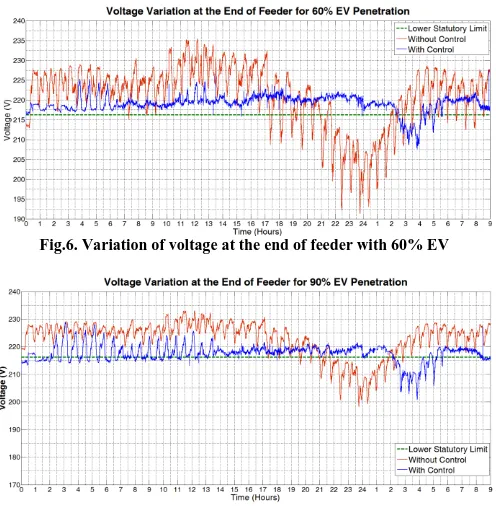
when the EV penetration is increased to 90% as shown on Fig.7. According to Fig.7 the regulated voltage with the CPFC and 90% EV penetration drops as low as 201 V, which might also cause instability.
Fig.6. Variation of voltage at the end of feeder with 60% EV
Fig.7. Variation of voltage at the end of feeder with 90% EV
It is worth noting that at 90% EV penetration during the interval 00:00 – 07:00 hours of the first day, the GSHP are enforce connected to increase the CPF to a value very close to its target. However since voltage is not used in the CPFC’s decision making this enforce connection operation leads to minor voltage excursions below the lower statutory limit. Since the magnitude of these excursions is relatively low, they can be ignored.
In order to demonstrate that the incorporation of sufficient energy storage could improve the CPFC’s effectiveness at indirectly regulating the voltage, the same community is allocated with a 150kWh battery and the EVs are assigned high shedding flexibility. Fig.8. shows the voltage variation at the feeder end node for this community. According to Fig.8 it is evident that as the voltage approaches the lower statutory limit during the late evening hours of day one and the morning hours of day two, only minor voltage excursions occur, and effective voltage regulation is achieved indirectly by implementing the CPFC algorithm.
It is worth noting that the location of the connection node of the battery to the main feeder in addition to the battery’s power rating would significantly influence voltage regulation and these parameters should be taken into account at the design stage.
Fig 8.Variation of voltage at the end of feeder with 90% EV including community battery
4.4 DG growth with and without CPFC
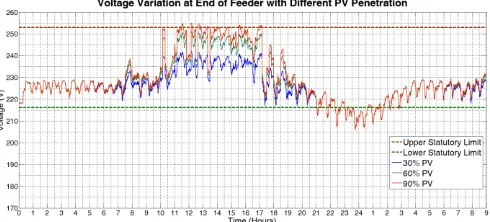
Increasing the penetration level of distributed generation at the low voltage level could result in reverse power flows, during periods when the load on the network is low and there is peak generation. In that case the feeder current flows from the dwellings towards the secondary transformer, and voltage increases across the feeder length as we move away from the secondary transformer towards the feeder end node. Consequently the occurrence of voltage excursions beyond the upper statutory limit (10% nominal voltage) at different nodes across the feeder is expected. The feeder end node would be experiencing the most severe over-voltages. In order to study this effect, three different penetrations of PV panels (1.68kWp per house) within a community of 100 dwellings are modelled and the simulation results are presented in this section. The penetration of other DERs is kept at a constant level in order to merely capture the influence of distributed generation on the voltage variation. Fig.6.38 shows the voltage variation at the feeder end node for three different PV penetration levels. It is evident that during the period 11:00 – 17:00 hours, when irradiation and consequently PV generation is at its highest level, voltage at the feeder end node rises above the 230V nominal value. However the voltage rise at 30% and 60% PV penetration are still below the upper statutory limit during the peak generation period. Despite that at 90% PV penetration the voltage reaches the upper statutory limit and during the interval 11:00 – 13:00 hours it occasionally crosses the upper limit by up to 2V.
[image:5.595.45.293.137.390.2]Variation of voltage at the end of feeder at different PV penetration levels
Fig 9. Voltage variation at the feeder end node at 90% PV penetration
It is evident that application of the CPFC algorithm has indirectly resulted in effective voltage regulation very close to the nominal value of 230 volts throughout the day. The CPFC algorithm has effectively curtailed the correct magnitude of PV generation, in order to control the CPF at its target value. This real time control of active power has indirectly regulated the voltage at different nodes across the feeder.
It is however important to note that the DG curtailment considered in this study would not be beneficial for the consumer. On the other hand if a bulk battery with sufficient capacity were available within this community, the locally generated energy would be stored in the battery and not curtailed. In that case both the consumer and the DNO would benefit from the operation of the CPFC algorithm and the battery. That justifies the need for energy storage at community level.
5 Conclusion
The impact of load and DG growth on voltage variation within a candidate section of the LV network supplying a community of 100 dwellings has been investigated. The simulation results show that, when there is no control of active power, even at 30% EV penetration the voltage magnitude falls below the lower statutory limit repeatedly and can reach a value as low as 200V. On the other hand the application of the CPFC algorithm significantly reduces the occurrence of voltage excursions below the lower statutory limit. However since the CPFC algorithm does not use voltage as a control parameter it fails to regulate the voltage at 60% and 90% EV penetration levels, as more significant voltage excursions occur. This could lead to instability, and consequently voltage collapse. The impact of power
generation from PV units is not as severe and only minor voltage excursion above the upper voltage statutory limits are observed even at 90% PV penetration. However it is important to note that the impact of DG on voltage might be more significant if DG units with higher rated power were considered. In conclusion, the inclusion of voltage as a secondary control parameter in the CPFC’s decision making could ensure effective control of power and voltage throughout the day. This could also avoid unnecessary DG curtailment and has been suggested as future work from this project.
Acknowledgements
This work was supported by European Regional Development Fund (ERDF), within the Accelerating Low Carbon Economy (ALCE) project.
References
[1] P. Kundur, Power System Stability and Control, 1994.
[2] F. Castellanos and A. F. Mohammed, "Voltage stability and reactive power compensation on the T&TEC system," in SoutheastCon, 2003. Proceedings. IEEE, 2003, pp. 134-139.
[3] I. Grau, L. M. Cipcigan, N. Jenkins, and P. Papadopoulos, "Microgrid intentional islanding for network emergencies," in Universities Power Engineering Conference (UPEC), 2009 Proceedings of the 44th International, 2009, pp. 1-5.
[4] Fazeli, A.; Christopher, E.; Johnson, C. M.; Gillott, M.; Sumner, M., "Investigating the effects of dynamic demand side management within intelligent Smart Energy communities of future decentralized power system," Innovative Smart Grid Technologies (ISGT Europe), 2011 2nd IEEE PES International Conference and Exhibition on , vol., no., pp.1,8, 5-7 Dec. 2011
[5] A. Fazeli , Sumner, M, Johnson, C M, Christopher, E,, "Coordinated Optimal Dispatch of Distributed Energy Resources within a Smart Energy Com-munity Cell," presented at the 2012 3rd IEEE PES Innovative Smart Grid Technologies Europe Berlin, 2012.
[6] I. Richardson, M. Thomson, D. Infield, and C. Clifford, "Domestic electricity use: A high-resolution energy demand model," Energy and Buildings, vol. 42, pp. 1878-1887, 2010.
[7] P. J. Lagace, M. H. Vuong, and I. Kamwa, "Improving power flow convergence by Newton Raphson with a Levenberg-Marquardt method," in Power and Energy Society General Meeting - Conversion and Delivery of Electrical Energy in the 21st Century, 2008 IEEE, 2008, pp. 1-6.
[8] I. Richardson, "Integrated high-resolution modelling of domestic electricity demand and low voltage electricity distribution networks," PhD, Electrical and electronic engineering, Loughborough, 2011. [9] Y. Kumar, K. Dwivedi, and G. Agnihotri, "Development of Ant
Algorithm for load flow analysis," in Power Systems Conference and Exposition, 2009. PSCE '09. IEEE/PES, 2009, pp. 1-5.
[10] D. Bhujel, B. Adhikary, and A. K. Mishra, "A Load Flow Algorithm for Radial Distribution System with Distributed Generation," in
Sustainable Energy Technologies (ICSET), 2012 IEEE Third International Conference on, 2012, pp. 375-380.
[11] T. L. Vandoorn, J. D. M. De Kooning, B. Meersman, and L. Vandevelde, "Soft curtailment for voltage limiting in low-voltage networks through reactive or active power droops," in Energy Conference and Exhibition (ENERGYCON), 2012 IEEE International, 2012, pp. 545-550.
[12] Y. Vencken, W. Labeeuw, and G. Deconinck, "Dealing with an overdose of photovoltaics at distribution level," in PowerTech (POWERTECH), 2013 IEEE Grenoble, 2013, pp. 1-5.
[13] eon, "Cables, Cable Laying & Accessories Manual " 2006. [14] e. o. c. networks, "Network Design Manual."