ISSN Print: 2152-7180
DOI: 10.4236/psych.2019.1015136 Dec. 27, 2019 2115 Psychology
Nicomachus-Positive Parenting (NPP):
Development and Initial Validation of a
Parenting Questionnaire within the Positive
Psychology Framework
Theodoros A. Kyriazos, Anastassios Stalikas
Department of Psychology, Panteion University, Athens, Greece
Abstract
After operationalizing the positive psychology parenting construct, following the model proposed by Seligman in Authentic Happiness, a new question-naire called NICOMACHUS-Positive Parenting (NPP) was developed and validated. The validation process was completed in three studies. In Study 1 (N = 190) theoretically, relevant items were reduced, refined, and tested re-sulting in a measure with 20 items. In Studies 2 (N = 621) and 3 (N = 146) the psychometrics of NICOMACHUS were validated and cross-validated respectively. A clear, robust four-factor structure was defined and confirmed with EFA and CFA respectively. Full measurement invariance across the child’s gender was successfully established to the strict level. Internal consis-tency reliability (α), model-based reliability (ω) and convergent validity at the model level (AVE) were excellent and comparable across methods. Con-vergent/discriminant validity with 6 parenting measures revealed a highly significant, uniform relationship pattern. In Study 3 the above findings were suc-cessfully cross-validated by stable, similar findings. Convergent/discriminant va-lidity with 5 measures of wellbeing and affect also revealed a highly signifi-cant, clear relationship pattern. The relationship of NICOMACHUS with demographics was also examined. NICOMACHUS adds to the existing pa-renting measures, allowing parents to evaluate if their papa-renting practices follow the principles of Positive Psychology.
Keywords
Parenting, Positive Parenting, Positive Psychology, Wellbeing, Test Construction, Test Development, Test Validation, Psychometrics, Greece
How to cite this paper: Kyriazos, T. A., & Stalikas, A. (2019). Nicomachus-Positive Parenting (NPP): Development and Initial Validation of a Parenting Questionnaire within the Positive Psychology Framework. Psychology, 10, 2115-2165.
https://doi.org/10.4236/psych.2019.1015136 Received: November 2, 2019
Accepted: December 24, 2019 Published: December 27, 2019
Copyright © 2019 by author(s) and Scientific Research Publishing Inc. This work is licensed under the Creative Commons Attribution International License (CC BY 4.0).
http://creativecommons.org/licenses/by/4.0/
DOI: 10.4236/psych.2019.1015136 2116 Psychology
1. Introduction
Seligman (2002), meticulously described a model of parenting effectiveness,
based on the principles of Positive Psychology. Despite that, to the best of our knowledge, this parenting model received less attention than the rest of the Au-thentic Happiness model components (2002). To hopefully promote research in this area, a first step would be developing a new measure of Positive Psychology parenting, operationalizing this Authentic Happiness parenting model
(Selig-man, 2002). Therefore, the purpose of this study is to describe the development
and validation of a new measure of Positive Psychology Parenting (Nicoma-chus-Positive Parenting or NPP).
1.1. Definitions of Terms Used
A Parent is a person with whom a child has a long-term, unique and
irreplacea-ble biological, social and emotional bond (Tobach & Schneirla, 1968;Rohner,
Khaleque, & Cournoyer, 2012).
A family is a group of interacting people with a similar intention (Conoley &
Conoley, 2009; Conoley, Conoley, & Pontrelli, 2014) or an open system of
people (von Bertalanffy, 1976). Family systems are grounded on the General Systems Theory (von Bertalanffy, 1976), suggesting that families are studied more effectively when taking into account member interactions and environ-mental effects(Whiteman et al., 2011).
Parenting is a bidirectional, biological and social process(Tobach & Schneirla,
1968) between members of at least two generations within a specific cultural
context (Ford & Lerner, 1992;Lerner, Rothbaum, Boulos, & Castellino, 2002).
Positive Psychology. Martin Seligman, as APA president announced the
Posi-tive Psychology movement on August 21, 1999 (Seligman & Csikszentmihalyi,
2000) for the empirical study of “what makes life worth living” (Peterson, 2013;
Seligman, 2011). The purpose of Positive Psychology is to study all factors
con-tributing to human flourishing on both a personal and a community level(Gable
& Haidt, 2005; Linley & Joseph, 2015). Positive Psychology brought about a
change in the outlook of “psychology as usual” (Seligman & Pawelski, 2003;
Hefferon & Boniwell, 2011;Seligman, Railton, Baumeister, & Sripada, 2016) that
can also affect parenting practices(Seligman, 2002).
Character strengths are a sub-category of personality attributes having moral
value, e.g. politeness as opposed to introversion which has no moral dimension
(Peterson & Park, 2009). Fredrickson defines character strengths as habits
(Fre-drickson, 2009). The most frequently used strengths are called signature
strengths (measured with Values in Action Inventory of Strengths, Peterson &
Seligman, 2004).
Positive emotions here are used within the Broaden and Built theoretical
framework (Fredrickson, 1998, 2001). After two decades of extensive research there is a top-ten of positive emotions: joy, gratitude, serenity, interest, hope, pride, fun, inspiration, awe and love(Fredrickson, 2009; Hefferon & Boniwell,
DOI: 10.4236/psych.2019.1015136 2117 Psychology Well-being is a positive evaluation of one’s own life(Seligman, 2002;Diener &
Seligman, 2004), while Ryan & Deci (2001) and Seligman (2002; Seligman &
Csikszentmihalyi, 2000) link well-being with optimum experience (Flow;
Csiks-zentmihalyi, 1990) and psychological functioning (Mitchell, Vella-Brodrick, &
Klein, 2010).
Flourishing is a state of positive mental health where the person is both feeling well and doing well in personal and social level, free from mental illness (Keyes,
2002;Fredrickson & Losada, 2005;Seligman, 2011).
1.2. The Positive Psychology Parenting and the Model behind
NICOMACHUS
For Seligman (2002), parenting offers parents the chance to: 1) Apply the
prin-ciples of Positive Psychology; 2) Increase the level of positive emotions to the child; 3) Discover strengths and signature strengths and then nurture these signa-tures strengths; 4) To increase the well-being of the child and the entire family 5) Forge a child’s life around his/her signature strengths as a means of balancing his/her weaknesses and flourishing. According to Seligman (2002), two core ele-ments that enable children to flourish are: 1) positive emotions as described within the Broaden and Build Theory (Fredrickson, 1998, 2001), and 2) the character strengths(Seligman & Csikszentmihalyi, 2000;Peterson & Seligman, 2004). These are the two pillars of positive psychology parenting (Seligman, 2002). Seligman
(2002)implicitly adopts the systemic view on parenting and family(von
Bertalanf-fy, 1976), placing them in the center of a wide interactive relationship pattern with
environment factors (like school, job, hobbies, marital and social relations). The environment contributes to personal and family wellbeing (as a part of the good life; see also Seligman, 2004) on certain conditions: abundant positive emotions in the parent-child relationship and the use of strengths in all realms of child life.
The proposed model of positive psychology parenting as defined by
Se-ligman (2002) (see alsoKyriazos & Stalikas, 2018a).
Seligman (2002) postulates the three fundamental principles of Positive
Psy-chology Parenting (see Table 1).
The three principles (Table 1) are integrated into a model of positive psy-chology parenting (Seligman, 2002). This model is essentially focused on build-ing child positive emotions first and then tracbuild-ing and in turn nurturbuild-ing charac-ter strengths (see Figure 1):
Table 1. The three principles of positive psychology parenting in the authentic happiness model by Seligman (2002).
Principle 1 Positive emotions broaden and buildemotional and physical resources on which children can rely when in adversity. (Fredrickson, 1998, 2001)cognitive, social,
Principle 2 Increasing positive emotions in children can initiate upward spirals of positive emotions according to the Broaden and Build theory of Positive Emotions(Fredrickson, 1998, 2001).
DOI: 10.4236/psych.2019.1015136 2118 Psychology Figure 1. The proposed model of positive psychology parenting as defined by Seligman (2002). Source: Kyriazos & Stalikas, 2018a.
1) Until the age of six, parenting is primarily oriented on the increase of a child’s positive emotions, by showing abundant and unconditional love and ac-ceptance.
2) Then positive emotions through their broadening effect (Fredrickson, 1998,
2001)boost exploration, creativity, and resourcefulness. This function has secure
attachment as a prerequisite(Bowlby, 1969, 1973;Ainsworth et al., 1978). 3) Through exploration and creativity skills, abilities gradually emerge, even-tually generating more positive emotions (i.e. an upward spiral; Fredrickson,
1998, 2001).
4) This recurrent process of acquiring mastery nurtures strengths and values that appear along the way. To this end, when a new character strength or value appears, parents should praise, name and encourage the child (positive rein-forcement). This process is generally more effective if parents act also as a role model (Bandura, 1977;Huta, 2012).
5) With positive reinforcement, strengths become a potential source of posi-tive emotions for the child (love, support, interest, or praise). Consequently, in an attempt to receive more positive emotions, the child will eventually use the strength again. During this recurring process, some attempts will be more suc-cessful than others.
6) Eventually, a child will abandon strengths that triggered a failure and will repeat those triggering successful attempts. Typically, by the age of six, a child will start using some of the successful strengths more often than others. These are signature strengths candidates.
7) Finally, certain strengths and values will consistently be repeated more fre-quently and successfully than others. These will probably be the signature strengths of the child.
8) Parents should build the child’s education, skills, activities and ideally fu-ture career around his/her signafu-ture strengths. In this way, the chances of achieving long-lasting, eudemonic well-being are higher.
DOI: 10.4236/psych.2019.1015136 2119 Psychology
they boost their own flourishing.
Preconditions for the Positive Psychology parenting model implementation Nevertheless, for the above parenting model to take place, basic parenting tasks must be effectively carried out. These parenting tasks are (Bradley &
Cald-well, 1995; Bradley, 2002): 1) sustenance (survival, safety, and basic biological
needs satisfaction), 2) cognitive and socioemotional stimulation, 3) support, 4) structure, and 5) surveillance. Sustenance, stimulation and support stem from basic needs postulated by Maslow’s Hierarchy of needs (1975), as commented by
Bradley (2002) (see also Ford & Lerner, 1992). Structure and surveillance help
parents to meet the child’s needs contingently(Bradley, 2002).
Crucially, the well-being literature (Ryan & Deci, 2000;Ryff, 2014;Seligman, 2011)
also supports the assumption that the basic psychological needs—competence, au-tonomy, and relatedness—must be supported to achieve overall wellbeing (Self-determination theory, Ryan & Deci, 2000; see also Wehmeyer & Little,
2009; Boniwell, 2012). See Table 2 for a summary of the conditions of Positive
Psychology Parenting.
Differences of Positive Psychology Parenting from the Positive Parenting “as usual”(Kyriazos & Stalikas, 2018a)
In parenting literature, the term “positive” is simultaneously used by two pa-renting frameworks, in parallel with positive psychology papa-renting (Kyriazos &
Stalikas, 2018a): 1) positive discipline(Durrant, 2011;Nelsen, 2006) and 2)
posi-tive parenting (e.g. Sanders, 2012). Nevertheless, both positive discipline and positive parenting use the term “positive” to describes non-punitive parenting practices (Durrant, 2011; Sanders, 2012), or “firm and kind” parenting style
(Nelsen, 2006). Crucially, within the positive psychology approach, the term
“positive” refers to the broadening and building effect of positive emotions
(Fredrickson, 1998, 2001). Apart from this difference, two additional differences
between the two above theories from Positive psychology parenting are
[image:5.595.214.538.536.713.2](Kyria-zos & Stalikas, 2018a): 1) the target population of the positive discipline and
Table 2. Conditions for positive psychology parenting to potentially come about.
Meeting necessary conditions
for Positive Psychology Parenting Meeting sufficient conditions for Positive Psychology Parenting
Effectiveness in the following parental tasks:
Sustainability (survival and biological
integrity)
Secure Environment
Surveillance
Stimulation (cognitive & social-emotional)
Support
Structure
Satisfactory marital relationship
(Bradley & Caldwell, 1995;Bradley, 2002;
Maslow, 1975;Belsky, 1984;
Seligman, 2002)
Effectiveness both in prerequisites and in the following practices (Seligman, 2002):
Abundant and unconditional positive
emotions
Identification of Strengths Identification of Values Nurturing Strengths Nurturing Values
Finding child’s signature strengths
Make sure child is using signature strengths Building child’s life around signature
strengths (play, marriage, carrier, community)
DOI: 10.4236/psych.2019.1015136 2120 Psychology
positive parenting is mainly (but not exclusively) children of special challenges, 2) their purpose is mainly prevention and treatment. The differences are sum-marized in Table 3. Of course, this does not imply that the above theoretical frameworks less effective, they simply use a different perspective from positive psychology (Seligman & Csikszentmihalyi, 2000). In sum, the differences are equivalent to the differences of “psychology as usual” (Seligman & Pawelski,
2003) from positive psychology (see also Kyriazos & Stalikas, 2018a).
The Present study
The purpose of this study is the development and validation of a self-report measure of Positive Psychology Parenting (NICOMACHUS-Positive Parenting, NPP), based on the model postulated by Seligman (2002).
2. Study 1: Test Development & Pilot Testing
The purpose of this study was: 1) to develop an item pool, 2) to carry out item analysis and Principle Components Analysis (PCA) in the final pool after pi-lot-testing it (N = 190).
Study 1 Method Participants
The sample comprised by 190 parents from Greece (61% females) with at least one child aged 7 - 13 years, raising 1 - 3 children per family. Most parents (70%) were >40 years old, 28% were 26 - 40 years old and 2% < 25 years old. The 4/5 of the parents were married (80%), 13% endorsed “Other” and 7% were living to-gether with their partner. Most pants had a B.A. or higher (72%), 24% had fi-nished high school, and 4% junior high school or lower. Almost half of the sam-ple (49%) had an annual family income from 20.001€ - 50.000€, 29% from 10.001€ - 20.000€, 12% < 10.000€ and 10% from 50.001€ - 100.000€. Two of the parents had a child with a serious health problem, and one parent was caring for a child with special needs. Almost all of them (99%) had a Greek nationality.
Measures
[image:6.595.57.544.556.718.2]Nicomachus-Positive Parenting (NPP)
Table 3. Comparison of positive discipline, positive parenting and positive psychology parenting.
Positive Discipline Positive Parenting Positive Psychology Parenting
Goal Prevention & Treatment Prevention & Treatment Flourishing
Jahoda (1958)model goal Move from −2 to zero (no mental disease) Move from −2 to zero (no mental disease) Move from 0 to as high as possible
Target Group Cases with special challenges Special & General population General population
Family level impact No unpleasant parent-child interactions family environment Low-conflict Good/meaningful life for the whole family
“Positive” means Non-violent, non-punitive parenting or Kind & Firm parenting non-maltreating parenting Non-violent, Broadening and building effect Positive emotions and their proposed by Fredrickson (2001)
(Durrant, 2011;Nelsen, 2006) (Sanders, 2012) (Seligman, 2002)
DOI: 10.4236/psych.2019.1015136 2121 Psychology
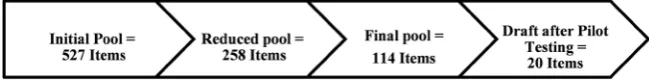
The final Pool of the Nicomachus-Positive Parenting (NPP) was used (114 items). The final pool emerged from an iterative process of discarding items, from an initial pool of 527 items. All items were developed for parents caring for children 7 - 13 years, and they were designed for a 5-point Likert scale (1 = Ab-solutely Untrue, 2 = Mostly Untrue, 3 = Can’t Say True or Untrue, 4 = Mostly True, 5 = Absolutely True). The questionnaire is available in Appendix.
The process of pool reduction
Specifically, based on the Positive Parenting Model (Seligman, 2002) described in the Introduction section an initial item pool was created by 1) pulling items from several existing parenting scales (265 items) or items from positive psychology scales, adaptable for parenting (120 items); 2) translating descriptive statements contained in the Authentic Happiness (Seligman, 2002) into items (45 items); 3) writing items based on core premises of positive psychology (22 items); 4) adapting for parenting 75 items from the Values in Action Inventory of Strengths for Youth (VIA Youth, Peterson & Seligman, 2004;Park & Peterson, 2006).
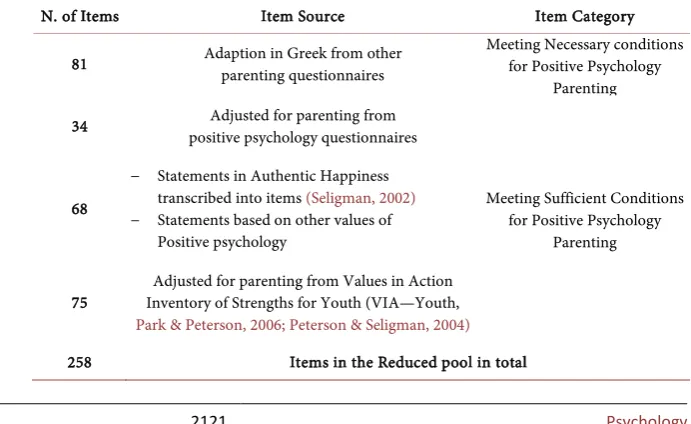
This initial pool (527 items) was examined more closely. After (1) writing ad-ditional items from descriptive statements in Authentic Happiness (2002) and (2) removing similar, redundant, ambiguous, irrelevant and poorly worded items, a 258-item pool was drafted (258 items). All items were arranged in two major categories with several sub-categories: 1) Meeting necessary conditions for Positive Psychology Parenting and 2) Meeting sufficient conditions for Positive Psychology Parenting (see Introduction and Kyriazos & Stalikas, 2018a for a more elaborate discussion). The item distribution of this 258-item pool is pre-sented in Table 4.
[image:7.595.193.539.536.748.2]Subsequently, experts with a Phd (1 female, 2 males) specialized in positive psychology (1 expert), or psychology and pedagogics (2 experts) reviewed the 258-item pool to evaluate content validity. For this purpose, they initially re-ceived a definition of the positive psychology parenting and a description of the
Table 4. Item allocation of the pool before reviewing by expert panel and focus group (258-item pool).
N. of Items Item Source Item Category
81 Adaption in Greek from other parenting questionnaires Meeting Necessary conditions for Positive Psychology Parenting 34 positive psychology questionnaires Adjusted for parenting from
Meeting Sufficient Conditions for Positive Psychology
Parenting 68
− Statements in Authentic Happiness transcribed into items (Seligman, 2002)
− Statements based on other values of Positive psychology
75 Inventory of Strengths for Youth (VIA—Youth, Adjusted for parenting from Values in Action
Park & Peterson, 2006;Peterson & Seligman, 2004)
DOI: 10.4236/psych.2019.1015136 2122 Psychology
model proposed (Seligman, 2002, see Introduction section) along with the 258-item pool (listing item, item source and item dimension). Experts offered feedback on the following: 1) relevancy of each item on a relevancy scale (1 = not at all relevant, 2 = probably relevant, 3 = relevant, 4 = extremely relevant); 2) clarity of each item on a clarity scale (1 = not at all clear, 2 = probably clear, 3 = clear, 4 = extremely clear); 3) omitted dimensions of positive parenting with narrative comments for each item, if necessary.
Then a focus group with parents was held (N = 10, 4 males, 6 females) to eva-luate the face validity of the 258-item pool in non-experts of the target popula-tion. The focus group initially received a simplified definition of the positive psychology parenting (see Introduction section, Seligman, 2002) and the 258-item pool (listing item and item dimension). Then, focus group participants were asked to rate items over two scales: 1) A usefulness scale (1 = not at all use-ful, 2 = probably useuse-ful, 3 = useuse-ful, 4 = extremely useful) was employed, 2) a clarity scale (1 = not at all clear, 2 = probably clear, 3 = clear, 4 = extremely clear). A series of probes followed to get participants discuss the items. Probes included: 1) Did you understand the questions? 2) What in your own words does this question mean to you? (when some item was referenced); 3) Was there any-thing important left out? (Oremus et al., 2005; Willis, 2005; cited in Morton,
Barling, Rhodes, Mâsse, Zumbo, & Beauchamp, 2011). All comments were listed.
Based on expert panel and focus group recommendations, an item was added about positive role-modeling(Bandura, 1977;Huta, 2012).
A final pool was drafted by keeping items rated both by an expert panel and focus group as 3 (useful/clear/relevant) or 4 (extremely useful/clear/relevant). Regarding scaling, items were rated on a 5-point Likert scale, (1 = Absolutely Untrue, 2 = Mostly Untrue, 3 = Can’t Say True or Untrue, 4 = Mostly True, 5 = Absolutely True), with anchors appearing only on the first and last point fol-lowing OECD (2013)guidelines. However, each anchor was described in the ini-tial instructions. All items rated the positivity of the parenting role (e.g. I make
sure my child is in a good mood, even when something is going wrong), with no
reverse-scored items. The final pool (114 items) was reexamined by the positive psychology expert and two parents to check if scale anchors and instructions were clear before pilot-testing it (see Results section). The item distribution of the final pool is shown in Table 5. See the iterative item reduction process in
Figure 2.
Procedure
DOI: 10.4236/psych.2019.1015136 2123 Psychology Table 5. Description of items in the final pool (after expert panel review and focus group). This pool was pilot-tested.
N. of Items Item Source Item Category Item Sub-category
50 other parenting resources (6 questionnaires Translation in Greek and adaption from and 1 parenting program)*
− Meeting necessary conditions for Positive Psychology Parenting & − Meeting sufficient Conditions for
Positive Psychology Parenting
Basic needs, Child development, Structure, Affection, Communication, Realistic Expectations from the child etc.
45 Inventory of Strengths for Youth (VIA—Youth, Adjusted for parenting from Values in Action
Park & Peterson, 2006;Peterson & Seligman, 2004)
Meeting sufficient conditions for Positive Psychology Parenting
Cultivating VIA Strengths and Values (Transcendence, Courage,
Wisdom, Justice, Humanity, Temperance
19
− Statements in Authentic Happiness transcribed into items(Seligman, 2002)
− Statements based on other values of Positive psychology (e.g. Huta, 2012)**
Meeting sufficient conditions for Positive Psychology Parenting
Nurturing Positive Emotions, Identifying Strengths, Boosting
Strengths, Satisfaction from Parental Role etc.
Totals 114 Items in the Final Pool 2 major categories 46 Sub-categories
*Parenting Concerns Questionnaire (Sheppard, 2010); BASC-3 Parenting Relationship Questionnaire Sample Report (PsychCorp, 2015); Parenting Styles
and Dimensions Questionnaire (Robinson et al., 1995); Alabama Parenting Questionnaire (Frick, 1991); Perceptions of Parents Questionnaire (Pasquali et
al., 2012); Comprehensive Early Childhood Parenting Questionnaire (Verhoeven et al., 2017); Triple P parenting Program Principles (Triple-P International, 2014). **PERMA Model (Seligman, 2011), role-modeling and parenting styles (Huta, 2012).
Figure 2. The iterative item reduction process from the initial pool to the finalpool.
of NICOMACHUS. All the fields of the test battery were set as required. Stu-dents received extra credit for carrying out the recruitment process.
Research Design
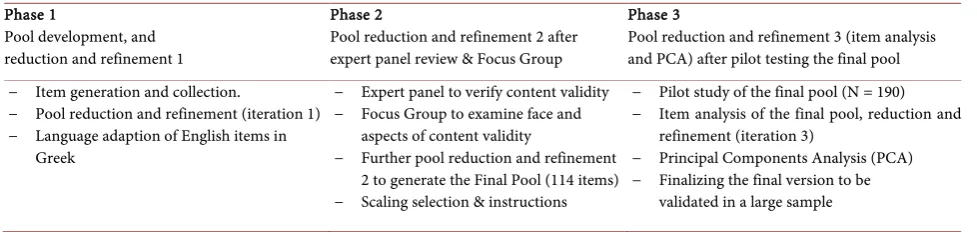
After the theoretical model of the questionnaire has been established (see In-troduction), the test development process described Study 1 is shown in Table 6.
Google Forms® hosted the electronic test battery. Data were analyzed with R software (R Development Core Team, 2019) with “psych” V1.8.12 (Revelle,
2019)package installed.
Study 1 Results
In order to eliminate non-response, all the fields of the digital form were set as “required”. Therefore, the dataset had no missing values.
Item analysis
Items with the following properties were eliminated(Singh et al., 2016): M < 2 and >4 (Jang & Roussos, 2007), SD < 1 (Jackson, 1970), Skewness > |2| and Kur-tosis > |7|(Curran et al., 1996), ITC < .25(Likert, 1932) or <.30 (Field, 2005). To ensure items were representing adequately the proposed theoretical model, items were subsequently reviewed and M and SD criteria were loosened for some items (M ≥ 4.4 and SD ≤ 0.8). In total, from this item reduction process, 94 items were eliminated, resulting in a pilot version of 20 items, subsequently going through a Principal Components Analysis (PCA).
[image:9.595.209.534.336.377.2]DOI: 10.4236/psych.2019.1015136 2124 Psychology Table 6. The test development process described in Study 1.
Phase 1
Pool development, and reduction and refinement 1
Phase 2
Pool reduction and refinement 2 after expert panel review & Focus Group
Phase 3
Pool reduction and refinement 3 (item analysis and PCA) after pilot testing the final pool − Item generation and collection.
− Pool reduction and refinement (iteration 1) − Language adaption of English items in
Greek
− Expert panel to verify content validity − Focus Group to examine face and
aspects of content validity
− Further pool reduction and refinement 2 to generate the Final Pool (114 items) − Scaling selection & instructions
− Pilot study of the final pool (N = 190) − Item analysis of the final pool, reduction and
refinement (iteration 3)
− Principal Components Analysis (PCA) − Finalizing the final version to be
validated in a large sample
The purpose of the PCA was mainly to examine total explained variance and not to conclude about the structure (Singh et al., 2016). Kaiser-Meyer-Olkin measure of sampling adequacy (Kaiser, 1974) was .902, and Bartlett’s test of sphericity (Bartlett, 1954) was significant, χ2 (190) = 2324.82, p < .01.
Subse-quently, PCA was carried out with oblique rotation, keeping all 20 items. Initially, the correlation matrix was evaluated. All the 20 items correlated ≥.30 with at least a second item and no item had a negative value. The total variance explained by the 4 extracted components was 66.84%. The inter-correlations of the 4 components ranged from .45 (component 2 with 4) to .50 (component 1 with 4). Internal consistency reliability was α = .91.
Study 1 Discussion
The purpose of Study 1 was to describe the item generation, pool reduction, refinement, and piloting following the model operationalization (Seligman,
2002;Kyrazos & Stalikas, 2018a), summarized in the Introduction section.
At first, an initial pool was established from: 1) existing scales with similar dimensions to the theoretical model of positive psychology parenting(Seligman,
2002,Kyrazos & Stalikas, 2018a), 2) scales of positive psychology adaptable for
parenting, 3) Transcribing Authentic Happiness(Seligman, 2002) content into items. This initial pool went through a refinement process and was reduced in about half. All items in English were adapted in Greek. Then to establish content validity it was reviewed by an expert panel. To establish face validity, a focus group was held. Half of the items were discarded based of the assessment of ex-perts and the target population. The final pool was drafted with the remaining items. This final pool subsequently went through pilot testing with the purpose of item analysis and PCA and final refinement of the items.
Items were screened for extreme response bias. Thus, items deviating normal-ity were rejected (Jang & Roussos, 2007;Curran et al., 1996;Finney & DiStefano,
2006;Barry & Finney 2008 as reported by Singh et al., 2016) and items with low
DOI: 10.4236/psych.2019.1015136 2125 Psychology
The 20 items subsequently went through a PCA: 1) to examine percent va-riance explained (Singh et al., 2016), and 2) to organize more effectively the forthcoming validation research (Barker et al., 2016). However, no decisions were made on the factor structure. KMO was above .90 and Bartlett test was sig-nificant. After examination of the correlation matrix, the correlations ranged within acceptable limits and there were no negative values indicating a homo-genous dataset(DeVellis, 2017). The pilot testing version contained 20 items in 4 components, explaining more than two thirds of the variance with excellent in-ternal consistency reliability. Therefore, no further refinements followed. Hen-ceforward, this version will be referred to as NICOMACHUS (NPP).
The next step is to validate the newly developed NICOMACHUS in a large scale study (Study 2).
3. Study 2: Evidencing Construct Validity
The purpose of this study was: 1) to establish construct the validity with EFA and CFA in a large sample; 2) to evaluate measurement invariance across child gender; 3) to evaluate internal consistency reliability and factor-based reliability; 4) to examine model-based convergent validity; 5) to establish the convergent and discriminant validity with other parenting measures and 6) to calculate normative data for the newly developed NICOMACHUS.
Study 2 Method Participants
The sample involved 621 Greek parents (75% of females), having at least one child from 7 to 13 years (M = 10.23 years, SD = 2.11, 54% females). The parents were 72% biological mothers, 24% biological fathers, and 4% endorsed “other”. Per family there were either 1 (32%), 2 (48%), 3 (15%) or more (5%) children. The majority of the parents (96%) were living in the same house with the child they completed the questionnaire for., and 96% of them cared for a child with no special needs (biological, mental or other). More than half of them (54%) were from 41 - 50 years, 28% from 31 - 40 years, 10% from 51 - 60, 7% from 21-30 and 1% were over 60 years old. Less than half of the participants (39%) had a B.A. or higher (20%), or they had finished high-school (36%) or lower (5%). The majority of the parents were working (84%), and had a Greek nationality (99%). Most parents (38%) had an annual income between 10,001 and 20,000€ or lower (21%) while 25% had an income between 20,001 and 30,000€ or higher (16%).
Measures
Nicomachus-Positive Parenting (NPP)
rang-DOI: 10.4236/psych.2019.1015136 2126 Psychology
ing from a minimum of 1 to a maximum of 5. The questionnaire is available in Appendix.
Alabama Parenting Questionnaire—Short Form (APQ-9, Elgar et al.,
2007)
APQ-9 is the shortest version of the original APQ-42 (Frick, 1991;Shelton et
al., 1996;Frick et al., 1999) containing nine items (e.g. You praise your child if
he/she behaves well). APQ evaluates parenting practices correlated with child disruptive behaviors (Shelton et al., 1996). Items are rated on a 5-point scale (1 =
never to 5 = always). Higher scores indicate a higher frequency of the parenting practice measured. Items are tapping three factors (Positive Parenting, Inconsis-tent Discipline, Poor Supervision) with 3 items each. A CFA suggested the 3-factor APQ structure is tenable, χ2(24) = 44.10, χ2/df = 1.84, RMSEA = .044,
CFI = .951, TLI = .926, SRMR = .043 (Kyriazos & Stalikas, 2019a). The internal consistency reliability in the current study was α = .63 (Positive Parenting), α = .68 (Inconsistent Discipline), α = .61 (Poor Supervision). Elgar et al. (2007)
reported an internal consistency, α = .59 to .84 and α = .57 to .62 in two validat-ing studies.
Parenting Behaviours and Dimensions Questionnaire (PBDQ; Reid,
Ro-berts, RoRo-berts, & Piek, 2015)
This relatively newly developed parenting measure contains 33 items of pa-renting behavior on six factors, i.e. Emotional Warmth (6 items), Punitive Dis-cipline (5 items), Autonomy Support (5 items), Permissive DisDis-cipline (6 items), Anxious Intrusiveness (6 items) and Democratic Discipline (5 items). The items (e.g. I recognize my child’s strengths and talents) are rated on a 6-point scale (from 1 = never to 6 = always). Possible scores range from 1 (lowest possible) to 6 (highest possible). A CFA confirmed this 6-factor structure with a good fit, χ2(465) = 826.86, χ2/df = 1.78, RMSEA = .042, CFI = .922, TLI = .912, SRMR
= .071 (Kyriazos & Stalikas, 2019b). For this dataset internal consistency reliabil-ity per factor was α = .85 (Emotional Warmth), α = .82 (Punitive Discipline), α = .77 (Anxious Intrusiveness), α = .79 (Autonomy Support), α = .69 (Permissive Discipline), α = .76 (Democratic Discipline). Similarly, PBDQ designers reported alpha coefficients from .66 to .83 (Reid et al., 2015).
Kansas Parental Satisfaction Scale (KPSS, James, Schumm, Kennedy,
Grigsby, Shectman, & Nichols, 1985).
KPSS is a 3-item scale of parental satisfaction. The items are rated on a 7-point Likert scale (1 = extremely dissatisfied, 7 = extremely satisfied). The score ranges from 3 (minimum parental satisfaction) to 21 (maximum parental satisfaction). To test this structure in the current ample, an EFA was carried out. Kaiser-Meyer-Olkin measure of sampling adequacy(Kaiser, 1970, 1974)was .71, and Bartlett’s test of sphericity (Bartlett, 1954)was significant (χ2 (3) = 687.06, p
consis-DOI: 10.4236/psych.2019.1015136 2127 Psychology
tency reliability for KPSS ranged from .78 to .95(Nitsch et al., 2015).
Parent Behavior Inventory (PBI; Lovejoy, Weis, O’Hare, & Rubin, 1999) PBI is measuring parenting behaviors. The 20 items (e.g. I thank or praise my child) are rated on a 6-point scale, from 0 = not at all true/I do not do this to 5 =
very true/I often do this. Higher scores indicate a higher frequency of the meas-ured behavior. Items tap two factors, the hostile/coercive factor, and the suppor-tive/engaged factor. A CFA confirmed this dual structure in the current sample, χ2(159) = 322.77, χ2/df = 2.03, RMSEA = .049, CFI = .925, TLI = .911, SRMR
= .069 (Kyriazos & Stalikas, 2019d). The internal consistency reliability of the CFA solution was α = .86 (supportive/engaged factor), and α = .81 (hos-tile/coercive factor). The developers (Lovejoy et al., 1999) reported an internal consistency of α = .83 (supportive/engaged factor) and α = .81 (hostile/coercive factor).
Parent Concerns Questionnaire (PCQ; Sheppard, 2010)
PCQ is a measure of child developmental or parental problems (Sheppard,
2010). PCQ has 37 items arranged on three domains (parenting capacity, child
development, family/environmental factors). Each item (e.g. I feel our/my phys-ical care of my children is not as good as it should be) is evaluated on a 3-point scale (0 = not present, 1 = present, 2 = severe), producing an aggregated score. Intervention by professionals may be necessary for problems rated as “severe”. In the current study this 3-dimensional theoretical structure was verified with a CFA, χ2(30) = 57.76, χ2/df = 1.93, RMSEA = .046, CFI = .965, TLI = .947, SRMR = .041 (Kyriazos & Stalikas, 2019e). Factor 1 (Child development problems) contained items 24, 25, 29, Factor 2 (Parenting Capacity problems) items 34, 35, 36, and Factor 3 (family/environmental problems) contained items 4, 10, 11, 12
(Kyriazos & Stalikas, 2019e). This 10-item PCQ version had alphas of .76 (Child
Development Problems), .71 (Parenting Capacity problems) and .77 (Fami-ly/Environmental Problems). The test developer (Sheppard, 2010) reported in-ternal consistency reliability of α = .89, .79, and .73 for the Child Development problems, Parenting Capacity problems and Family/Environmental problems respectively (for the full 37-item version).
Parental Stress Scale (PSS; Berry & Jones, 1995)
PSS is a measure of perceived parental stress with 20 items (e.g. The major source of stress in my life is my child) rated on a 5-point Likert scale (1 = “strongly disagree” to 5 = “strongly agree”). Higher scores suggest higher paren-tal stress. Items could be generally organized in two major domains (positive parenting and stressful parenting). Berry and Jones (1995: p. 470) found a 4-factor structure to “support the dichotomy of the parenting experience and the theoretical bases of the Parental Stress Scale”. In this study this theoretical di-chotomy of the PSS was confirmed with a CFA, χ2(72) = 148.86, χ2/df = 2.07,
RMSEA = .050, CFI = .951, TLI = .938, SRMR = .062 (Kyriazos & Stalikas,
2019f). Factor 1 (Positive Parenting Themes) comprised items 1, 5, 6, 7, 8, 17, 18
DOI: 10.4236/psych.2019.1015136 2128 Psychology
parenting themes, reversed scored) and α = .76 (stressful parenting themes).
Berry & Jones (1995) reported an overall alpha coefficient of .83.
Procedure
The procedure was similar to Study 1. In this study, 100 psychology students assisted in an online data collection, by recruiting at least 5 parents of children aged 7 - 13 years (M = 6.21). The test-battery had all fields set as “required”.
[image:14.595.160.533.433.743.2]Research Design
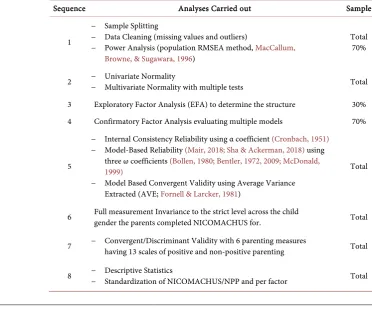
Table 7 present and overview of the analyses carried out in Study 2.
Google Forms® hosted the electronic test battery. Data were analyzed with R software (R Development Core Team, 2019). The following packages were in-stalled: “haven” V 2.1.1(Wickham, 2019a), “psych” V1.8.12(Revelle, 2019), “la-vaan” V0.6 - 4 (see Rosseel, 2012), “MVN” 5.7(Korkmaz, 2019), “caret” v6.0 - 84
(Kuhn, 2019), “knitr” V1.23 (Xie, 2019), “dplyr” v0.7.8 (Wickham, 2019b),
“tidyr” v0.8.3 (Wickham, 2019c), semPlot v1.1.1 (Epskamp, 2019), “semTools” v0.5-1 (Jorgensen, 2019).
Study 2 Results
The fields of the digital test-battery were set as “required”, so data contained no missing values. Three out of 621 cases were outliers, χ2 [20] = 45.31, p < .001
(Mahalanobis distance, Mahalanobis, 1936). However, outliers were included in the sample because minor differences were observed when comparing findings with and without outliers. The sample (N = 621) was split in two random sub-samples (nEFA = 187 and nCFA = 434). The cases to measured variables ratio for
Table 7. Research analyses overview in study 2.
Sequence Analyses Carried out Sample
1
− Sample Splitting
− Data Cleaning (missing values and outliers)
− Power Analysis (population RMSEA method, MacCallum, Browne, & Sugawara, 1996)
Total 70%
2 −− Univariate Normality Multivariate Normality with multiple tests Total
3 Exploratory Factor Analysis (EFA) to determine the structure 30%
4 Confirmatory Factor Analysis evaluating multiple models 70%
5
− Internal Consistency Reliability using α coefficient (Cronbach, 1951)
− Model-Based Reliability (Mair, 2018;Sha & Ackerman, 2018) using three ω coefficients (Bollen, 1980;Bentler, 1972, 2009;McDonald, 1999)
− Model Based Convergent Validity using Average Variance Extracted (AVE; Fornell & Larcker, 1981)
Total
6 Full measurement Invariance to the strict level across the child gender the parents completed NICOMACHUS for. Total
7 − Convergent/Discriminant Validity with 6 parenting measures having 13 scales of positive and non-positive parenting Total
DOI: 10.4236/psych.2019.1015136 2129 Psychology nEFA and nCFA (Costello & Osborne, 2005;Ullman, 2013) were 9:1 and 22:1
re-spectively.
The most complicated model tested was a 4-factor model with two error cova-riances. Power analysis for this model with the population RMSEA method
(MacCallum, Browne, & Sugawara, 1996;Hancock & Freeman, 2001)suggested
N ≥ 96 cases (RMSEA0 = .05, RMSEAα = .08, dfM = 162, power = .80, N = 621).
Univariate and Multivariate Normality
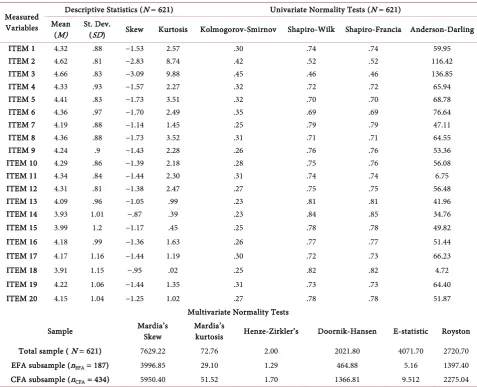
The Kolmogorov-Smirnov, Shapiro-Wilk, Shapiro-Francia and Ander-son-Darlingall tests of univariate normality were statistically significant (p < .001) for all 20 Nicomachus measured variables (Table 8). The Mardia’s mul-tivariate kurtosis test(Mardia, 1970), Mardia’s multivariate skewness test
(Mar-dia, 1970), Henze-Zirkler’s consistent test (Henze & Zirkler, 1990),
[image:15.595.59.537.323.710.2]Door-nik-Hansen omnibus test (Doornik & Hansen, 2008), E-statistic and Roston test were significant, p < .001 (Table 8).
Table 8. Descriptive Statistics, univariate normality tests and multivariate normality tests for each NICOMACHUS measured variable in the total sample and subsamples.
Measured Variables
Descriptive Statistics (N = 621) Univariate Normality Tests (N = 621)
Mean
(M) St. Dev. (SD) Skew Kurtosis Kolmogorov-Smirnov Shapiro-Wilk Shapiro-Francia Anderson-Darling
ITEM 1 4.32 .88 −1.53 2.57 .30 .74 .74 59.95
ITEM 2 4.62 .81 −2.83 8.74 .42 .52 .52 116.42
ITEM 3 4.66 .83 −3.09 9.88 .45 .46 .46 136.85
ITEM 4 4.33 .93 −1.57 2.27 .32 .72 .72 65.94
ITEM 5 4.41 .83 −1.73 3.51 .32 .70 .70 68.78
ITEM 6 4.36 .97 −1.70 2.49 .35 .69 .69 76.64
ITEM 7 4.19 .88 −1.14 1.45 .25 .79 .79 47.11
ITEM 8 4.36 .88 −1.73 3.52 .31 .71 .71 64.55
ITEM 9 4.24 .9 −1.43 2.28 .26 .76 .76 53.36
ITEM 10 4.29 .86 −1.39 2.18 .28 .75 .76 56.08
ITEM 11 4.34 .84 −1.44 2.30 .31 .74 .74 6.75
ITEM 12 4.31 .81 −1.38 2.47 .27 .75 .75 56.48
ITEM 13 4.09 .96 −1.05 .99 .23 .81 .81 41.96
ITEM 14 3.93 1.01 −.87 .39 .23 .84 .85 34.76
ITEM 15 3.99 1.2 −1.17 .45 .25 .78 .78 49.82
ITEM 16 4.18 .99 −1.36 1.63 .26 .77 .77 51.44
ITEM 17 4.17 1.16 −1.44 1.19 .30 .72 .73 66.23
ITEM 18 3.91 1.15 −.95 .02 .25 .82 .82 4.72
ITEM 19 4.22 1.06 −1.44 1.35 .31 .73 .73 64.40
ITEM 20 4.15 1.04 −1.25 1.02 .27 .78 .78 51.87
Multivariate Normality Tests
Sample Mardia’s Skew Mardia’s kurtosis Henze-Zirkler’s Doornik-Hansen E-statistic Royston
Total sample ( N = 621) 7629.22 72.76 2.00 2021.80 4071.70 2720.70
EFA subsample (nEFA = 187) 3996.85 29.10 1.29 464.88 5.16 1397.40
CFA subsample (nCFA = 434) 5950.40 51.52 1.70 1366.81 9.512 2275.04
DOI: 10.4236/psych.2019.1015136 2130 Psychology
Exploratory Factor Analysis (nEFA = 187)
The factorability of the correlation matrix was at first examined. NICOMACHUS inter-item correlations were ≥.30. Kaiser-Meyer-Olkin measure of sampling adequacy(Kaiser, 1970, 1974) was .91, and Bartlett’s test of
spheric-ity(Bartlett, 1954) was significant (χ2 (190) = 2216.349, p < .01). The diagonals
of the anti-image correlation matrix were >.50. Given the above factorability in-dications, EFA was carried out with all 20 NICOMACHUS items.
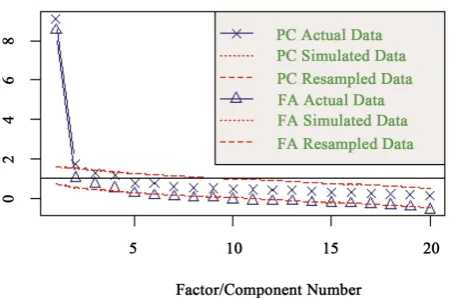
Factors were extracted with Principal Factor extraction with oblique rotation. Number of factors to retain was examined with the scree plot (Cattell, 1978), Parallel Analysis (PA; Horn, 1965), Minimum Average Partial Correlations (MAP; Velicer, 1976), and lowest possible Bayesian information criterion (BIC;
Schwartz, 1978) and the goodness of model fit. The EFA goodness of model fit
was evaluated with the Root Mean Square Error of Approximation (RMSEA;
Steiger & Lind, 1980), Root Mean Square of Residuals (RMSR), Comparative Fit
Index (CFI; Bentler, 1990), Tucker-Lewis Index (TLI; Tucker & Lewis, 1973) and Bayesian information criterion (BIC; Schwartz, 1978). Fit criteria (Hu & Bentler,
1999;Browne & Cudeck, 1993) were RMSEA ≤ .06 [90% Confidence Intervals
≤ .06], RMSR ≤ .0448 (Kelley’s criterion; Kelley, 1935; Harman, 1962;
Lore-zo-Seva & Ferrando, 2013) CFI and TLI ≥ .95, and lowest possible BIC.
PA suggested four factors (Figure 3). The Velicer MAP achieved a minimum of 0.02 with 4 factors and BIC achieved a minimum of −373.58 with 4 factors. Considering the above findings, 4 factors were extracted (total explained va-riance = 66.35%). The first factor explained 45.35% of the vava-riance, the second 8.65%, the third 6.5% and the four-factor 5.85% with communalities > .47. This 4-factor model had an acceptable fit, RMSR = .030, TLI = .931, RMSEA = .078 [90% CI .06, .087] and BIC = −373.53.
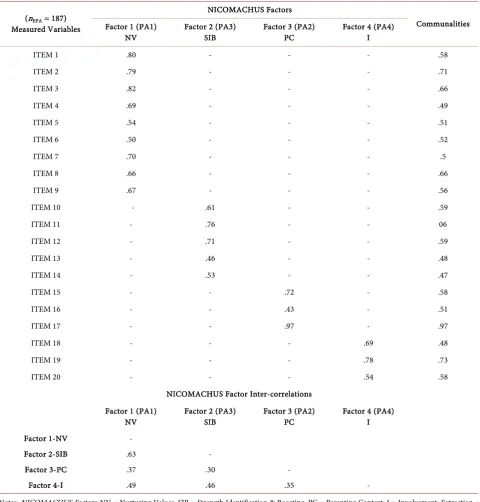
[image:16.595.262.488.557.706.2]Items 1 - 9 loaded on the first factor with loadings ranging from .50 to .82. Items 10 - 14 loaded on the second factor with loadings from .46 to .76. Items 15 - 17 loaded on the third factor with loadings ranging from .43 to .97. Items 18 - 20 loaded on the fourth factor with loadings ranging from .54 to .78. There were
DOI: 10.4236/psych.2019.1015136 2131 Psychology
no cross-loadings. After item inspection, the first factor was named Nurturing Values (NV), the second factor Strength Identification & Boosting (SIB), the third-factor Parenting Context (PC), and the fourth factor was called Involve-ment (I). The range of the factor loadings in all four factors was from .43 to .97. Factor inter-correlations ranged from .30 to .63. Table 9 contains the factor loadings above .30, communalities and factor inter-correlations (also presented
[image:17.595.58.539.207.710.2]in Figure 4).
Table 9. EFA factor loadings, communalities and factor inter-correlations of NICOMACHUS.
(nEFA = 187)
Measured Variables
NICOMACHUS Factors
Communalities Factor 1 (PA1)
NV Factor 2 (PA3) SIB Factor 3 (PA2) PC Factor 4 (PA4) I
ITEM 1 .80 - - - .58
ITEM 2 .79 - - - .71
ITEM 3 .82 - - - .66
ITEM 4 .69 - - - .49
ITEM 5 .54 - - - .51
ITEM 6 .50 - - - .52
ITEM 7 .70 - - - .5
ITEM 8 .66 - - - .66
ITEM 9 .67 - - - .56
ITEM 10 - .61 - - .59
ITEM 11 - .76 - - 06
ITEM 12 - .71 - - .59
ITEM 13 - .46 - - .48
ITEM 14 - .53 - - .47
ITEM 15 - - .72 - .58
ITEM 16 - - .43 - .51
ITEM 17 - - .97 - .97
ITEM 18 - - - .69 .48
ITEM 19 - - - .78 .73
ITEM 20 - - - .54 .58
NICOMACHUS Factor Inter-correlations Factor 1 (PA1)
NV Factor 2 (PA3) SIB Factor 3 (PA2) PC Factor 4 (PA4) I
Factor 1-NV -
Factor 2-SIB .63 -
Factor 3-PC .37 .30 -
Factor 4-I .49 .46 .35 -
DOI: 10.4236/psych.2019.1015136 2132 Psychology Figure 4. Factor loadings of each factor for the 4-factor model emerging from EFA.
Confirmatory Factor Analysis (nCFA = 434)
The Robust Maximum Likelihood was used to estimate parameters (MLR; see
Yuan & Bentler, 2000). Goodness of fit was assessed with RMSEA ≤ 0.06,
RMSEA 90% CI ≤ 0.06, SRMR ≤ 0.08, CFI ≥ 0.95, TLI ≥ 0.95 (Hu & Bentler,
1999;Browne & Cudeck, 1993;Brown, 2015), Chi-square/df ratio < 3 (seeKline,
2010, 2016) Akaike information criterion (AIC; Akaike, 1987) and BIC (the
low-er the bettlow-er, Mair, 2018).
Four models were specified: 1) MODEL A was a single-factor model with all 20 NICOMACHUS items in one factor to test the maximum parsimony assump-tion (Brown, 2015); 2) MODEL B was a first-order, Independent Cluster CFA Model (ICM-CFA; Marsh et al., 2014,Howard et al., 2016) with two correlated factors. Factor 1 contained Items 1 - 14 and Factor 2 contained items 15 - 20; 3) Model C was a first-order ICM-CFA model with four correlated factors. Factor 1 had items 1 - 9, Factor 2 items 10 - 14, Factor 3 items 15 - 17 and Factor 4 had items 18 - 20; 4) Model D was a variation of MODEL C with two error cova-riances added, i.e. in item 2 with item 3 and in item 13 with item 14.
Regarding the model fit, the assumption of maximum parsimony was rejected (MODEL A). The two-factor ICM-CFA model also had a poor fit (MODEL B). The 3-factor model (MODEL C) had a good fit, with all fit statistics, factor load-ings and factor correlations within the acceptable levels. MODEL D had an even better fit with all fit indexes, and factor loadings factor loadings and factor cor-relations within and far above the expected limits. The fit statistics and the stan-dardized loadings of all the models are presented in Table 10 and the path of MODEL C in Figure 5.
Measurement Invariance
The full measurement invariance was evaluated across the gender of the child to the strict level. The nested models were compared with ΔCFI ≤ .01 (Cheung &
Rensvold, 2002;Chen, 2007)and ΔRMSEA ≤ .015(Chen, 2007).
DOI: 10.4236/psych.2019.1015136 2133 Psychology Table 10. Goodness of fit measures, factor Loadings and Inter-correlations for the NICOMACHUS Models specified in the CFA.
N = 434 Model
RMSEA
90% CI Factor Loadings Inter-correlations Factor
χ2* Df χ2/df CFI TLI RMSEA Lower Higher SRMR BIC AIC Range
MODEL A
Single factor 1115.73 170 6.56 .817 .795 .095 .090 .099 .071 28,432.86 28,255.60 .397 - .836 -
MODEL B 2-factors
(F1 + F2, F3 + F4) 975.15 169 5.77 .844 .824 .088 .083 .092 .063 28,232.88 28,051.20 F1 + F2 .590 - .844 F3 + F4 .523 - .714 .789
MODEL C
4-factors 466.36 164 2.84 .941 .932 .054 .049 .060 .060 27,578.38 27,374.54
F1 .657 - .858 F2 .647 - .801 F3 .589 - .894 F4 .581 - .812
F1 - F2 .813 F1 - F3 .479 F1 - F4 .714 F2 - F3 .434 F2 - F4 .674 F3 - F4 .416
MODEL D 4-factors With
Cov. Errors 324.61 162 2.00 .969 .963 .040 .035 .046 .058 27,405.61 27,192.90
F1 .673 - .828 F2 .594 - .816 F3 .589 - .894 F4 .581 - .813
F1 - F2 .814 F1 - F3 .477 F1 - F4 .721 F2 - F3 .442 F2 - F4 .681 F3 - F4 .416 Note: * p < .001. Estimator = MLR; Bold typeface indicates models with optimal fit.
Table 11. (a) Goodness-of-Fit measures for the Baseline model for testing measurement invariance across child gender; (b) Nested models Comparison to validate full measurement invariance across the child gender of the parents. (a) Baseline Model fit (N = 621, 337 girls & 284 boys); (b) Nested models Comparison.
(a)
Models Chi-Square Value Chi-Square df Chi-square/df CFI TLI RMSEA RMSEA CI 90% SRMR
Lower Higher
GIRLS MODEL
4-factors correlated 375.78 164 2.29 .935 0.925 .062 .055 .069 .063
BOYS MODEL
4-factors correlated 327.16 164 1.99 .926 0.915 .059 .051 .068 .069
(b)
Models Chi-Square Df CFI RMSEA Model comparison ΔCFI ΔRMSEA
Full Configural
invariance 466.36 164 .941 .054 - - -
Full Weak invariance 714.16 344 .932 .059 Model 2 vs 1 −.009 .005
Full Strong invariance 742.20 360 .930 .058 Model 3 vs 2 −.002 −.001
Full Strict. invariance 759.45 380 .931 .057 Model 4 vs 3 .001 −.001
Note: Estimator = MLR.
comparison, the strong to weak model comparison and the strict to strong mod-el, comparison yielded ΔCFIs and ΔRMSEAs below the non-invariance cutoffs
[image:19.595.60.540.433.654.2]DOI: 10.4236/psych.2019.1015136 2134 Psychology Figure 5. Path diagram of the four factor model with 4 correlated factors estimated in the 70% of the sample in study 2.
Internal Consistency Reliability, Model-Based Reliability, and Validity Generally, a value of Cronbach’s alpha coefficient ≥ .70 is generally considered acceptable and the same is true for Omega coefficient (Hair et al., 2010). Average Variance Extracted (AVE;Fornell & Larcker, 1981) ≥ .50 are satisfactory
DOI: 10.4236/psych.2019.1015136 2135 Psychology
1951), Bollen’s ω (Bollen, 1980), Bentler’s ω (Bentler, 1972, 2009) and
McDo-nald’s ωt(McDonald, 1999) were .93, .95, .95 and .93 respectively. AVE (Fornell
& Larcker, 1981)was .55. Internal consistency reliability coefficients for factors 1
- 4 ranged from .75 to .92 for α, Bollen’s ω and Bentler’s ω, and from .74 to .91 for McDonald’s ωt. AVE ranged from .54 to .63 (Table 12).
Convergent and Discriminant Validity with other parenting measures Parenting measures were arranged in two groups: Positive and Non-Positive Parenting Practices Scales (Table 13). Generally, the correlations of the 4 NICOMACHUS factors, 2 combined factors (POPPD and BND dimensions) and overall NICOMACHUS with the Positive Parenting Practices Scales were all significant (p < .001), with one exception (PBDQ AI with PC, p < .05). Specifi-cally, overall NICOMACHUS had positive moderately high correlations (p
< .001) with all the scales in the Positive Parenting Practices scales at a magni-tude from rS (619) = .21, p < .001 (APQ-9 PP) to rS (619) = .53, p < .001 (PBI S/E
P), see Table 13. The two NICOMACHUS combined factors (POPD and BND) showed moderate to high correlations (all p < .001), ranging for POPD from rS
(619) = .24, p < .001 (with KPSS) to rS (619) = .54, p < .001 (with PBDQ EW)
and for BND from rS (619) = .15, p < .001 (with APQ PP) to rS (619) = .43, p
< .001 (with PBI S/E P). The correlations of the four NICOMACHUS factors ranged from rS (619) = .12, p < .001 (I with APQ-9 PP) to rS (619) = .49, p < .001
(NV with PBI S/E P).
Conversely, the correlations of the four NICOMACHUS factors, two com-bined factors (POPPD and BND dimensions) and overall NICOMACHUS with the Non-Positive Parenting Practices Scales were significant (mainly p < .001) with few ns exceptions. Overall NICOMACHUS had significant negative corre-lations with all Negative Parenting Practices scales, p < .001 and p < .05 (with APQ-9 ID and PBDQ PED), from rS (619) = −.09, p < .05 (APQ-9 ID) to rS (619)
[image:21.595.211.539.535.689.2]= −.29, p < .001 (APQ-9 PS and PBI H/C P), Table 13. The two NICOMACHUS
Table 12. Internal consistency reliability (α), and model-based reliability and validity (ω and AVE) for the overall NICOMACHUS and NICOMACHUS factors.
N = 621
Coefficient
Cronbach’s Alpha
(α)
Bollen’s Omega (ω)
Bentler’s Omega
(ω)
McDonald’s Omega
(ωt)
Average Variance Extracted (AVE)
NICOMACHUS (k = 20) .93 .95 .95 .93 .55
Factor 1—NV (k = 9) .92 .92 .92 .91 .55
Factor 2—SIB (k = 5) .85 .85 .85 .85 .54
Factor 3—PC (k = 3) .80 .83 .83 .84 .63
Factor 4—I (k = 3) .75 .75 .75 .74 .50
DOI: 10.4236/psych.2019.1015136 2136 Psychology Table 13. Bivariate correlations of NICOMACHUS/NPP (four factors and two combined factors) with other parenting measures (6 questionnaires with 17 subscales).
N = 621 Spearman rho
Validation Measures
NPP Factor 1
NV
NPP Factor 2
SIB
NPP Factor 3
PC
NPP Factor 4
I
Combined 1 (NPP FI + F2)
POPPD
Combined 2 (NPP F3 + F4)
BND
NPP Overall
Positive Parenting Practices Scales
APQ-9 PP .25** .22** .14** .12** .26** .15** .21**
KPSS .18** .24** .32** .14** .24** .30** .34**
PBDQ EW .48** .46** .25** .36** .54** .35** .49**
PBDQ AS .45** .34** .23** .17** .43** .25** .38**
PBDQ DD .41** .37** .21** .21** .43** .26** .39**
PBDQ AI .22** .25** .10* .25** .28** .21** .27**
PBI S/E P. .49** .39** .27** .44** .49** .43** .53**
PSS PPT .33** .33** .33** .28** .37** .38** .44**
Non-Positive Parenting Practices Scales
APQ-9 ID −.10* −.10** −. 05 −.04 −.11** −.04 −.09*
APQ-9 PS −.24** −.22** −.20** −.25** −.25** −.25** −.29**
PBDQ PD −.19** −.15** −.23** −.11** −.18** −.20** −.23**
PBDQ PED −.15** −.08* −.13** .04 −.12** −.06 −.10*
PCQ CD −.14** −.09* −.20** −.09* −.12** −.18** −.18**
PCQ PC −.15** −.13** −.17** −.15** −.15** −.19** −.21**
PCQ F/E −.07 −.06 −.42** −.13** −.08* −.35** −.29**
PBI H/C P −.04 −.06 −.15** 0.00 −.05 −.10* −.10*
PSS SPT −.20** −.17** −.27** −.10* −.20** −.23** −.25**
Note. **Significant at p < .001 level. *Significant at p < .05 level. NICOMACHUS Factors: NV = Nurturing Values, SIB = Strength Identification & Boosting, PC = Parenting Context, I = Involvement COMBINED 1 (Factors 1 + 2) = Parenting of Positive Psychology Dimension, COMBINED 2 (Factors 3 + 4) = Basic Needs Dimension. APQ-9 PP = APQ-9 Positive parenting, KPSS = Kansas Parental Satisfaction Scale, PBDQ EW = PBDQ Emotional Warmth, PBDQ AS = PBDQ Autonomy Support, PBDQ DD = PBDQ Democratic Dis-cipline, PBI S/E P. = PBI Supportive/Engaged Parenting, PSS PPT = PSS Positive Parenting Themes, APQ-9 ID = APQ-9 Inconsistent Discipline, APQ-9 PS = APQ-9 Poor Supervision, PBDQ AI = PBDQ Anxious Intrusiveness, PBDQ PD = PBDQ Punitive Discipline, PBDQ PED = PBDQ Permissive Discipline, PCQ CD = PCQ Child Development problems, PCQ PC = PCQ Parenting Capacity problems, PCQ F/E = PCQ Fam-ily/Environmental problems, PBI H/C P. = PBI Hostile/Coercive Parenting, PSS SPT = PSS Stressful Pa-renting Themes.
combined factors had mostly significant negative correlations with the Non-Positive Parenting Practices Scales (almost all p < .001 and an ns excep-tion). The correlations ranged for POPD from rS (619) = −.05, ns (with PBI H/C
P) to rS (619) = −.25, p < .001 (with APQ-9 PS) and for BND from rS (619) =
−.04, ns (with APQ-9 ID) to rS (619) = −.35, p < .001 (with PCQ F/E). Most
DOI: 10.4236/psych.2019.1015136 2137 Psychology
Specifically, there was no correlation between NICOMACHUS factor I and PBI H/C P. The magnitude of the remaining correlations ranged from rS (619) =
−.04, ns (I with APQ-ID and NV with PBI H/C P) to rS (619) = −.42, p < .001
(PC with PCQ F/E). All correlations are presented in Table 13.
Descriptive Statistics and Standardization of NICOMACHUS Scores NICOMACHUS factor scores for the NV, SIB, PC and I factors were M = 4.39, M = 4.19, M = 4.12 and M = 4.10 respectively. The overall NICOMACHUS had M = 4.20. The 10th, 25th, 50th, 75th, and 90th percentile was calculated (N =
621). For NV, SIB, PC and I, 50% of the respondents had M ≤ 4.56, ≤4.40, ≤4.33 and ≤4.33 respectively. For the overall NICOMACHUS, 50% of the parents had
M ≤ 4.31 (Table 14). For each NICOMACHUS measured variable the highest mean was observed on item 3 (M = 4.66, SD = 0.83) equivalent to Mostly True -
Absolutely True Likert points. The lowest mean was observed on item 18 (M =
3.91, SD = 1.15 (Can’t Say True or Untrue-Mostly True). Table 14 presents the percentile means and Table 8 the measured variables mean. Finally, all the NICOMACHUS scale-level correlations were significant, p < .001. The correla-tions between overall NICOMACHUS and NV, SIB, PC and I factors were rS
[image:23.595.210.541.397.506.2](619) = .70, .69, .74 and .72 respectively (p < .001). All the scale-level correlations are listed in Table 15.
Table 14. Percentiles of the NICOMACHUS overall and the NICOMACHUS factor scores.
Percentile
Total Sample (N = 621) Mean Range 10 25 50 75 90
Factor 1-NV 4.39 1.11 - 5.00 3.78 4.22 4.56 4.89 5.00
Factor 2-SIB 4.19 1 - 5 3.40 3.80 4.40 4.8 5.00
Factor 3-PC 4.12 1 - 5 2.67 3.67 4.33 5.00 5.00
Factor 4- I 4.10 1 - 5 2.67 3.67 4.33 4.67 5.00
NICOMACHUS 4.20 1.03 - 5.00 3.51 3.98 4.31 4.62 4.83
NICOMACHUS Factors: Factor 1 = Nurturing Values (items 1 - 9), Factor 2 = Strength Identification & Boosting (items 10 - 14), Factor 3 = Parenting Context (items 15 - 17), Factor 4 = Involvement (items, 18 - 20).
Table 15. Scale level correlations of the overall NICOMACHUS/NPP, the four NPP factors (NV, SIB, PC, I) and two combined factors (POPPD & BND).
Total Sample (N = 621) NV SIB PC I POPPD BND NPP
Factor 1—Nurturing Values (NV) -
Factor 2—Strength Identification & Boosting (SIB) .58** -
Factor 3—Parenting Context (PC) .34** .32** -
Factor 4—Involvement (I) .46** .38** .31** -
Combined 1 —Parenting of PP Dimension (POPPD) .84** .92** .36** .45** -
Combined 2—Basic Needs Dimension (BND) .46** .40** .83** .76** .46** -
Overall NICOMACHUS/NPP .70** .69** .74** .72** .77** .91** -
[image:23.595.62.538.584.701.2]DOI: 10.4236/psych.2019.1015136 2138 Psychology
Study 2 Discussion
The purpose of this study was: 1) to establish construct validity with EFA and CFA in a large sample; 2) to evaluate measurement invariance across child gender; 3) to evaluate internal consistency reliability and factor-based reliability; 4) to examine model-based convergent validity; 5) to establish the convergent and discriminant validity with other parenting measures and 6) to calculate normative data for the newly developed NICOMACHUS.
The sample (N = 621) was split into two random subsamples, to carry out EFA and CFA in different parts of the sample (30% and 70% or about 1/3 and 2/3; Guadagnoli & Velicer, 1988;Singh et al., 2016). EFA was carried out in a random 30% of the sample. Using multiple methods(Cattell, 1978;Horn, 1965;
Velicer, 1976; Schwartz, 1978) four factors were extracted explaining over
two-thirds of the total variance, with no cross-loadings. Loadings, communali-ties, and factor correlations were above the acceptable limits and the model fit was adequate.
The four factors that emerged were in accordance with the theoretical model proposed (Introduction & Kyriazos & Stalikas, 2018a). Factor 1 was termed Nurturing Values (NV), Factor 2 Strength Identification and Boosting (SIB), Factor 3 Parenting Context (PC), and Factor 4 was named Involvement (I). By merging Factor 1 and 2 we get the Parenting of Positive Psychology Dimension (POPPD), and by merging Factors 3 with 4 we get the Basic Needs Dimension (BND).
This four-factor structure was verified with a CFA in a random 70% of the sample. Two variations of the 4-factor model were specified. One with four cor-related factors and a second with four corcor-related factors plus two error cova-riances. Item 2 (Ι encourage my child to fight for what isfair) was allowed to covary with item 3 (I incite my child to always tell the truth) and item 13 (I en-courage my child to study something related to his/her character strengths) with item 14 (I make sure that my child’s extracurricular activities cultivate his/her
character strengths). Both models showed adequate to good fit respectively.
However, the model with error covariances is less parsimonious than the 4-factor model, and it must be cross-validated in a different sample (Byrne, 2012
among others).
Measurement invariance was estimated using the 4-factor model (without er-ror covariances) as a baseline model across the child gender and it was fully supported to the strict level, i.e. the strictest possible measurement invariance level(Wang & Wang, 2012).
Internal consistency reliability was estimated with four coefficients:
Cron-bach’s alpha (1951)and at the model, level using three omega methods(Bollen,
1980;Bentler, 1972, 2009;McDonald, 1999;Werts, Lim, & Joreskog, 1974). All
(For-DOI: 10.4236/psych.2019.1015136 2139 Psychology
nell & Larcker, 1981).
Convergent and discriminant validity were also examined with six parenting measures, with positive and non-positive parenting practices subscales. All the positive subscales had the expected direction (positive), a high statistical signi-ficance and low to moderate magnitude, both for the overall NICOMACHUS, factors and combined factors (POPPD and BND dimensions). The negative subscales had also the expected direction (negative) and they were mostly highly significant with a few non-significant exceptions. Descriptive statistics and nor-mative data were also evaluated.
The next step was to cross-validate the newly developed NICOMACHUS in a different sample (Study 3).
4. Study 3: Cross-Validation Study
The purpose of this study was: 1) to cross-validate the NICOMACHUS structure found in Study 2 in an independent sample, 2) to reevaluate internal consistency reliability and factor-based reliability and convergent validity, 3) to examine convergent and discriminant validity with wellbeing and affect measures, 4) to examine concurrent validity with the child’s school performance, 5) to re-calculate normative data for NICOMACHUS in a different sample.
Study 3 Method Participants
The sample involved 146 Greek parents (75% of females) with at least one child from 7 to 13 years (M = 9.84 years, SD = 2.18, 57% of males). The parents were 75% of biological mothers and 25% biological fathers. Per family there were either 1 (27%), 2 (61%), 3 (12%) or more (1%) children. The majority of the parents (99%) were living in the same house with the child they completed the questionnaire for, and 97% of them cared for a child with no special needs (bio-logical, mental or other). Almost half of them (47%) were from 41 - 50 years, 45% from 31 - 40 years, 7% from 51 - 60. Almost half the participants (48%) had a B.A. (27%) or higher (21%), or they had finished high-school (40%) or lower (2%). The majority of the parents were working (86%), and had a Greek natio-nality (98%). Most parents (45%) had an annual income between 10001 and 20000€ or lower (21%) while 23% had an income between 20001 and 30000€ or higher (11%).
Measures
NICOMACHUS-Positive Parenting (NPP)
Fac-DOI: 10.4236/psych.2019.1015136 2140 Psychology
tors 3 with 4 we have the Basic Needs Dimension (BND). The higher the score the higher the perceived positive parenting. There are no reverse-scored items. Possible scores range from 1 (minimum positive parenting effectiveness) to 5 (maximum positive parenting effectiveness). The questionnaire is available in Appendix.
PERMA Profiler (Butler & Kern, 2016)
PERMA-Profiler is a 23-item measure of the PERMA wellbeing model
(Selig-man, 2011) with five theoretical domains (Positive emotion, Engagement,
Rela-tionships, Meaning, and Accomplishment). PERMA-Profiler contains 3 items on each PERMA theoretical domain and 8 filler items to evaluate overall wellbeing, negative emotion and physical health. The 23 items are rated on a 11-point Li-kert scale from 0 = never/terrible/not at all/to 10 = always/excellent/completely depending the item. Combined reliability coefficients (α) across 11 samples were reported .88 (P), .72 (E), .82 (R), .90 (M), .79 (A), .94 (OWB), .71 (NE), and .92 (PH), i.e. Positive Emotion, Engagement, Relationships, Meaning, Accomplish-ment, Overall Wellbeing, Negative Emotion, and Physical Health respectively
(Butler & Kern, 2016). In the present study, internal consistency reliability was α
= .91.
Mental Health Continuum-Short Form (MHC-SF; Keyes et al., 2008) MHC-SF(Keyes et al., 2008) is 14-item questionnaire measuring three aspects of wellbeing over three factors (Keyes, 2002): emotional (EWB), social (SWB) and psychological wellbeing (PWB). Items are rated on a 6-point scale evaluat-ing the frequency of experiences durevaluat-ing the past month (from0 = never to5 =
every day). Moreover, MHC-SF generates a categorical assessment (flourishing,
moderately mentally healthy, and languishing). Internal consistency reliability was reported by Lamers et al. (2011) to be α = .89, .83, .83 and .74 for the total MHC-SF, EWB, PWB, and SWB respectively. In the present study, internal con-sistency reliability was α = .89.
Satisfaction with Life Scale (SWLS; Diener, Emmons, Larsen, & Griffin,
1985)
SWLS is a commonly used measure of life satisfaction with five items about cognitive appraisals of one’s life (e.g. “I am satisfied with my life”). Responses are rated on a 7-point Likert scale (from 1 = strongly disagree to 7 = strongly agree). The higher the score the greater the perceived life satisfaction. Possible scores range from 1 (min life satisfaction) to 35) max life satisfaction). Internal consistency was reported to range from .79 to .89; Pavot & Diener, 1993). In the present study, internal consistency reliability was α = .88.
Subjective Happiness Scale (SHS; Lyubomirsky & Lepper, 1999)
The SHS is a short measure of the perceived happiness with 4 items rated on a 7-point Likert scale (from 1 = not a very happy person to 7 = very happy per-son). Higher scores suggest higher mean happiness. Lyubomirsky and Lepper
(1999)reported internal consistency reliability from .79 to .94 across several