The Discrimination Ratio derived
from Novel Object Recognition
tasks as a Measure of Recognition
Memory Sensitivity, not Bias
Magali H. Sivakumaran
1, Andrew K. Mackenzie
2, Imogen R. Callan
1, James A. Ainge
1&
Akira R. O’Connor
1Translational recognition memory research makes frequent use of the Novel Object Recognition (NOR) paradigm in which animals are simultaneously presented with one new and one old object. The preferential exploration of the new as compared to the old object produces a metric, the Discrimination Ratio (DR), assumed to represent recognition memory sensitivity. Human recognition memory studies typically assess performance using signal detection theory derived measures; sensitivity (d′) and bias (c). How DR relates to d′ and c and whether they measure the same underlying cognitive mechanism is, however, unknown. We investigated the correspondence between DR (eye-tracking-determined), d′
and c in a sample of 37 humans. We used dwell times during a visual paired comparison task (analogous to the NOR) to determine DR, and a separate single item recognition task to derive estimates of response sensitivity and bias. DR was found to be significantly positively correlated to sensitivity but not bias. Our findings confirm that DR corresponds to d′, the primary measure of recognition memory sensitivity in humans, and appears not to reflect bias. These findings are the first of their kind to suggest that animal researchers should be confident in interpreting the DR as an analogue of recognition memory sensitivity.
Comparative studies of recognition memory have been dominated by the use of the (spontaneous) novel object recognition behavioural paradigm (referred to hereafter as the NOR task). Since the development of the NOR task1, the original paper has received more than 1,590 citations (Web of Science Core Collection, retrieved
October 31, 2017), and an informal Google Scholar search for “novel object recognition” returns more than 3 mil-lion results. It has been estimated that approximately 43,000 rats and mice have been used in NOR experiments published in peer-reviewed journals between 2008 and 20122. Its widespread usage likely reflects the relative ease
in administering the task. It requires no rule learning or training, exploiting instead rodents’ innate predisposition to preferentially orient towards, and explore, new rather than old objects3. This innate bias in animals’ exploratory
behaviour is thought to reflect underlying memory discrimination or sensitivity. Consequently, it is assumed that NOR performance is a valid indicator of how well an animal is able to discriminate an old stimulus from a new stimulus.
NOR tasks have a familiarisation sample phase and a test phase. To establish initial familiarity, an animal is presented with, and explores, two identical copies of an object (object A) in the test environment. Following a delay, the animal is next presented with the test component comprising the presentation of a new copy of object A and a novel object B in the same environment. If the animal orients preferentially to object B, an inference is made that the animal has “recognised” object A, thereby showing a sensitivity to discriminate old from new. Conversely, if the animal orients to and explores both objects equally, it is assumed that the animal demonstrates insufficient memory sensitivity to perform the recognition discrimination4. NOR task performance is quantified
using the Discrimination Ratio (DR)1. The DR reflects the duration of exploration for the new (T
new) compared to
the old object (Told) as a proportion of the animal’s total exploration time (Ttotal; see Eq. 1), and is thus equivalent
1University of St Andrews, School of Psychology and Neuroscience, St Andrews, KY16 8JP, United Kingdom. 2Nottingham Trent University, School of Social Sciences, Nottingham, NG1 4FQ, United Kingdom. Correspondence and requests for materials should be addressed to J.A.A. (email: [email protected]) or A.R.O. (email: aro2@ st-andrews.ac.uk)
Received: 8 November 2017 Accepted: 23 July 2018 Published: xx xx xxxx
to the d2 measure first developed when the NOR was introduced1. Despite the heavy reliance on the NOR task
in the comparative literature, and the assumptions inherent in using it as a measure of recognition memory, we have little understanding of how the DR relates to the dissociable components of sensitivity and bias obtained from recognition memory judgement tasks in the human literature. This is addressed in the current experiment by assessing the correlations between the DR and measures of sensitivity and bias.
= −
DR T T
T (1)
new old
total
( ) ( )
( )
Sensitivity and bias are useful and widely used concepts which can be quantified in humans using traditional, single item recognition memory tasks (referred hereafter as SIR tasks)5. Sensitivity—parameterised within signal
detection theory as discriminability (d′)—refers to the ability to accurately differentiate old from new items. The better an individual is able to correctly identify old items as “old” (Hits; Hs), and new items as “new” (Correct Rejections; CRs), the greater their d′. Sensitivity thus considers both H and CR rates (see Eq. 2; False Alarms [FAs] are obtained by calculating the error rate for old items—the equivalent of 1-CR rate; equations use standardised z-scores of these, denoted by z). However, there is typically a set of items that fall within a mnemonically ambig-uous range, such that their classification as either “old” or “new” is unclear. Under such circumstances, bias— parameterised within signal detection theory as criterion placement (c)—quantifies the tendency to identify items as either “old” or “new” when unsure (see Eq. 3). Neutral, optimal bias is reflected in a c of 0, with increasing tendencies to respond “old” and “new” reflected in increasingly negative and positive c values respectively. Given the dissociation of recognition performance into two measures under single item recognition tasks, set against the summarisation of the NOR task into one measure, there exists the possibility that DR may reflect the contribution of both d′ and c, or that it may reflect only one, or even neither of them.
′ = −
d z H( ) z FA( ) (2)
= − +
c z H( ) z FA( )
2 (3)
Presentation and interpretation of the NOR task in the literature assumes that the DR is a measure of recogni-tion memory sensitivity alone. Animals who fail to present a novelty preference are considered to lack the ability to discriminate between old and new items in memory. That is, they are assumed to have low recognition sensitiv-ity. Furthermore, similar to a forced choice task in which participants identify the old item from an array of two items, the NOR task is traditionally considered to be criterion- or bias-free5. This assumption is made because
animals can perform the task by identifying the newest item presented based on relative memory strength, rather than unnecessarily classifying each item according to an old/new criterion. However, unlike a forced choice task, which typically records only the final memory classification made by the observer, exploration data such as the ratio of time spent exploring old and new items may provide a more nuanced view of the observer’s recognition memory, including their bias. Indeed, the NOR task relies upon an animal’s innate predisposition towards explor-ing novelty, a reliance that suggests bias may indeed play a role in determinexplor-ing the final metric.
Data from lesion and neurophysiological studies using NOR tasks would suggest that the DR is predominantly related to memory sensitivity. Memory sensitivity is unambiguously dependent on structures such as the medial temporal lobes (MTL) and surrounding rhinal cortex6, while bias recruits higher order cortical structures such as
the prefrontal cortex (PFC) and the parietal cortex7–9. Lesions of the perirhinal cortex reliably lead to NOR task
performance deficit10–12, while PFC lesions do not11,13, although PFC lesions have been demonstrated to affect
object-place and temporal order NOR variants14. However, PFC lesions have been demonstrated to cause novelty
orienting difficulties in other tasks15. Furthermore, lesions of the posterior parietal cortex leave performance on
a standard NOR undisrupted16. The impact of parietal lesions on a standard NOR task are yet to be determined.
Thus, empirical evidence aimed at ascertaining how the DR obtained in the animal literature relates to the com-ponents of recognition memory obtained from human research is lacking, making direct comparison of these two extensive literatures difficult. The current study uses a human version of the rodent NOR task combined with a standard test of recognition memory in the same participants to examine how these measures are related.
The procedure we report here was conducted on human participants. Humans do not show the same active physical exploration of new or interesting aspects of their environment as rats. Consequently, we used a visual-paired comparisons (VPC) task which provided new and old item dwell times used to calculate DR. The VPC is analogous to the NOR as it relies upon the human tendency to preferentially fixate upon novel objects under free viewing conditions17,18. This novelty preference is innate, the task requires no rule learning, and is
also unrewarded17,18. As such the VPC is closely analogous to the NOR task used in rodents. It has previously
been used in infants18, older adults with cognitive impairments19 and non-human primates20 and is well suited to
minimising demand characteristics, necessary when translating behavioural tasks across human and non-human species.
Manns, Stark & Squire21 provide the only explicit examination of the VPC as a measure of declarative memory
paired next to a novel item, as these have not been fixated upon much during the VPC. This is supported by the finding in the same experiment that DR correlated with both reaction times and participants’ confidence, which are commonly reported to be highly related to recognition memory ability22,23. If hits and correct rejections were
separately measured, rather than overall accuracy, this could have been investigated by the authors, highlighting the importance of considering both of these aspects of recognition memory sensitivity separately. This study also leaves the separable components of sensitivity and bias and their relationships to the DR unconsidered.
We used two recognition tasks, a VPC task, yielding dwell-time-based DR, and a SIR task, yielding response-based sensitivity (d′) and bias (c) parameters, to interrogate associations between the metrics in the same participants. To vary the depth of encoding, and thus the magnitude of the memory signals recovered within the SIR task24, we had participants encode items using shallow and deep encoding manipulations. Potential
rela-tionships between the measures (a single DR and two sets of memory-strength-dependent d′ and c parameters) are explored. Given the assumptions of the literature reviewed above, we hypothesised that DR would be posi-tively correlated with sensitivity but display no correlation with bias. We anticipated that this selective relation-ship would hold across both encoding conditions as we have no reason to assume that this relationrelation-ship exists only at higher or lower memory strengths.
Results
Visual Paired Comparison Task: Discrimination Ratio (DR).
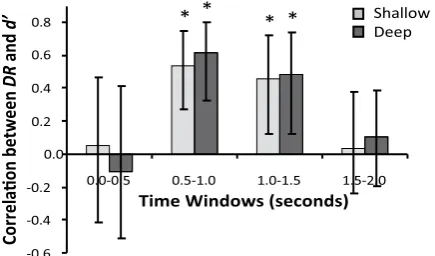
We included only data from trials where participants fixated on both study items and both test items (84.91% of all trials). A Wilcoxon signed-rank test confirmed that the left/right position of the new item at test did not significantly affect the included percentage of trials based on the above criteria (left: M= 83.39% SD= 16.10; right: M= 86.43%, SD= 13.87), Z(n = 28) =−1.34, p= 0.180. As assessed using a left/right-determined DR (M =−0.017, SD = 0.105) compared to a test value of 0, dwell times were not significantly different for the two identical study items presented in each study trial, t(df = 27, n = 28) =−0.84, p= 0.410, d= 0.16. Importantly for the validity of the VPC task, the mean old/new-determined DR (M = 0.321, SD = 0.15) was significantly greater than 0, indicating that partic-ipants’ fixations were directed more towards new than old items during test trials, t(df = 27, n = 28) = 11.26, p< 0.001, d= 2.13. To examine the time course of the novelty related response the 2 s VPC response window was split into 0.5 s subdivisions. While DR was significantly greater than chance throughout the 2 s response window (Fig. 1, all ts > 4.58, ps < 0.001, ds > 0.87, n = 28) there was a significant difference between the 0.5 s subdivisions, with DR starting low, increasing dramatically between 0.5–1 s and then declining in the final second, as outlined by a repeated measures ANOVA with a Greenhouse-Geisser correction, F(df = [2.31, 62.48], n = 28) = 17.26, p< 0.001, η2p= 0.390 (Fig. 1). Post-hoc Bonferroni corrected pairwise comparisons identified that significant
differences were only present between the DR for 0.5–1.0 and all other time windows (DR 0.5–1.0 [M = 0.528] vs 0.0–0.5 [M = 0.148], p< 0.001, d= 1.19; DR 0.5–1.0 vs 1.0–1.5 [M = 0.346], p= 0.007, d= 0.68; DR 0.5–1.0 vs 1.5–2.0 [M = 0.211], p< 0.001, d= 1.14). No differences were observed between the other time windows (all mean differences < 0.197, all ps> 0.056).
Single Item Recognition Task: Sensitivity (d
′
) and Bias (c).
Adjusted hit (H′) and correct rejection (CR′) rates are used to calculate sensitivity and bias (see Methods). As such, we first present analyses of these measures, before examining sensitivity and bias directly. Figure 2 presents mean H′ and CR′ under conditions eliciting either shallow or deep levels of processing, and thus encoding (see Methods). A Wilcoxon signed-rank tests demonstrated that CR′ rates were unaffected by encoding condition (shallow: M= 0.873, SD= 0.09; deep: M= 0.862, SD= 0.11), Z(n = 28) =−0.66, p= 0.508, while H′ rates were lower under shallow than deep encod-ing as outlined by a paired-samples t-test (shallow: M= 0.541, SD= 0.19; deep: M= 0.716, SD= 0.17), t(df = 27,0.0
0.1
0.2
0.3
0.4
0.5
0.6
0.7
Discriminaon Rao
(
DR
)
0.5
1.0
1.5
2.0
Time Windows (seconds)
*
*
[image:3.595.159.358.46.256.2]*
*
n = 28) = 5.57, p< 0.001, d= 1.05. These results indicate that the encoding depth of processing manipulation was successful in strengthening the memory traces of those items encoded under a deep level of processing.
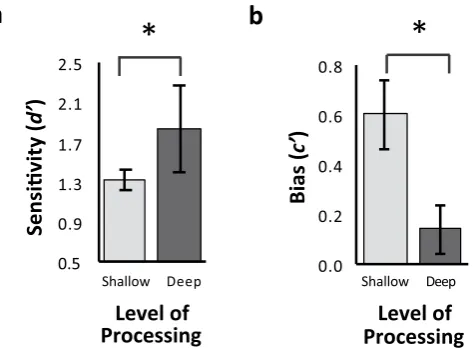
Mean d′s for each encoding condition are presented in Fig. 3a. As would be expected based on the H′ differ-ences, participants had significantly lower d′ in the shallow than the deep condition as outlined by a paired-samples t-test (shallow: M= 1.34, SD= 0.55; deep: M= 1.84, SD= 0.76), t(df = 27, n = 28) = 4.28, p< 0.001, d= 0.81. To account for variation in d′ across levels of processing, c was scaled to d′ on a participant-by-participant basis to give a measure of relative bias (c′; see Methods). Mean c′ for each level of processing are presented in Fig. 3b. Participants had a significantly lower c′ in the shallow than the deep condition (shallow: M= 0.60, SD= 0.73; deep: M= 0.14, SD= 0.54), as outlined by a Wilcoxon signed-rank test Z(n = 28) =−3.83, p< 0.001. That is, shallow levels of encoding led to more conservative criterion placements, resulting in a decreased tendency to identify stimuli as “old”.
Associations between recognition memory measures.
The analyses below were critical in moti-vating this study. We hypothesised that there would be a significant positive relationship between DR and sensitivity, in the form of d′, but not bias, in the form of c. Pearson’s correlations supported these hypotheses. Significant positive correlations were observed between DR and d′ for both the shallow, r(df = 26, n = 28) = 0.528, p= 0.004, and deep, r(df = 26, n = 28) = 0.576, p= 0.001, encoding conditions (Fig. 4a,b). No correlations were observed between DR and c in either shallow, r(df = 26, n = 28) =−0.297 p= 0.125, or deep conditions, r(df = 26, n = 28) =−0.325 p= 0.092, (Fig. 4c,d). (Unsurprisingly, these relationships were maintained in two multiple regression analyses, one using shallow parameters as predictors and another using deep parameters as predictors. In both regressions, d′ [ps < 0.008] but not c [ps > 0.154] emerged as a significant predictor of DR in significant0.3 0.4 0.5 0.6 0.7 0.8 0.9 1.0
H’ CR’
Shallow
Deep
*
Proporon Correct
Figure 2. Mean adjusted hit (H′) and correct rejection (CR′) rates according to encoding condition. Error bars
represent standard errors of the mean.
0.5 0.9 1.3 1.7 2.1 2.5
Shallow Deep
Sensivity (
d’
)
a
Level of
Processing
0.0 0.2 0.4 0.6 0.8
Shallow Deep
Bias (
c’
)
b
*
Level of
Processing
*
[image:4.595.158.364.44.225.2] [image:4.595.161.399.288.463.2]models [regression model ps < 0.009].) These analyses suggest that DR does indeed specifically reflect recognition memory sensitivity, but appears unrelated to recognition memory bias.
Using frequentist statistics allows testing of the alternative hypothesis, however it does not allow quantification of the evidence for the null hypothesis. Therefore it is unknown whether the lack of a relationship between DR and c reflects the true lack of a relationship between these or whether the data is inconclusive. As such, we also subject the data to Bayesian analyses, which do allow such quantification. Similarly to the above correlations, Bayesian correlation tests were run between DR and d′ and DR and c. For these, no relevant background knowl-edge was inputted into the model, and as such Beta priors were set to 1. For correlations with d′ the alternative hypothesis of a positive correlation was tested, while for correlation with c the null hypothesis of no correlation was tested. The Bayesian correlation test demonstrate the same observed correlation between DR and shallow and deep d′s as the above Pearson’s correlations, r= 0.528 (95% CI: 0.179, 0.735) and r= 0.576 (95% CI: 0.238, 0.765) respectively, with associated Bayes Factors of 24.63 and 62.16 respectively. This highlights that the alternative hypothesis of a positive correlation between DR and d′ predicts the shallow data set 24.63 times better than the null hypothesis, and predicts the deep data set 62.16 times better than the null hypothesis. Bayes Factor robust-ness checks for different Beta prior widths (0.0–2.0) were also performed. The above results were considered to be robust as Bayes Factors did not vary significantly with different Beta prior widths above 0.2. All Bayes Factors for Beta prior widths above 0.2 were above 20 (suggesting strong evidence) for the shallow analysis, and above 30 (suggesting very strong evidence) for the deep analysis.
The Bayesian correlation test demonstrate the same observed correlation between DR and shallow and deep c’s as the above Pearson’s correlations: r=−0.297 (95% CI: 0.581, 0.084) and r=−0.325 (95% CI: −0.600, 0.056) respectively, with associated Bayes Factors of 1.39 and 1.10 respectively. This highlights that the null hypothesis of no correlation between DR and c predicts the shallow data set only 1.39 times better than the alternative hypothe-sis that the data are correlated, and predicts the deep data set only 1.10 times better than the alternative hypothehypothe-sis that the data are correlated. Bayes Factor robustness checks for different Beta prior widths (0.0–2.0) were also performed. The above results were considered to be anecdotal for all Beta prior widths. These analyses provide further evidence that the result from this experiment show a significant and important relationship between DR and d′, but that the relationship between DR and c is inconclusive, as it neither supports the alternative nor the null hypothesis.
Given that we found DR to vary across the 0.5 s time windows (Fig. 1), we also ran separate correlations between the DRs from each window and d′ according to encoding condition. Mean Pearson’s correlation coef-ficients for these analyses are presented in Fig. 5. For this figure, 95% confidence intervals were estimated using Monte-Carlo case resampling (with replacement) bootstrapping procedures. The available data set for each time
0.1
0.3
0.5
0.7
-0.5
0.5
1.5
b
Sensivity (d’) deep
Sensivity (d’) shallow
c
d
0.1
0.3
0.5
0.7
0
1
2
0.1
0.3
0.5
0.7
0
1
2
3
0.1
0.3
0.5
0.7
-0.6
-0.1
0.4
0.9
Bias (c) shallow
Bias (c) deep
a
Discriminaon Rao (
DR
)
R
2= 0.279
R
2= 0.332
R
2= 0.083
R
2= 0.111
Discriminaon Rao (
DR
)
Discriminaon Rao (
DR
)
Discriminaon Rao (
DR
)
Figure 4. Scatterplots showing DR and d′ for a. shallowly encoded stimuli, and b. deeply encoded stimuli, and
[image:5.595.152.518.47.357.2]window was sampled with replacement until the total number of participants (n = 28) was reached. This was repeated 10 000 times, simulating 10 000 experiments, and the confidence interval was calculated from this boot-strapped data set. Of the four time windows, DR was only significantly positively correlated to shallow and deep d′s between 0.5 s and 1.0 s, r(df = 26, n = 28) = 0.540, p= 0.003 and r(df = 26, n = 28) = 0.613, p= 0.001 respec-tively, and between 1.0 s and 1.5 s, r(df = 26, n = 28) = 0.458, p= 0.014 and r(df = 26, n = 28) = 0.484, p= 0.009 respectively. There were no significant correlations with either shallow or deep d′s in the early 0.0 s to 0.5 s win-dow, r(df = 26, n = 28) = 0.051, p= 0.759 and r(df = 26, n = 28) =−0.108, p= 0.583 respectively, or in the late 1.5 s 2.0 s window, r(df = 26, n = 28) = 0.039, p= 0.844 and r(df = 26, n = 28) = 0.106, p= 0.590 respectively. This selectivity of association indicates that, even within the narrower time windows which all show significantly pos-itive DRs, there are only some windows in which the critical association with sensitivity is present. The associated windows coincide with observed peak DRs across the sample, and windows for which the variance in DR was greatest (0–0.5 s window: SD = 0.17; 0.5–1.0 s window: SD = 0.25; 1.0–1.5 s window: SD = 0.28; 1.5–2.0 s window: SD = 0.19).
Discussion
This experiment is the first to provide empirical validation of the DR as a measure of recognition memory sensi-tivity in humans. This has wide reaching implications for tests of human memory and potentially for interpreting the extensive number of experiments using the NOR paradigm for testing memory sensitivity in rodents.
We first demonstrated that participants spent more time visually dwelling upon new compared to old stimuli during a VPC task. Importantly, participants’ preferential orienting to novelty, as summarised by the DR, were significantly positively correlated with recognition memory sensitivity but not bias. That is, participants who spent a greater proportion of time dwelling on novel items were also better able to differentiate old from new items in a standard recognition memory task. Notably, these participants were neither more conservative nor liberal in their willingness to identify items as “old”, with this lack of relationship being stronger according to frequentist rather than Bayesian methods. Interestingly, the DR-sensitivity correlation was only reliable for DRs obtained during the 0.5 s to 1.0 s and 1.0 s to 1.5 s time windows within the entire 2.0 s visual examination period.
The absence of a correlation between DR and sensitivity in the 0.0–0.5 and 1.5–2.0 second time windows occurred despite a significant novelty orientation (positive DR) in the VPC being observed for all time windows. Thus, this association is not simply driven by the progression of novelty orientating across a trial25. Rather, it may
be the result of increased variance in DR during these windows. This waxing and waning of variance across the time windows suggests that individual differences in the progression of participants’ DRs are important to the association. It may be that the time-course of preferential novelty orienting differs across participants. All partici-pants are quick to show this behaviour, which eventually disappears25. However, some participants may maintain
their novelty preference for most of the duration of the trial before it is attenuated, while others have already stopped or significantly reduced it. Such behaviour patterns would be consistent with the presence of lower DRs as well as the reduced variance within these extreme windows. The nature and extent of this individual variability and the effects on the associations with memory sensitivity, remain to be fully investigated, but should be consid-ered when using DR as a measure of memory sensitivity. Researchers in this position may wish to select periods of maximal DR as best indicative of individual differences in the capacity to differentiate novel from familiar stimuli. As well as supporting the use of the DR as a measure capable of reflecting recognition memory sensitivity, our findings demonstrate that it appears not to be affected by preferences to respond to old or new stimuli, or at a more conservative level that the relationship between DR and bias are inconclusive. While it was conceived that the ratio of time spent exploring old and new items may provide a more nuanced view of the observer’s recognition memory than simply recording participants’ final memory classification, and thus may include bias, the dwell-time-based DR did not reflect this. Taken together with other sources of evidence, such as the current human literature which regards the VPC as a bias-free forced-choice task5, and the lesion and neurophysiological
studies demonstrating no effect of PFC14 or posterior parietal cortex16 lesions on NOR tasks despite its impact
on novelty orienting15, it is reasonable to suggest the lack of a correlation found using frequentist statistics, and
reflected as inconclusive using Bayesian statistics reflects the lack of involvement of bias throughout this task. In -0.6
-0.4 -0.2 0.0 0.2 0.4 0.6 0.8
0.0-0.5 0.5-1.0 1.0-1.5 1.5-2.0
Time Windows (seconds)
Correlaon between
DR
and
d’
*
*
*
*
ShallowDeepFigure 5. Mean correlation coefficients between DR and d′ for each 0.5 s window, according to encoding
[image:6.595.156.374.47.175.2]essence, within the scope of these different evidence sources, the current data support the suggestion that the DR in the current VPC task is bias free.
An important qualifier here is that the retention period over which we spaced VPC study and test phases was 0.5 seconds, which contrasts with longer periods typically used in rodent research (minutes to days). It is possible that these differences could potentially impact the presence or absence of relationships observed in the present study. Drawing on work that has examined SIR bias and SIR sensitivity as a function of long retention intervals (15 minutes to 3 months26 we know that long delays reduce both bias and sensitivity. Crucially though, we are not
aware of any reported changes in the covariance of these parameters over time. Thus, we would not anticipate changes in the relationships reported here, but the effect of retention interval on the bias-sensitivity relationship remains an empirical question to be explored in future work.
One further important consideration is that design of the VPC and SIR tasks mean they have a number of key differences. For example, the VPC was implemented in such a way as to minimise participants being consciously aware that this was a memory task. This was done deliberately to reflect the NOR task used in rodents as accu-rately as possible. However, the differences between the tasks could result in differences in the memory mecha-nisms that support them. One possibility is that memory could be retrieved using recollection in the SIR while the VPC could potentially be solved using familiarity. This could mean that while performance in these tasks is well correlated the underlying neural mechanisms could be different. This does not detract from the current findings which are a crucial first step to understanding how transferable measures of recognition memory are across tasks and species. It does, however, demonstrate the need for further investigation in this area.
The empirical validation of the DR as a measure of recognition memory sensitivity has consequences for rec-ognition memory research in non-standard human populations. The VPC is a non-verbal, short (<15 mins) task that requires no instruction to complete. For this reason, it has been frequently used in human infant research18.
While previous research has demonstrated the appropriateness and value of the VPC within a clinical setting19,27,
it is not until the results of the current experiment that researchers could have confidence in the aspects of rec-ognition memory being tested by the task. As we have demonstrated here that novelty orientation in the VPC provides a good analogue to individual’s recognition memory sensitivity, we argue that it provides an excellent alternative to SIR tasks for this measurement in those who have impaired ability to follow instructions or coor-dinate key-presses, such as people with dementia and people undergoing rehabilitation following brain injury.
It is important to note that a correlational approach underpins the conclusions drawn above. Acknowledging the caveats to such an approach, we draw conclusions which refrain from declaring or specifying the nature of the relationship. Indeed, future research will be required to explore whether a single or multiple parallel cognitive processes contribute to each, any or any combination of the DR, recognition memory sensitivity or bias. Certainly, such research leading to an understanding of the cognitive and neural substrates contributing to these will specify why the DR is such a valid measure of sensitivity, appearing to leave bias unaccounted for.
The current data also have implications for our understanding of how the NOR task, used to assess recogni-tion memory in rodents, can be interpreted. The assumprecogni-tion in the animal literature that the degree of novelty orienting during the standard NOR is an indicator of the sensitivity with which an animal is able to discriminate old from new stimuli has been widely held but never tested. Recent studies have examined whether NOR per-formance is driven primarily by response to new or old items28,29 but these studies still assume that differential
responding on the basis of relative novelty represents a measure of memory sensitivity. The current findings cru-cially verify this assumption in humans, and suggest that the use of the DR in animal and comparative recognition memory research to study memory sensitivity is valid. While further empirical testing and validation of these findings with animals is required, the current finding is nonetheless of considerable importance given the scope and dominance of the NOR within the literature, and the number of animals sacrificed to studies dependent upon this task2. Where the NOR has been used to evaluate drug effects3 and pharmacological compound safety30, the
current validation of the DR provides much needed confidence in the aspects of memory tested. Furthermore, where the NOR task is used to investigate the functions of defined neurological areas10,11,31, the validation of the
DR as a measure of memory sensitivity will enable a more detailed functional anatomy map to be developed/con-ceptualised. The current contribution towards its validation, along with the versatility of the NOR in rats (which can be tested using visual, olfactory or tactile stimuli)32 and the possibility of using the VPC in humans suggests
that the DR is a highly suitable measure for translational research between species.
The specific correlation of DR with sensitivity and not bias highlights a common problem in the description of the how rodents explore novelty. Discussing the behaviour demonstrated by animals in the NOR as a preferential exploration of novel as compared to old items is accurate but can be misleading. The innate novelty preference leading to positive DRs should not be confused with a mnemonic bias, or a preference to consider items as new or old under conditions of uncertainty. To avoid confusion, the DR should be discussed in terms of a novelty orient-ing response rather than a “preference” for novel items.
In summary, our findings validate the use of DR as a measure of recognition memory sensitivity uncontami-nated by bias. They also suggest that, on a sample level, there may be certain windows within the period of explo-ration that are better representative of sensitivity than others. These windows here coincided with observations of maximal DR, but this remains to be fully explored across tasks and species. Finally, we suggest that DR may also be a useful measure in human samples, particularly those with verbal or motor difficulties. A small number of studies using the VPC in human samples have shown promise and, based on our current results, we see no reason why this methodology should not be developed and extended to enable memory assessment in a far broader range of samples than are currently served by traditional recognition tests requiring instruction and response.
Methods
All testing procedures were approved by and comply with the University of St Andrews University Teaching and Research Ethics Committee (UTREC; approval code: PS11888).
Participants.
Thirty-seven participants with self-reported normal or corrected-to-normal vision were tested. They were compensated £7 for their time. Nine participants were excluded from the analyses for the following rea-sons: failure to follow task instructions (1); self-reported estimate that >35% of stimuli were familiar or recognized from pre-experimental exposure (3); poor eye movement calibration (>0.5 degree average spatial error) (1); failure to fixate on both stimuli presented on screen during the visual paired comparison task on more than 50% of trials (3); failure to exceed chance performance in the SIR task (d′< 0.1) (1). The final sample consisted of 28 participants (75.68% of the original sample; 20 females; mean age = 23.86 years, age range = 18–32 years). Informed consent was obtained in accordance with the University Teaching and Research Ethics Committee of St Andrews.Stimuli.
A set of 432 colour Pokémon generation II-VI (© 1995–2016 Nintendo/Creatures Inc./GAME FREAK inc. Pokémon) and Digimon (© 1997–2008 Bandai) characters were selected from online databases (“Pokémon Wiki”, n.d.; “Wikimon”, 2005). Images measured 200 × 200 pixels. For each participant, a set of 320 items was randomly sampled from this pool, 80 of which were used for the Visual Paired Comparison (VPC) task, 240 for the single item recognition (SIR) task.Apparatus.
Visual paired comparison task (VPC). Eye movements were recorded using an SR Eyelink 1000 eye tracker (SR Research Ltd., Mississauga, Ontario, Canada) with tower mount apparatus, sampling at 250 Hz. Fixations and saccades were determined using a displacement threshold of 0.1 deg spatial resolution, a velocity threshold of 30°/s and an acceleration threshold of 8000°/s2 (SR Research Ltd, 2013). Participants were seatedin front of a CRT computer screen, resolution 1280 × 1024, used to display the stimuli. A chin rest placed 40 cm from the screen reduced participants’ head movements and increased participants’ comfort. Eye movements were calibrated using a nine-point calibration, and ensured that recordings had a mean spatial error <0.5 deg for each participant. During calibration, participants were asked to fixate on the fixation crosses presented individually on screen. Drift corrections to confirm that calibrations were still valid were also implemented throughout the exper-iment (see Procedure section below). Again, a mean spatial error <0.5 deg was required for validation, where a mean spatial error >0.5 deg triggers re-calibration using a nine-point calibration. The task was run using Matlab (The Mathworks Inc., Natick, MA, R2011b) and Psychophysics Toolbox33.
Single item recognition task (SIR). The SIR task was run on a PC laptop, with a screen resolution of 1024 × 768 pix-els, using Matlab (The Mathworks Inc., Natick, MA, R2011b) and Psychophysics Toolbox33. Responses were made
by keypress and presentation was self-paced by the participant, where the mean presentation/response times in sec-onds were as follows: study items in the shallow blocks M = 1.27, SD = 0.38; study items in the deep blocks M = 1.68, SD = 0.59; test items in the shallow blocks M = 1.26, SD = 0.37; test items in the deep blocks M = 1.22, SD = 0.33.
Procedure.
All participants undertook the VPC task, immediately followed by the old/new image recognition task to avoid priming participants to consider the VPC task as a memory task.VPC task. After an initial calibration, participants were presented with a series of 40 trials. Each trial consisted of a sample phase lasting 2 seconds, during which two instances of a novel item were presented for the first time, and a test phase also lasting 2 seconds in which one instance of the previously presented, now old item was pre-sented alongside a novel item (Fig. 6a). The two items presented at study and test were displayed side-by-side (inter-stimulus gap of 158 pixels) on a white screen for 2 seconds. Participants were instructed to “simply look at the screen as if you are watching TV”. No overt recognition responses were required of participants. Lures were presented with equal probability on the left and right hand sides of the screen.
Each phase was presented for 2 s with a 0.5 s inter-trial interval, during which a black fixation-cross appeared centrally against a white background onscreen. Breaks were offered every 10 trials, during which participants had the opportunity to remove their heads from the chin-rest. Eye tracking calibrations were undertaken after every 10 trials, regardless of whether participants had taken the break. Drift corrections were also implemented every 5 trials to ensure adequate eye tracking accuracy. After completion of the 40 trials, participants were seated at a separate table in the same testing room and completed the SIR task.
whether participants were being asked to rate the amount of yellow on an item (“YELLOW?”, from “0” = “none” to “3” = “lots”; shallow processing) or rate the items friendliness (“FRIENDLY?”, from “0” = “very unfriendly” to “3” = “extremely friendly”; deep processing) for the given block (Fig. 6b). Encoding questions (“YELLOW?” in yellow, “FRIENDLY?” in blue) remained onscreen throughout the response period.
Each test phase consisted of a series of 120 serially presented test items displayed centrally onscreen. Sixty test items were targets (items seen during the preceding study phase) and 60 were lures (novel items not previously been seen at study), presented in a random order. There was a 0.5 s inter-trial interval between test items, consist-ing of a black fixation-cross appearconsist-ing centrally against a white background onscreen. For each item, participants made self-paced “OLD” or “NEW” judgements, responding by key press (1 = “OLD”, 0 = “NEW”).
Calculations
Mirroring the measures used in the animal NOR literature, a dwell-time-based Discrimination Ratio (DR), meas-ured as a proportional dwell time, was the principal measure obtained from the visual paired comparison task. The DR reflects the preferential exploration allocated to a novel item as compared to a familiar one, as a propor-tion of total explorapropor-tion time (to control for intrinsic variability in participants’ levels of explorapropor-tion). Here, dwell
Trial
Sample Phase
2 seconds
Test Phase
2 seconds
ITI
0.5 seconds
ITI
0.5 seconds
Trial
a
b
ITI 0.5s
Study-Test Block
Study Phase
Deep
Test Phase
Deep
+
+
FRIENDLY?
+
0 - 3 OLD(1) NEW(0)
ITI 0.5s
ITI 0.5s
ITI 0.5s
YELLOW?
FRIENDLY?
FRIENDLY?
0 - 3
0 - 3
OLD(1) NEW(0)
OLD(1) NEW(0)
YELLOW?
YELLOW?
0 - 3
0 - 3
0 - 3
OLD(1) NEW(0)
OLD(1) NEW(0)
OLD(1) NEW(0)
Study-Test Block
Study Phase
Test Phase
Shallow
Shallow
ITI 0.5s
ITI 0.5s
ITI 0.5s
ITI 0.5s
[image:9.595.154.511.48.493.2]times were used as a proxy for exploration time. For a given Test trial, fixation durations for the lure were summed (to give a lure dwell time, Tnew) as were those for the target item (to give a target dwell time, Told). The sum of all
fixation durations for both items was used as the total trial exploration time (Ttotal). The DR was calculated as
outlined in Eq. 1.
For sample phases, we also calculated a left/right preference DR. Here dwell times for novel and familiar items are substituted by dwell times for the left and right items, as outlined in Eq. 4.
= −
DR T T
T (4)
left right left right total
/ ( ) ( )
( )
Overall performance on the Image Judgement Task was investigated using sensitivity (d′) and bias (c) parame-ter estimates from the equal variance signal-detection model5. Hit and False Alarm rates were adjusted for
error-less responding as per34. These adjusted hit (H′) and false alarm (FA′) rates were calculated as outlined in Eqs 5
and 6, based on the absolute numbers of hits (h), misses (m), correct rejections (cr) and false alarms (fa).
′ = + . + +
H h
h m0 51 (5)
′ = + . + +
FA fa
fa cr 0 5
1 (6)
The adjusted correct rejection rate, CR′, is simply 1 - FA′. Sensitivity (d′) and bias (c) were calculated as in Eqs 2 and 3, substituting H for H′ and CR for CR′. When there are differences in d′ the same absolute c can reflect different levels of bias (relative to a participant′s sensitivity). Under these circumstances, c can be divided by d′, yielding c′5.
Statistical analysis.
All statistical tests were two-tailed. An α threshold of 0.05 was adopted for all fre-quentist statistical analyses reported. Normality of data sets were established using Shapiro-Wilks tests, and are presented in Table 1 below. It is acknowledged that measures Shapiro-Wilks test sensitivity and specificity are limited with the current sample sizes35, however, we would expect the power of these to be broadly comparableto the values of 0.51 reported from simulations run by for similar sample sizes35. Where data was not normally
distributed, a non-parametric test appropriate to the data being analysed was selected as detailed below.
Absence of a Left/Right DR in VPC study trials was analysed using a Wilcoxon signed-rank test as the data violated the assumption of normality (see Table 1). Novelty preference (i.e. the presence of a positive DR) for VPC test trials was analysed using a one-sample t-test. Time course of the DR was analysed using a repeated measures ANOVA, with Greenhouse-Geisser correction, followed by Bonferroni corrected pairwise post hoc comparisons. The effect of level of encoding on adjusted Hit rates was analysed using paired-samples t-test, and on adjusted Correct Rejections using a Wilcoxon signed-rank test as data for Correct Rejections were not normally distributed (see Table 1). The effect of level of encoding on sensitivity (d′) and was analysed using a paired-samples t-test, and on adjusted bias (c′) using a Wilcoxon signed-rank test as data for Correct Rejections
Variable W df p
Number new items presented on the left of the screen 0.863 28 0.002*
Number new items presented on the right of the screen 0.863 28 0.002*
DR for study items 0.986 28 0.959
DR for test items 0.950 28 0.203
DR for test items between 0.0–0.5 s 0.931 28 0.066
DR for test items between 0.5–1.0 s 0.938 28 0.099
DR for test items between 1.0–1.5 s 0.970 28 0.593
DR for test items between 1.5–2.0 s 0.953 28 0.23
H′ shallow 0.958 28 0.313
H′ deep 0.943 28 0.133
CR′ shallow 0.831 28 <0.001*
CR′deep 0.775 28 <0.001*
d′ shallow 0.947 28 0.170
d′ deep 0.959 28 0.326
c shallow 0.968 28 0.527
c deep 0.966 28 0.486
c′shallow 0.740 28 <0.001*
c′ deep 0.684 28 <0.001*
[image:10.595.156.415.45.270.2]were not normally distributed (see Table 1). The relationships between DR and both sensitivity (d′) and bias (c′) were analysed in a frequentist manner using Pearson’s correlation, and furthered by running multiple regressions. These same relationships were also analysed using Bayesian correlation tests. These were run using JASP (JASP Team, 2018, v0.8.6), where default parameters were used and run with a Beta prior of 1. Model robustness was tested across priors between 0 and 2 through the JASP interface.
Data availability.
The dataset generated and analysed during the current study are available from the corre-sponding authors on reasonable request.References
1. Ennaceur, A. & Delacour, J. A new one - trial test for neurobiological studies of memory in rats. 1″ Behavioral data. Behav. Brain Res.
31, 47–59 (1988).
2. Ameen-Ali, K. E., Eacott, M. J. & Easton, A. A new behavioural apparatus to reduce animal numbers in multiple types of
spontaneous object recognition paradigms in rats. J. Neurosci. Methods 211, 66–76 (2012).
3. Antunes, M. & Biala, G. The novel object recognition memory: Neurobiology, test procedure, and its modifications. Cogn. Process.
13, 93–110 (2012).
4. Kinnavane, L., Albasser, M. M. & Aggleton, J. P. Advances in the behavioural testing and network imaging of rodent recognition
memory. Behav. Brain Res. 285, 67–78 (2015).
5. Macmillan, N. a & Creelman, C. D. Detection Theory: A User’s Guide. Detection theory: A user’s guide (2nd ed.). https://doi.
org/10.1017/CBO9781107415324.004 (2005).
6. Brown, M. W. & Aggleton, J. P. Recognition Memory: What Are the Roles of the Perirhinal Cortex and Hippocampus. Nat. Neurosci. Rev. 2, (2001).
7. Miller, M. B., Handy, T. C., Cutler, J., Inati, S. & Wolford, G. L. Brain activations associated with shifts in response criterion on a
recognition test. Can. J. Exp. Psychol. 55, 162–173 (2001).
8. Aminoff, E. M. et al. Maintaining a cautious state of mind during a recognition test: A large-scale fMRI study. Neuropsychologia 67,
132–147 (2015).
9. Dobbins, I. G., Jaeger, A., Studer, B. & Simons, J. S. Use of explicit memory cues following parietal lobe lesions. Neuropsychologia 50,
2992–3003 (2012).
10. Ennaceur, A., Neave, N. & Aggleton, J. P. Neurotoxic lesions of the perirhinal cortex do not mimic the behavioural effects of fornix
transection in the rat. Behav. Brain Res. 80, 9–25 (1996).
11. Barker, G. R. I., Bird, F., Alexander, V. & Warburton, E. C. Recognition Memory for Objects, Place, and Temporal Order: A
Disconnection Analysis of the Role of the Medial Prefrontal Cortex and Perirhinal Cortex TL − 27. J. Neurosci. 27 VN-r, 2948–2957
(2007).
12. Aggleton, J. P., Albasser, M. M., Aggleton, D. J., Poirier, G. L. & Pearce, J. M. Lesions of the rat perirhinal cortex spare the acquisition
of a complex configural visual discrimination yet impair object recognition. Behav. Neurosci. 124, 55–68 (2010).
13. DeVito, L. M. & Eichenbaum, H. Memory for the Order of Events in Specific Sequences: Contributions of the Hippocampus and
Medial Prefrontal Cortex. J. Neurosci. 31, 3169–3175 (2011).
14. Morici, J. F., Bekinschtein, P. & Weisstaub, N. V. Medial prefrontal cortex role in recognition memory in rodents. Behav. Brain Res.
292, 241–251 (2015).
15. Dias, R. & Honey, R. C. Involvement of the rat medial prefrontal cortex in novelty detection. Behav. Neurosci. 116, 498–503 (2002).
16. Winters, B. D. & Reid, J. M. A Distributed Cortical Representation Underlies Crossmodal Object Recognition in Rats. J. Neurosci.
30, 6253–6261 (2010).
17. Fantz, R. L. Visual experience in infants: decreased attention to familiar patterns relative to novel ones. Science (80-.). 146, 668–670 (1964).
18. Rose, S. A., Feldman, J. F. & Jankowski, J. J. Infant visual recognition memory. Developmental Review 24, 74–100 (2004).
19. Crutcher, M. D. et al. Eye Tracking During a Visual Paired Comparison Task as a Predictor of Early Dementia. Am. J. Alzheimers.
Dis. Other Demen. 24, 258–266 (2009).
20. Zeamer, A., Meunier, M. & Bachevalier, J. Stimulus similarity and encoding time influence incidental recognition memory in adult monkeys with selective Zeamer, A., Meunier, M. & Bachevalier, J. (2011). Stimulus similarity and encoding time influence incidental
recognition memory in adult monkeys. Learn. Mem. 18, 170–180 (2011).
21. Manns, J. R., Stark, C. E. & Squire, L. R. The visual paired-comparison task as a measure of declarative memory. Proc. Natl. Acad. Sci.
USA 97, 12375–12379 (2000).
22. Cave, C. B. & Squire, L. R. Intact verbal and nonverbal short-term memory following damage to the human hippocampus.
Hippocampus 2, 151–163 (1992).
23. Juslin, P., Olsson, N. & Winton, A. Calibration and diagnosticity of confidence in eyewitness identification: Comments on what can
be inferred from the low confidence-accuracy correlation. J. Exp. Psychol. Learn. Mem. Cogn. 22, 1304–1316 (1996).
24. Craik, F. I. M. & Lockhart, R. S. CRAIK, FERGUS I. M., Levels of Processing: A Framework for Memory Research, Journal of Verbal Learning and Verbal Behavior, 11:6 (1972:Dec.) p.671. Learning 6, 671–684 (1972).
25. Clark, R. E., Zola, S. M. & Squire, L. R. Impaired recognition memory in rats after damage to the hippocampus. J. Neurosci. 20,
8853–8860 (2000).
26. Gehring, R. E., Toglia, M. P. & Kimble, G. A. Recognition memory for words and pictures at short and long retention intervals. Mem.
Cognit. 4, 256–260 (1976).
27. Zola, S. M., Manzanares, C. M., Clopton, P., Lah, J. J. & Levey, A. I. A behavioral task predicts conversion to mild cognitive
impairment and Alzheimer’s disease. Am. J. Alzheimers. Dis. Other Demen. 28, 179–84 (2013).
28. McTighe, S. M., Cowell, R. A., Winters, B. D., Bussey, T. J. & Saksida, L. M. Paradoxical false memory for objects after brain damage.
Science (80-.). 330, 36–39 (2010).
29. Romberg, C. et al. False recognition in a mouse model of Alzheimer’s disease: rescue with sensory restriction and memantine. Brain
135, 2103–2114 (2012).
30. Bertaina-Anglade, V., Enjuanes, E. & Morillon, D. & Drieu la Rochelle, C. The object recognition task in rats and mice: A simple and
rapid model in safety pharmacology to detect amnesic properties of a new chemical entity. J. Pharmacol. Toxicol. Methods 54, 99–105
(2006).
31. Wilson, D. I. G., Watanabe, S., Milner, H. & Ainge, J. A. Lateral entorhinal cortex is necessary for associative but not nonassociative
recognition memory. Hippocampus 23, 1280–1290 (2013).
32. Clark, R. E. & Squire, L. R. An animal model of recognition memory and medial temporal lobe amnesia: History and current issues.
Neuropsychologia 48, 2234–2244 (2010).
33. Brainard, D. H. The Psychophysics Toolbox. Spat. Vis. 10, 433–436 (1997).
34. Snodgrass, J. G. & Corwin, J. Pragmatics of Measuring Recognition Memory: Applications to Dementia and Amnesia. J. Exp.
Psychol. Gen. 117, 34–50 (1988).
35. Le Boedec, K. Sensitivity and specificity of normality tests and consequences on reference interval accuracy at small sample size: a
Acknowledgements
This work was supported by the Biotechnology and Biological Sciences Research Council UK (BBSRC) under the EastBio doctoral training program [grant number BB/J01446X/1].
Author Contributions
M.H.S. and I.R.C. collected data. A.K.M. was technical advisor for the use of the eye tracker. A.R.O. & J.A.A. advised on interpretation from data analyses. M.H.S. designed the study, performed data analysis and wrote the manuscript. M.H.S., A.K.M., A.R.O. & J.A.A. reviewed the manuscript.
Additional Information
Competing Interests: The authors declare no competing interests.
Publisher's note: Springer Nature remains neutral with regard to jurisdictional claims in published maps and institutional affiliations.
Open Access This article is licensed under a Creative Commons Attribution 4.0 International License, which permits use, sharing, adaptation, distribution and reproduction in any medium or format, as long as you give appropriate credit to the original author(s) and the source, provide a link to the Cre-ative Commons license, and indicate if changes were made. The images or other third party material in this article are included in the article’s Creative Commons license, unless indicated otherwise in a credit line to the material. If material is not included in the article’s Creative Commons license and your intended use is not per-mitted by statutory regulation or exceeds the perper-mitted use, you will need to obtain permission directly from the copyright holder. To view a copy of this license, visit http://creativecommons.org/licenses/by/4.0/.