the sSoTS framework
to the neural basic of preview search.
Eirini Mavritsaki, Harriet Allen, and Glyn Humphreys
Behavioural Brain Sciences Centre, School of Psychology, University of Birmingham, Edgbaston, B15 2TT, UK
Abstract. The current work aims to unveil the neural circuits under-lying visual search over time and space by using a model-based analysis of behavioural and fMRI data. It has been suggested by Watson and Humphreys [31] that the prioritization of new stimuli presented in our visual field can be helped by the active ignoring of old items, a process they termed visual marking. Studies using fMRI link the marking pro-cess with activation in superior parietal areas and the precuneus [4, 18, 27, 26]. Marking has been simulated previously using a neural-level ac-count of search, the spiking Search over Time and Space (sSoTS) model, which incorporates inhibitory as well as excitatory mechanisms to guide visual selection. Here we used sSoTS to help decompose the fMRI signals found in a preview search procedure, when participants search for a new target whilst ignoring old distractors. The time course of activity linked to inhibitory and excitatory processes in the model was used as a regres-sor for the fMRI data. The results showed that different neural networks were correlated with top-down excitation and top-down inhibition in the model, enabling us to fractionate brain regions previously linked to vi-sual marking. We discuss the contribution of model-based analysis for decomposing fMRI data.
1
Introduction
1.1 Human visual search over space and time.
that guide attention away from distractors [5]. In such cases, fMRI contrasts between (say) easy and difficult search operations fail to distinguish the different functional operations involved. One way to advance the functional analysis of fMRI data in such cases is to link the data to an explicit model of performance, which does distinguish between the different functional processes, and which can be used to predict the variation in fMRI signal as the different processes take place. Here we present an example of this using the spiking Search over Time and Space (sSoTS) model of visual search [23]. We show how sSoTS can be used to pull-apart fMRI signals associated with excitatory and inhibitory processes in search, providing a more detailed analysis of the relations between cognitive and neuronal function.
It is well known that humans utilize ”selection by space” to process only in-formation at certain locations. However, only recently have studies been designed to examine how temporal cues can be used to guide visual selection. Tradition-ally, in visual search tasks participants are asked to find a known target item amongst irrelevant distractor items, and the time it takes participant to identify the target is measured (the reaction time (RT)). The slope of the search function (RT relative to the display size of distractors) depends on the spatial features of the target and distractor items. Watson and Humphreys [31] devised a new version of visual search where the temporal as well as the spatial features of targets and distractors were varied. They adapted a standard colour-form con-junction task, but presented half of the distractors (the preview) prior to the other distractors and the target (when present). They showed that this preview search condition was facilitated relative to the standard conjunction search, with search efficiency approximating that found when the new items were presented alone (the ’single feature baseline’). Watson and Humphreys [31] proposed that temporal prioritisation in search tasks depends, at least in part, on the active ignoring of old items – a process they termed visual marking. Humphreys et al. [17] showed that visual marking is disrupted when a secondary task must be conducted during the preview, consistent with the secondary task disrupt-ing top-down ignordisrupt-ing of old items. In addition this, there is also evidence for top-down excitatory biases influencing search. For example a positive bias for expected target properties can offset the effects of an inhibitory bias against the features of old distractors [16] (induced by, for example, instructions or changes in display).
There is now considerable evidence that search is contingent on a network of neural circuits in frontal and parietal cortex that control both voluntary and reflexive orienting of attention to visual information [7]. These neural regions also overlap with areas involved in selecting targets on the basis of their temporal properties [20, 8] , suggesting that common neural processes may mediate search not only across space but also across time – as when we prioritise the selection of new over old stimuli. The inter-play between the different parts of this fronto-parietal circuit however remains much less understood.
activation within the superior parietal cortex and the precuneus. Allen et al. [4] examined preview search both when a preview task was carried out alone and under conditions of secondary task load (a visual memory task was interleaved with preview search). In a single feature baseline, the participant had to locate a blue house target amongst red house distractors. In a conjunction condition, the same target had to be found amongst blue faces and red house distractors. In the preview condition, the preview items (blue faces) appeared 2 sec before the search display (red houses and blue house target). In the visual memory task participants had to memorise the positions of dots presented before the preview display. The, after the presentation of the preview, either the dots re-appeared or the search display was presented. When the dots re-appeared the task was to judge whether one had moved location. When the search display appeared the task was to locate the target (left or right of screen). Figure 1 shows the different conditions. This study used faces and houses as search items rather that the typical lines or letters. This allowed Allen et al [4] to draw conclusions about the activity in stimulus-specific cortex (e.f. fusiform face area). Although there are differences in behaviour with these more complex stimuli, crucially, Allen et al. found a behavioural advantage for preview search which decreased when there was a memory load. Active ignoring of the preview display was associated with activation in a network of brain areas in posterior parietal cortex. These same regions were active during the visual memory task and decreased their activation for preview displays when the memory task was imposed.
1.2 Modelling search.
Over the past ten years, increasingly sophisticated computational models of vi-sual search and selection have been proposed [15, 9, 19, 24]. The importance of these models is that they generate a system-level account of performance, emerg-ing from interactions between different local components. This provides a means of examining how interactions within a complex network generate coherent be-haviour.
The majority of models to-date have used relatively high-level connectionist architectures, where (e.g.) activity within any processing unit typically mimics the behaviour of many hundreds rather than individual neurons [see [15] for an example]. Such models not only operate at a level of abstraction across indi-vidual neurons (operating at a ‘mean field’ levels; see [15] ), but they also very often include network properties divorced from real neuronal structures (e.g., with units being both excitatory and inhibitory, depending on the sign of their connection to other units). One exception to this approach comes from the work of Deco and colleagues [9, 11] who have simulated aspects of human attention with models based on ‘integrate and fire’ neurons. These networks utilise biolog-ically plausible activation functions and generate outputs in terms of neuronal spikes (rather than, e.g., a continuous value, as in many connectionist systems). Deco and colleagues have shown how classic ‘attentional’ (serial) aspects of hu-man search can be simulated by such models even when the models have a purely parallel processing architecture. This provides an existence proof that a model incorporating details of neuronal activation functions can capture aspects of human visual attention.
corresponding to the properties of the target; this corresponds to an expectation of the target. This activity combines with activity from the stimuli presented in the search display, and the output from each pool of neurons in each feature map is fed-forward into the map of locations. Activity in the location map provides an index of ‘saliency’ irrespective of the feature values involved (cf.[19]), since the location units represent the strength of evidence for ‘something’ occupying each position, but they are ‘blind’ to the features present (which are summed across the feature maps). There is then also feedback activation from the pool of units corresponding to each position in the map of locations to units at the corresponding location in the feature maps, supporting the selection of features that are linked to the highest saliency value. Over time, the model converges upon a target, with reaction times (RTs) based on the real-time operation of the neurons.
Fig. 2. The architecture of the sSoTS model: The maps outlined in bold (Blue and House maps) receive top-down excitation (for the expected target) and the maps linked to the external inhibitory pool (the Blue and Face maps) receive the top-down inhibi-tion (for the features of the preview).
Search efficiency in sSoTS is determined by the degree of overlap between the features of the target and those of distractors, with RTs lengthening as overlap increases and competition for selection increases. Consequently, search for a conjunction target (having no unique feature and sharing one feature with each of two distractors) is more difficult than search for a feature-defined target (differing from the distractors by a unique feature). Mavritsaki et al. [22, 23] showed that search in the conjunction condition also increased linearly as a function of the display size, mimicking ‘serial’ search.
20]. Provided the interval between the initial items and the search display is over 450ms or so, the first distractors in preview search have little impact on behavioural performance [31, 32]. The sSoTS model generated efficient preview search when there was an interval of over 500ms between the initial preview and the final search display. sSoTS mimics the behavioural time course due to the contribution of two processes: (i) a spike frequency-adaptation mechanism gen-erated from a slowCa2+-activatedK+current, which reduces the probability of
spiking after an input has activated a neuron for a prolonged period [21] , and (ii) a top-down inhibitory input that forms an active bias against known distractors. The slow action of frequency-adaptation simulates the time course of preview search. The top-down inhibitory bias matches data from human psychophysical studies where the detection of probes has been shown to be impaired when they fall at the locations of old, ignored distractors [3, 4]. In addition, in explorations of the parameter space for sSoTS, Mavritsaki et al. [22, 23] found that active in-hibition was necessary to approximate the behavioural data on preview search. These results, using the sSoTS model, indicate that processes of co-operation and competition between processing units may not be sufficient to account for the full range of data on human selective attention and that factors such as fre-quency adaptation are required in order to simulate the temporal dynamics of visual attention.
1.3 Linking the model to fMRI
2
The architecture of sSoTs
sSoTS consists of spiking neurons organised into pools containing a number of units with similar biophysical properties and inputs. The simulations were based on a highly simplified case where there were six positions in the visual field, allowing up to 6 items in the final search displays. sSoTS has three layers of retinotopically-organised units, each containing neurons that are activated on the basis of a stimulus falling at the appropriate spatial position. There is one layer for each feature dimension (”colour” and ”form”) and one layer for the location map (Figure 2). The feature maps encode information related to the features of the items presented in an experiment – in this case, Allen et al. [4]. For Allen et al. [4], the two different features encoded are colour and object shape, which in this case is house or face. Here the feature dimension ”colour” encoded information on the basis of whether a blue or red colour was presented in the visual field at a given position i, (i=1,...,6) (creating activity in the red and blue feature maps). The feature dimension “form” encoded information on the basis of whether there is a house or face present in the visual field at a given position i (i=1,..,6). The pools in the location map sum activity from the different feature maps to represent the overall activity for the corresponding positions in the visual field. Each of the layers contains one inhibitory pool (see also [11]) and one non-specific pool, along with the feature maps.
The system used and the connections are illustrated in Figure 2.More details about the architecture of sSoTs and the organisation of the units (neurons) in the network can be found in Mavritsaki et. al [22].
The units in the model are integrate-and-fire neurons with sub-threshold given by the equation
Cm dV(t)
dt =−gm(V(t)−VL)−Isyn(t) +IAHP (1) WhereCmis the membrane capacitance where different values are given for excitatory Cmexand inhibitory Cmin neurons; gm is the membrane leak con-ductance where different values are also given for excitatorygmexand inhibitory gminneurons;VL is the resting potential;Isyn is the synaptic current andIAHP is the current term for the frequency adaptation mechanism. The values for the above parameters as well as the threshold Vtbr and the reset potential can be found in Mavritsaki et al. [23] . The description of the synaptic currents used (NMDA,GABA, AMPA) can also be found in Mavritsaki et al. [7].
The parameters for the simulations were established in baseline conditions with ‘single feature’ and ‘conjunction’ search tasks as reported by Watson and Humphreys[31] and Allen et al. [4] (conjunction search: blue house target vs. red houses and blue faces distractors; feature search: blue face target vs. red houses distractors). The generation of efficient and less efficient (linear) search functions in these conditions replicates the results of Allen et al. [4]. These same parameters were then used to simulate preview search. The parameter w+ represents the
map. The target also benefited from an extra top-down inputλattgiven to those feature maps that represent the target’s characteristics (i.e., the colour blue and the letter H). The presence of an object in the visual field was signified by adding an additional λin value given to the external input that the system received. Overall the input that a pool could receive wasvext=vext+ (λin+λatt)/Next. In preview search top-down attention (λatt) was applied to the target’s feature maps at the onset of the search display.
RTs were based on the time taken for the firing rate of the pool in the location map to cross a relative threshold (thr). If the selected pool corresponded to the target then the search was successful (a hit trial). If the pool that crossed the threshold corresponded to a distractor rather than the target then the target was ‘missed’. Note, however, that if the parameters were set so that the target’s pool was the winner on every trial, only small differences in the slopes were observed between conjunction and single feature search, due to target activation saturating the system. Accordingly, search was run under conditions in which some errors occurred, mimicking human data. Detailed simulations, were run at the spiking level only, to match the experimental results [4]. Additionally, to simulate the working memory effect, we reduced slightly the top-down inhibition during the ‘working memory’ trials – assuming this is equivalent to the effects generated when human participants hold another stimulus in working memory during the preview period.
3
Applying the sSoTS model to fMRI data
3.1 Extraction of activation maps for top down inhibition and excitation.
To extract the brain activity relating to these processes, we first extracted a time course of the activity in each of the sSoTS maps (2 x shape, 2 x feature and the location map) over the experiment of Allen et al [4]. These time courses were convolved with a standard estimate of the heamodynamic function and used as regressors for the fMRI activity (see below). To estimate the activations asso-ciated with positive biases for targets and inhibitory biases against distractors (see Table 1) we compared the activations found for each map (for both the conjunction and preview search conditions). Thus, for conjunction search, the positive top-down bias was given by:
(Target form – distractor form) +
(Target colour – Distractor Colour)
i.e: (House – Face+ Blue – Red)
For preview search the top-down excitation was given by:
(Map with only Positive Bias –Map with no bias) +
(Map with Positive and Negative Bias- Map with only Negative Bias)
i.e: (House–Red+Blue–Face)
For preview search the top-down inhibition was given by:
(Map with only Negative Bias – Map with no Bias) +
(Map with Positive and Negative Bias – Map with only Positive Bias)
i.e: (Face–Red+Blue–House)
Table 1.Map Extraction.
Single Feature and Conjunction Map Extraction Preview Map Extraction
Maps Positive Bias SF and CJ Inhibitory Bias PV Positive Bias PV
Face NO YES NO
House YES NO YES
Blue YES YES YES
Red NO NO NO
3.2 Comparison of fMRI data with model bold responses
taking the average pool activity in a given location in the model and convolved this with a Poisson distribution. The result from the convolution was then com-pared with bold responses taken from the fMRI data (from the corresponding simulated region). Furthermore, instead of using the average pool activity the synaptic activity can also be employed. Deco et al. [10] used the synaptic activ-ity from his model and convolved it with the haemodynamic response function suggested by Glover [14]. In our effort to compare our theoretical data with the fMRI experimental data we used the average synaptic activity from the pools in the model’s feature maps. This average synaptic pool activity was then directly compared with the observed bold data from Allen et al. [4], using the synaptic activity as regressors for the fMRI analysis.
We note that there was no top-down inhibitory bias applied during con-junction search. However, activity in the same maps was examined in order to provide a baseline with the preview search task. After extracting the activity maps from the model, we averaged over 20 trials for each condition and we took the changing time course of activity reflecting top-down inhibition and top-down excitation activity for each condition. This activity was convolved using an as-sumed haemodynamic response function [10] to create a time series of predicted bold activity. This time series was then used as a regressor for the fMRI data in the contrasting search conditions.
fMRI analysis was done using FEAT, part of fsl (www.fmrib.ox.ac.uk/fsl). The data were pre-processed as in Allen et al. [4], including correction for head movement, within scan signal intensity normalisation, high pass temporal filter-ing (to remove slow wave artifacts). The time course for each map in the model was entered as a separate regressor. Positive and negative biases were estimated by combining the regressors for each map as desribed above. Z (Gaussianised T/F) statistic image were thresholded using clusters determined by Z>2.3 and a (corrected) cluster significance thresholded of P=0.05.
4
Results
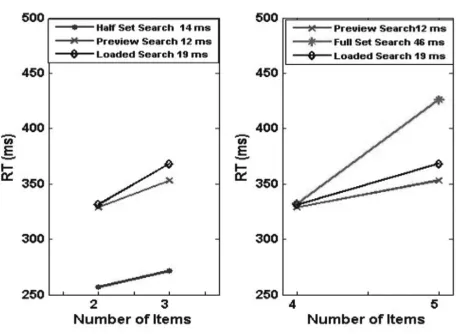
The behavioural results generated by sSoTS matched the classical findings on single feature, conjunction and preview search [31]. In the single feature condition (the half set baseline), the search slope was 14 ms/item; for the preview condition it was 12 ms/item, and it was 46 ms/item for the conjunction condition (the full set baseline). When a working memory task was added (the loaded search condition), the slope of the preview condition increased to 19 ms/item (see Figure 3).
Fig. 3.The slopes generated by sSoTS for single feature search (the half set baseline), conjunction search (the full set baseline), standard preview search and preview search with a working memory load (the loaded search condition). On the left we present the preview and the loaded search conditions compared with the half set baseline, with the display size matched to the number of items in the second search display in the preview condition. On the right we show the preview and the loaded search conditions in comparison with the full set baseline, with the display size matched to the number of items on the final screen of the preview condition (preview + search items).
lateral parietal cortex for top-down excitatory activity predicted by sSoTS. In contrast, top-down inhibitory activity in the model was correlated with fMRI activation in the medial precuneus (Z=50) (Figure 4). Here the model-based analysis distinguishes two functionally different operations taking place when observers attempt to ignore the preview and to prioritise search to new items [5].
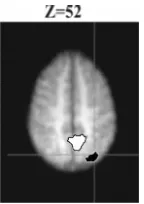
We also examined the differences between bold activity in the preview and conjunction search conditions in relation to the activation differences between the these conditions apparent in sSoTS (comparing activity in the critical maps in preview and conjunction search). In sSoTS these activation differences are driven by the application of top-down inhibition in preview search. The results showed a reliable correlation between the activation differences in sSoTS and increased activation in the precuneus in preview search compared with the con-junction condition. There was also a correlation between differences in activity in the conjunction and preview conditions in sSoTS and increased activity for the conjunction condition over the preview condition in lateral parietal cortex (Z=52) (see Figure 5). This may reflect the increased role of excitatory guidance to the target in the conjunction condition.
Fig. 4. This figure presents the areas that show bold activity correlated with top-down inhibition in sSoTS (white with black outline) and those where bold activity correlated with top-down excitation in the model (black with white outline). Top-down inhibition in the model (maps: (1-4)+(3-2)) was associated with activity the medial precuneus, while top-down excitation in the model (maps: (2-4)+(3-1)) was associated with activity in the lateral parietal cortex (right hemisphere).
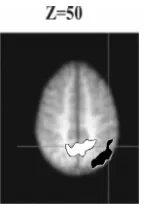
increase in bold activity in the standard preview compared with the working memory condition in the precuneus, and (ii) an increase in bold activity in the working memory condition compared with the standard preview in lateral parietal cortex (Z=50) (Figure 6). These results fit with there being reduced inhibitory activity under conditions of working memory load, along with an increased role for top-down activation for the target under the more difficult working memory condition.
[image:12.595.273.345.453.555.2]Fig. 6.Comparisons between the standard preview condition and the condition where preview search was conducted with a working memory load (the loaded search condi-tion) [4]. The white with black outline regions reflect correlations between (i) top-down inhibitory activity in sSoTS and (ii) increased activation in standard preview search compared with the loaded search condition. The blue with white outline regions re-flect correlations between (i) top-down inhibitory activity in sSoTS and (ii) increased activation in the loaded search condition compared with standard preview search.
5
Conclusions
It now remains for empirical studies to test the predictions arising from this modelling-fMRI study. For example, damage to inferior parietal cortex ought to mean that patients are impaired at exploiting any positive expectancy for up-coming targets, to facilitate search. In contrast, patients with damage to more medial and superior parietal regions (including the precuneus) ought to have problems in suppressing irrelevant distractors. While damage to posterior pari-etal cortex has been shown to disrupt preview search [25], the precise factors involved, and whether they might differ across patients, has not been explored. The analysis with sSoTS predicts that differences should emerge as finer-grained analyses of patient sub-groups is undertaken.
References
1. Abeles A. Corticonics Cambridge University Press 1991
2. Agter A. and Donk M.: Prioritized selection in visual search through onset capture and color inhibition: Evidence from a probe-dot detection task. Journal of Exper-imental Psychology: Human Perception and Performance.31(2005) 722–730 3. Allen H.A. and Humphreys G.W. Previewing distracters reduces their effective
contrast. Vision Research 47(2007) 2992–3000
4. Allen H.A., Humphreys G.W. and Matthews P.M.: A neural marker of content-specific active ignoring. JEP:HPP.34(2008) 286–297
5. Braithwaite J.J. and Humphreys G.W.: Inhibition and anticipation in visual search: Evidence from effects of color foreknowledge on preview search. Perception and Psychophysics.65(2003) 312–337
6. Brunel N. and Wang X.: Effects of neuromodulation in a cortical networks model of object working memory dominated by current inhibition. Journal of Computational Neuroscience.63-85(2001) 63–85
7. Corbetta M., Kincade J. M., Ollinger J. M., McAvoy M. P. and Shulman G.L. Voluntary orienting is dissociated from target detection in human posterior parietal cortex. Nature Neuroscience3(2002) 292–297
8. Coull J.T. Neural correlates of attention and arousal: Insights from electrophysiol-ogy, functional neuroimaging and psychopharmacology. Progress in Neurobiology textbf55 (1998) 343–361
9. Deco G. and Zihl J.: Top-down selective visual attention: A neurodynamical ap-proach. Visual Cognition.8(1) (2001) 119-140
10. Deco G., Rolls E., Horwitz B. Integrating fMRI and single-cell data if visual work-ing memory. Neurocomputwork-ing58-60(2004) 729–737
11. Deco G. and Rolls E.: Neurodynamics of biased competition and cooperation for attention: a model with spiking neuron. Journal of Neurophysiology. 94 (2005) 295–313
12. Friston K. J., Jezzard. P. and Turner R. Analysis of functional MRI time-series. Human Brain Mapping1(1994) 153–171
13. Gorchs S. and Deco G. Feature-based attention in human visual cortex: simulation of fMRI data. NeuroImage21(2004) 36–45
14. Deconvolution of impulse response in event-related BOLD fMRI. NeuroImage 9 (1999) 419–429
16. Humphreys G.W., Duncan J. and Treisman, A. Pre-frontal cortex and the neural basis of executive function. In. Attention space and Action: Studies in cognitive neuroscience. Ed. Miller, E.K Oxford University Press 1998
17. Humphreys G.W., Jolicoeur P. and Watson D.: Fractionating the preview benefit in search: Dual-task decomposition of visual marking by timing and modality. Journal of Experimental Psychology: Human Performance and Perception.28 (3) (2002) 640–660
18. Humphreys G.W., Kyllinsbaek S., Watson D.G., Olivers C.N.L., Law I. and Paul-son O.: Parieto-occipital areas involved in efficient filtering in search: A time course analysis of visula marking using behavioural and functional imaging procedures. Quarterly Journal of Experimental Psychology.57A(2004) 610-635
19. Itti L. and Koch C. A saliency-based search mechanism for overt and covert shifts of visual attention. Vision Research40(2000) 1489–1506
20. Kanswisher N. and Wocjiulik E. Visual attention: insights from brain imaging. Nature Reviews Neuroscience1(2000) 91–100
21. Madison D. and Nicoll R. Control of the repetitive discharge of rate ca1 pyramidal neurons in vitro. Journal of Physiology345(1984) 319–331
22. Mavritsaki E., Heinke D., Humphreys G.W. and Deco G.: Suppressive effects in visual search: A neurocomputational analysis of preview search. Neurocomputing. 70(2007) 1925-1931
23. Mavritsaki E., Heinke D., Humphreys G.W. and Deco G.: A computational model of visual marking using an interconnected network of spiking neurons: The spiking Search over Time and Space model (sSoTS). Journal of Physiology Paris. 100 (2006) 110-124
24. Mozer M.C. and Sitton M. Computational modelling of spatial attention. In At-tention, Ed. Pashler 341–388
25. Olivers C.N.L. and Humphreys G.W.: Spatiotemporal segregation in visual search: Evidence from parietal lesions. Journal of Experimental Psychology30(4) (2004) 667–688
26. Olivers C.N.L., Smith S., Matthews P.M. and Humphreys G.W.: Prioritizing new over old: An fMRI study of the preview search task. Human Brain Mapping. 24 (2005) 69-78
27. Pollman S., Weidner R., Humphreys G.W., Olivers C.N.L., Muller K. and Lohmann G.: Separating segmentation and target detection in posterior parietal cortex-an event-related fMRI study of visual marking. NeuroImage.18(2003) 310–323 28. Rolls E. and Deco G. Computational neuroscience of vision. Oxford University
Press 2002
29. Rolls E. and Treves A. Neural networks and brain function. Oxford University Press 1998
30. Tuckwell H. Introduction to theoretical neurobiology. Cambridge University Press 1998
31. Watson D. and Humphreys G.W.: Visual marking: Prioritizing selection fir new objects by top-down attentional inhibition of old objects. Psychological Review. 104(1997) 90–122
32. Watson D., Humphreys G.W. and Olivers C.N.L.: Visual marking: using time in visual selection. Trends in Cognitive Sciences.7(4) (2003) 180–186
![Fig. 1. This figure presents the displays for the 3 conditions in Allen et al. [4], for thethree scans (Search scan, Preview scan, and Working Memory scan).](https://thumb-us.123doks.com/thumbv2/123dok_us/8720187.384499/3.595.194.424.401.631/gure-presents-displays-conditions-thethree-preview-working-memory.webp)