A Performance-Driven Approach for Restructuring
Distributed Object-Oriented Software
Amal Abd El-Raouf1, Tahany Fergany2, Reda Ammar3, Safwat Hamad4
1Computer Science Department, Southern CT State University, New Haven, CT, USA; 2Computer Science Department, University of
New Haven, CT, New Haven, USA; 3Computer Science and Engineering Department, University of Connecticut, CT, Storrs, USA; 4Computer & Information Sciences Department, Ain Shams University, Abbassia, Cairo, Egypt.
Email: [email protected], {tfergany, reda}@engr.uconn.edu
Received March 1st, 2009; revised May 6th, 2009; accepted May 29th, 2009.
ABSTRACT
Object oriented techniques make applications substantially easier to build by providing a high-level platform for appli-cation development. There have been a large number of projects based on the Distributed Object Oriented approach for solving complex problems in various scientific fields. One important aspect of Distributed Object Oriented systems is the efficient distribution of software classes among different processors. The initial design of the Distributed Object Oriented application does not necessarily have the best class distribution and may require to be restructured. In this paper, we propose a methodology for efficiently restructuring the Distributed Object Oriented software systems to get better performance. We use Distributed Object-Oriented performance (DOOP) model as guidance for our restructuring methodology. The proposed methodology consists of two phases. The first phase introduces a recursive graph clustering technique to partition the OO system into subsystems with low coupling. The second phase is concerned with mapping the generated partitions to the set of available machines in the target distributed architecture.
Keywords:Performance Modeling, Distributed Object Oriented, Restructuring Methodology
1. Introduction
The software restructuring techniques present solutions for the hardware/software mismatch problem in which the software structure does not match the available hardware organization [1,2,3,4]. There are two approa- ches to solve such a problem; either to configure the hardware to match the software components (hardware reconfiguration), and/or to reconfigure the software structure to match the available hardware by reorganiz-ing its components (software restructurreorganiz-ing). The first approach is impractical especially in complex programs containing many interacting modules (or subtasks). The second approach is more practical especially in comput-ing environments that contain large number of users. It provides an optimal way to use the available system ca-pabilities, reduces the overall computational cost, and improves the overall system performance.
The basic idea of distributed software restructuring techniques as described in [2] is to select the best alter-native structure(s) for a constrained computing environ-ment while reducing the overall resources need. These structures can be created through; granularity definition (merging of modules), alternative modules ordering, loop
decomposition, or multiple servers support. It has been shown that performing software restructuring ahead of the partitioning, allocation and scheduling phases im-proved the results obtained from these phases and re-duced the overall resources cost. Unfortunately this technique is not applicable for Distributed Object Ori-ented (DOO) systems.
sequential message-passing-oriented paradigm of ob-jects.
Designing a distributed Object Oriented application depends on how performance-critical the application is. An important phase is to tune performance by “concre-tizing” object locations and communication methods [10]. At this stage, it may be necessary to use tools to allow analysis of the communication patterns among objects in order to take the right allocation decision.
The principal goal of this research is to develop new methodology for efficiently restructuring the DOO soft-ware to fully exploit the system resources and get better performance.
This paper is organized as follows: the second section states the problem definition, including our objective and assumptions. Section 3 describes the analytical DOOP model its basic components and how it can be used to measure the communication cost between different classes. Section 4 presents the restructuring scheme and the algorithm used in the first phase and the different approaches proposed for the second phase of the re-structuring process. Then a comparison and analysis of generated results are included within Section 5. Finally, Section 6 draws our conclusions.
2. Problem Definition
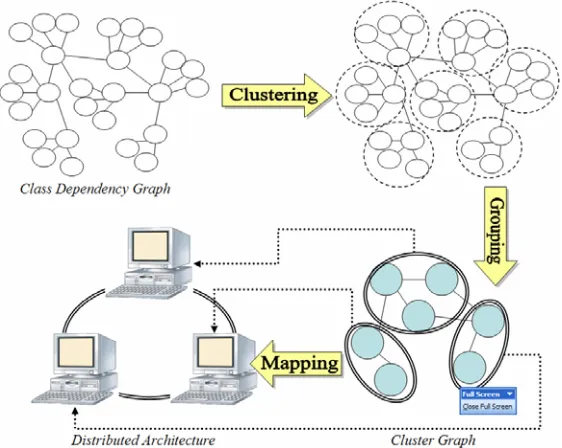
In this paper, we consider restructuring DOO applica-tions for mapping on a distributed system that consists of a collection of fully connected homogenous processors in order to attain better performance. This process is achieved in two phases illustrated in Figure 1. The first phase is concerned with identifying clusters of a dense
community of classes within the DOO system. This helps in decomposing the system into subsystems that have low coupling and are suitable for distribution. The inter-class communication is modeled as a class de-pendency graph. In the second phase, we investigate the possibilities of grouping the generated clusters and map-ping them to the nodes of the distributed system. The main objective is to propose a group of sub-systems, each has maximum communication cost among the in-ner-classes and the communication cost among the sub- systems is minimized. Then, the proposed group of sub-systems is mapped to the available nodes in the dis-tributed system.
3. Distributed Object-Oriented Performance
Model
Performance analysis is a very important phase during the software development process. It will ensure that the system satisfies its performance objectives. Performance analysis will not only evaluate the resources utilization but also will allow comparing different design alterna-tives, detecting bottlenecks, maintenance, re-use and identify the tradeoffs.
Most OO approaches studying the performance of OO systems are based on either the system measurements after its development or mapping it to a conventional performance model and hence no way to preserve the OO features during the analysis phase.
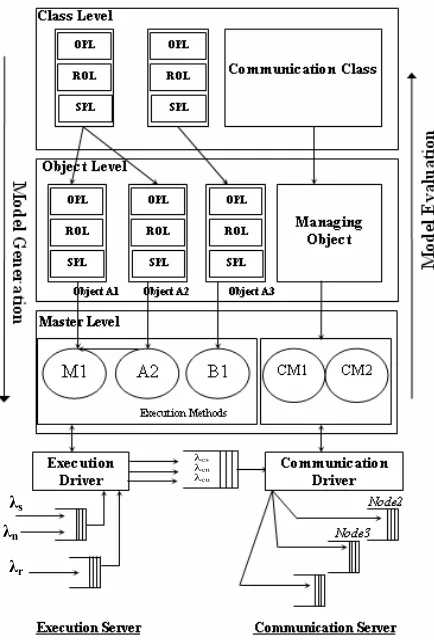
[image:2.595.158.439.475.699.2]In [11], the Distributed Object Oriented Performance (DOOP) model was introduced. The DOOP model ana-lyzes and evaluates the overall time cost considering the
Figure 2. The DOOP model node structure
communication overheads while preserving the features, properties and relationships between objects. According to the model, each node in a DOO system will be repre-sented as shown in Figure 2.
The performance model consists of two main parts: the execution server and the communication server. The execution server represents and evaluates the execution cost of the software modules that reside on the target node. The communication server provides the analysis of the communication activities (including objects updating) as well as the evaluation of the communication cost.
In our restructuring scheme, we utilize the DOOP model in the evaluation process of the communication activities among classes as shown below.
Assume that the overall arrival rate to the communica-tion queue ck is given by:
ck cs cn cu
(1)
where cs, cn and cu represent the communication arri-val due to External User Request (EUR), Remote Re-quest (RR), and updating objects’ data on other nodes, respectively.
1
, , N
cs s s cn n n cu Ui
i
where, βs and βn are the message multipliers for EUR and RR. Let cui be the arrival rate corresponding to object i data updating.
Since the updating process to an object i occurs due to processing EUR or RR, Pi1 defined to be the probability that object i is updated due to EUR, Pi2 is the probability that object i is modified due to RR. cui can be expressed as:
1 2
cui Pi s Pi n
Hence, the expected communication service time for each class will be:
s n u
cs cn ui
m m
t t t
R R
mi
R
where tcs, tcn and tui are the expected communication ser-vice time for EUR, RR and for update requests from ob-ject i. While ms, mn and mui are the expected message sizes of EUR, RR and of sending object i updating data. R is the communication channel capacity. Furthermore, the average communication service time for node (k) will be: λcs λcn λcu λs λn 1 N
ck cs cs cn cn ui ui i
t P t P t P t
(2)
λr ck cs cs p ck cn cn p ck ui ui p
where Pcs, and Pcn are the probabilities of activating communication service by the external user requests and by remote request respectively. Pui is the probability of sending object i’s data update to other nodes.
4. Restructuring Scheme
Our restructuring scheme starts with using the DOOP model to map the distribute Object Oriented application into a Class Dependency Graph (CDG) illustrated in the following subsection. Then this CDG is restructured us-ing our two-phase methodology. The first phase is based on a recursive use of a spectral graph bi-partitioning al-gorithm to identify dense communities of classes. The second phase is concerned with mapping the generated partitions to the set of available machines in the target distributed architecture. We will describe two proposed approaches: the Cluster Grouping Approach and the proposed Double K-Clustering Approach. The details of each phase are described in the following subsections.
4.1 The Class Dependency Graph (CDG)
Figure 3. A graph dependency graph for interclass communication
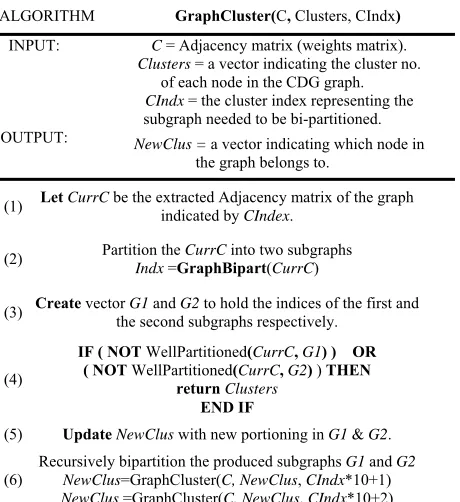
ALGORITHM GraphCluster(C, Clusters, CIndx)
INPUT: C = Adjacency matrix (weights matrix).
Clusters = a vector indicating the cluster no. of each node in the CDG graph. CIndx = the cluster index representing the subgraph needed to be bi-partitioned. OUTPUT: NewClus = a vector indicating which node in
the graph belongs to.
(1) LetCurrC be the extracted Adjacency matrix of the graph indicated by CIndex.
(2) Partition the CurrC into two subgraphs Indx =GraphBipart(CurrC)
(3) Create vectorthe second subgraphs respectively. G1 and G2 to hold the indices of the first and
(4)
IF ( NOT WellPartitioned(CurrC, G1) ) OR ( NOT WellPartitioned(CurrC, G2) ) THEN
returnClusters
END IF
(5) Update NewClus with new portioning inG1 & G2. (6)
[image:4.595.184.414.216.467.2]Recursively bipartition the produced subgraphs G1 and G2 NewClus=GraphCluster(C, NewClus, CIndx*10+1) NewClus =GraphCluster(C, NewClus, CIndx*10+2)
Figure 4. A recursive graph clustering algorithm
tical tool to accurately evaluate the communication ac-tivities among classes in a distributed OO system. The calculated values will be used to generate the Class De-pendency Graph (CDG) of the given OO application.
The class dependency graph CDG as shown in Figure 3 is a graph representation for interclass communications. In CDG, each class is represented as a vertex and an edge between class A and B represents a communication activity that exists between these two classes due to ei-ther data transfer or classes’ dependency. The weight of the edge WAB represents the cost of that communication activity between class (A) and class (B). If no data communication or relationship dependency has been recognized between two classes, no edge will connect them in the CDG.
4.2 First Phase: Clustering System Classes
In this section, we describe a clustering technique that is considered the first primary phase of the restructuring
obsolete and the algorithm will backtrack to the clusters generated in the previous step. At the end, the identified sub-graphs are the suggested clusters of the system. Fig-ure 4 shows a detailed step by step description of the clustering Algorithm as described in [12].
The mathematical derivation of the spectral factoriza-tion algorithm used in our clustering approach was in-troduced in [13]. It is originally solving the l-bounded Graph Partitioning (l-GP) problem. However, we have adapted the solution methodology to fit within our bi-partitioning approach.
4.3 Second Phase: Mapping Classes to Nodes
In this phase, the restructuring process is accomplished by mapping the set of DOO application clusters, resulted from the first phase to the different network nodes in order to attain better performance. To achieve this goal, we perform the mapping process taking into considera-tion our objective of minimizing the effect of class de-pendency and data communication. It is assumed that the target distributed system consists of a set of homogene-ous processors that are fully connected via a communi-cation network.
The mapping process has two cases. The first case appears when the number of candidate clusters are less than or equal to the number of the available nodes. In this case the mapping process will be done simply by assigning each cluster to one of the available nodes. The problem occurs in the second case, when the number of the generated clusters exceeds the number of available nodes. This is a more realistic view since there will be always huge software systems with large number of classes and limited hardware resources.
In the following subsections, we are going to intro-duce two different approaches to be used in performing the grouping and mapping steps of the second phase: the Cluster Grouping Approach and the Double K-Clustering Approach. In Section 5, the results would be compared with the direct K-Partitioning Approach listed in Figure 4, where the graph is partitioned into a pre-specified number equals exactly to the number of nodes in the target distributed system. This is a one step allocation process that also maintains the criterion of minimizing inter-cluster communication cost.
4.3.1 The Cluster Grouping Approach:
In this approach, we use the clusters (sub-systems) gen-erated at the first phase as the main candidates for dis-tribution. The technique is based on merging clusters into groups in a way that keeps the communication costs among them minimized. As a result a cluster graph is formed, where the nodes represent clusters and the edges will capture the possible communication links that may exist among clusters. Then, the K-Partitioning algorithm is used to perform cluster grouping such that the number
of the resultant groups is equal to the number of avail-able nodes. The result will be groups of clusters that have minimal communication costs among them. Finally, those groups are assigned to the different available nodes in the distributed environment.
4.3.2 The Double K-Clustering Approach:
The K-Partitioning algorithm can not predict the number of system modules or clusters as the recursive Bi-Partitioning algorithm does. Instead, the number of required clusters must be given as an input parameter which is the k value. Hence, we will make use of the advantages provided by both algorithms: the recursive Bi-Partitioning and the K-Partitioning. So, the first phase described in Section 3 is considered as a pre-phase to estimate the number of the existing sub-systems within the distributed application. However, we will use the K-Partitioning algorithm twice. In the first time, the original class dependency graph CDG is clustered ac-cording to the number suggested at the pre-phase. In the second time the K-Partitioning algorithm is used again in the same way as in the cluster grouping approach illus-trated above such that the number of the resultant groups is equal to the number of available nodes. Then, the re-sultant clusters are mapped to the available nodes.
5. Simulation and Results
In the section, we provide an analysis of both the clus-tering and the mapping phases described above. This illustration is done through a case study which describes the detailed steps of the two-phase restructuring process and a set of simulation experiments that were performed to validate our results.
5.1 Case Study
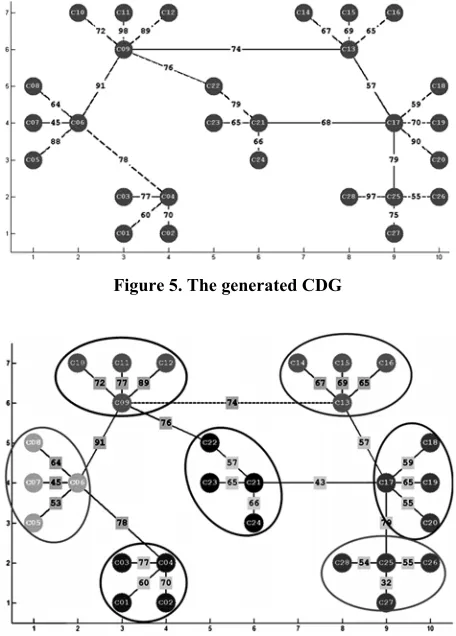
We have developed a performance-driven restructuring simulator using Matlab 7.0.4. A Graphical User Interface (GUI) utility has been implemented to show the system status after each step while the algorithm proceeds. The simulator has a friendly user interface that allows the user to specify the nodes and edges in the systems, and then it will be able to generate the class dependency graph (CDG).
Figure 5. The generated CDG
Figure 6. The resultant clusters generated by the restructuring scheme first phase
Figure 7. Mapping the DOO system to a 4-node environment using the direct partitioning approach
is marked up with a different color and surrounded by an oval for further highlight.
Now, let us assume that the target distributed envi-ronment consists of 4 homogenous nodes that are fully connected. We need to apply any one of the second phase approaches to map the classes to the distributed
nodes. First we applied the direct approach that parti-tioned the original CDG into 4 clusters using the k-partitioning algorithm. The resultant clusters are de-picted in Figure 7. In Figure 8 the Cluster Grouping ap-proach is applied to merge the clusters in Figure 8 gener-ating 4 large clusters. However, applying the Double-K clustering approach results in a completely different group of clusters as shown in Figure 9. It started with generating 7 clusters then they were grouped into 4 clus-ters. The first one includes {C1, C2, C3, C4, C5, C6, C7, C8}, the second one {C9, C10, C11, C12, C13, C14, C15, C16, C17, C18, C19, C20, C22, C25, C26, C28}, the third {C21, C23, C24}, and the last one includes only C27.
Notice that each one of the approaches resulted in a different grouping option, each of which has a different communication cost. The Direct Partitioning Approach results in a communication cost equals to 267 time unit. While the Cluster Grouping resulted in a cost of 265 time units, the Double-K produced a grouping of cost 223 time units.
[image:6.595.59.285.451.604.2]Figure 8. Mapping the DOO system to a 4-node environment using the cluster grouping approach
[image:6.595.313.535.546.695.2]5.2 Numerical Results
We conducted a number of experiments using a set of DOO applications, whose class dependencies were ran-domly generated. The generated matrices are assumed to represent the adjacency matrices of the CDG for the sys-tems under inspection. The Adjacency matrices are gen-erated by Andrew Wathen method proposed in [14]. The resultant matrices are random, sparse, symmetric, and positive definite.
In Figure 10, the X-axis represents the number of nodes in the target distributed environment and the Y-axis represents the communication cost in units of time that measured between classes located in different nodes. The decision of allocating a group of classes to a specific node is made by one of three algorithms. Two of them are the algorithms proposed above: the Cluster Grouping Approach and the Double K Approach. The third one is the well-known K-Partitioning approach.
Each data point in the comparison chart is an average of a set of many trials. In each trial, the adjacency matrix of the CDG is generated randomly having 107 classes. For each generated random matrix, the Bi-Partitioning algorithm was used to verify that it will result in exactly 11 clusters, otherwise the matrix is neglected and another one is generated.
The performance comparison depicted in Figure 10 shows that the Double-K Clustering Approach provides the best performance over the other algorithms since it gives the minimum interclass communication cost for various numbers of nodes (machines). Then comes the
cluster grouping approach and at last comes the K-Partitioning approach. However, when the number of generated clusters equals to the number of machines or nodes, the proposed Double-K Clustering Approach gives typically the same results as that of the K-Parti-tioning algorithm. This is a logical finding since in this case the second clustering step in the Double-K Cluster-ing approach is eliminated reducCluster-ing the approach to the original K-Partitioning Algorithm.
In order to confirm the correctness of the proposed methodologies, we have conducted a number of experi-ments using various sets of classes and their associated clusters. These classes were generated randomly and the results were averaged just like the experiment illustrated above. Table 1 and Table 2 present the communication costs computed for each partition generated by the three approaches when applied on different sets of classes. Each table represents a simulation evaluation targeting a distributed system architecture composed of a predeter-mined number of machines. Figure 11 and Figure 12 show the results when using 4 and 6 machines respec-tively.
The simulation results came to be consistent with the results discussed in the case study presented above. That is, while changing the number of classes as well as the structure of the underlying distributed architecture, it is still the same remarks. The proposed two approaches Cluster Grouping and Double K-Clustering outperform the Direct Partitioning Approach as long as the number of nodes is less than the number of generated clusters.
1000 1800 2600 3400 4200 5000 5800 6600
3 4 5 6 7 8 9 10 11
Number of Nodes
C
om
m
uni
c
a
ti
on C
os
t
[image:7.595.157.439.447.585.2]DoubeK Cluster Grouping K-Partition
Figure 10. Interclass communication cost measured after applying different restructuring approaches
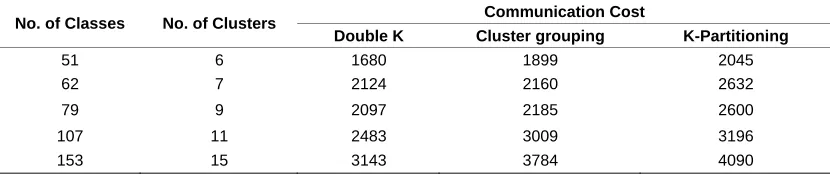
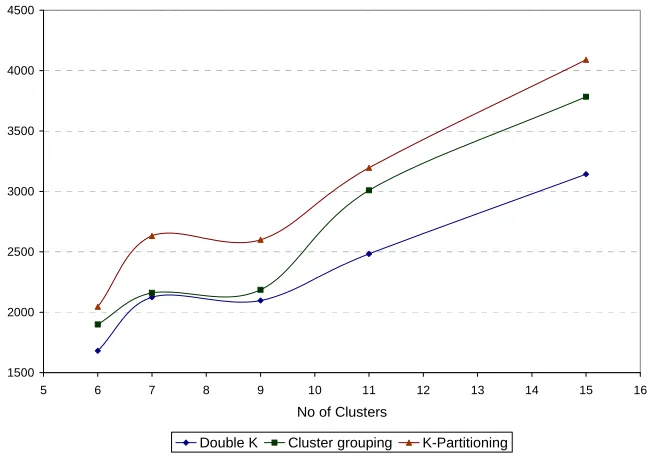
Table 1. Simulation results considering a distributed architecture consisting of four nodes
Communication Cost No. of Classes No. of Clusters
Double K Cluster grouping K-Partitioning
51 6 1680 1899 2045
62 7 2124 2160 2632
79 9 2097 2185 2600
107 11 2483 3009 3196
[image:7.595.90.505.633.720.2]1500 2000 2500 3000 3500 4000 4500
5 6 7 8 9 10 11 12 13 14 15 1
No of Clusters
Commu
nication
cost
6
[image:8.595.140.464.91.318.2]Double K Cluster grouping K-Partitioning
[image:8.595.102.491.370.702.2]Figure 11. The simulation result of mapping different DOO systems with different number of classes on four nodes
Table 2. Simulation results considering a distributed architecture consisting of six nodes
Communication Cost No. of Classes No. of Clusters
Double K Cluster grouping K-Partitioning
51 6 2908 2911 2908
62 7 3079 3204 3453
79 9 3069 3205 3608
107 11 3565 3924 4117
153 15 4562 4978 5399
2500 3000 3500 4000 4500 5000 5500
6 7 8 9 10 11 12 13 14 15 16
No. of Clusters
Communicat
io
n
Cos
t
Double K Cluster grouping K-Partitioning
6. Conclusions
In this paper, we proposed a restructuring approach for DOO applications into a distributed system consisting of a collection of fully connected homogenous processors. The restructuring process was performed in two phases: the clustering phase and the mapping phase. The first phase is based on the theory of spectral graph bi-parti- tioning, where the Distributed Object Oriented perform-ance model was used efficiently to evaluate the commu-nication costs between different classes. In the second phase, the identified subsystems were assigned to differ-ent machines in the target distributed environmdiffer-ent. This is done through two proposed algorithms: cluster group-ing approach and the Double-K Clustergroup-ing approach. A Comparison was made between the proposed approaches and the k-partitioning algorithm. The results showed that the Double-K Clustering Approach provides the best performance in terms of minimizing the communication cost among classes located on different nodes (ma-chines).
REFERENCES
[1] A. Raouf, R. Ammar, and T. Fergany, “Object oriented performance modeling and restructuring on a pipeline architecture,” The Journal of Computational Methods in Science and Engineering, JCMSE, IOS Press, Vol. 6, pp. 59-71, 2006.
[2] T. A. Fergany, “Software restructuring in performance critical distributed real-time systems,” Ph. D. Thesis, University of Connecticut, USA, 1991.
[3] T. A. Fergany, H. Sholl, and R. A. Ammar, “SRS: A tool for software restructuring in real-time distributed envi-ronment,” in the Proceedings of the 4th International
Conference on Parallel and Distributed Computing and Systems, October 1991.
[4] H. Sholl and T. A. Fergany, “Performance-require- ments-based loop restructuring for real-time distributed systems,” in the Proceedings of the International Confer-ence on Mini and Microcomputers, From Micro to Su-percomputers, Florida, December 1988.
[5] B. Meyer, “Object-oriented software construction,” Pren-tice-Hall International (UK), Ltd, 1988.
[6] Ostereich, “Developing software with UML: OO analysis and design in practice,” Addison Wesley, June 2002. [7] J. K. Lee and D. Gannon, “Object oriented parallel
pro-gramming experiments and results,” in the Proceedings of Supercomputing 91, IEEE Computer Society Press, Los Alamitos, Calif, pp. 273-282, 1991.
[8] Sun Microsystems Inc. Java home page, http://www.java- soft.com.
[9] J. Waldo, G. Wyant, A. Wollrath, and S. Kendall, “A note on distributed computing,” Sun Microsystems Laboratories, Technical Report-94-29, November 1994. [10] I. Sommerville, “Software Engineering,” 8th Edition,
Addison-Wesley Publishers Ltd, New York, 2007. [11] A. A. El-Raouf, “Performance modeling and analysis of
object oriented software systems,” PhD Dissertation, Department of Computer Science & Engineering, Uni-versity of Connecticut, 2005.
[12] S. Hamad, R. Ammar, A. Raouf, and M. Khalifa, “A performance-driven clustering approach to minimize coupling in a DOO system,” the 20th International Con-ference on Parallel and Distributed Computing Systems, Las Vegas, Nevada, pp. 24-26, September 2007.
[13] J. P. Hespanha, “An efficient MATLAB algorithm for graph partitioning,” Technical Report, Department of Electrical & Computer Engineering, University of Cali-fornia, USA, October 2004.