Visual discomfort and the spatial distribution of Fourier energy
Olivier Penacchio1,2 and Arnold Wilkins3
1. Computer Vision Centre, Universitat Autònoma de Barcelona 2. School of Psychology and Neuroscience, University of St Andrews 3. Department of Psychology, University of Essex
Address for correspondence
Dr Olivier Penacchio
School of Psychology and Neuroscience, University of St Andrews
St Andrews, Scotland KY16 9JP
Abstract
Quite independently of what they represent, some images provoke discomfort, and even headaches and seizures in susceptible individuals. The visual system has adapted to
efficiently process the images it typically experiences, and in nature these images are usually scale-‐invariant. In this work, we sought to characterize the images responsible for
discomfort in terms of their adherence to low-‐level statistical properties typically seen in natural scenes. It has been conventional to measure scale invariance in terms of the one-‐ dimensional Fourier amplitude spectrum, by averaging amplitude over orientations in the Fourier domain. However, this loses information on the evenness with which information at various orientations is represented. We therefore fitted a two-‐dimensional surface (regular circular cone 1/f in logarithmic coordinates) to the two-‐dimensional amplitude spectrum. The extent to which the cone fitted the spectrum explained an average of 18% of the
variance in judgments of discomfort from images including rural and urban scenes, works of non-‐representational art, images of buildings and animals, and images generated from randomly disposed discs of varying contrast and size. Weighting the spectrum prior to fitting the surface to allow for the spatial frequency tuning of contrast sensitivity explained an average of 27% of the variance. Adjusting the shape of the cone to take account of the generally greater energy in horizontal and vertical orientations improved the fit, but only slightly. Taken together, our findings show that a simple measure based on first principles of efficient coding and human visual sensitivity explained more variance than previously
published algorithms. The algorithm has a low computational cost and we show that it can identify the images involved in cases that have reached the media because of complaints. We offer the algorithm as a tool for designers rather than as a simulation of the biological processes involved.
1. Introduction
Viewing certain patterns, typically of stripes, can sometimes result in a variety of bodily symptoms and perceptual distortions, often collectively referred to as visual stress (Wilkins, 1995). The bodily symptoms can include discomfort, malaise and nausea and the perceptual symptoms can involve perceptual instability and hallucinatory colours and shapes. The patterns responsible are usually those that in patients with photosensitive epilepsy are capable of inducing seizures (Wilkins et al., 1984). The patterns are quite unlike those that occur in nature, as explained below.
Images from the natural world are largely scale invariant (Field, 1987; Pentland, 1984). The relative contrast energy of the image remains approximately the same at all spatial scales. In consequence the images have a particular spatial structure that can be characterized in terms of the Fourier amplitude spectrum. The amplitude decreases with increasing spatial frequency approximately as 1/f, so that when plotted on log-‐log coordinates the slope is close to -‐1 (Field, 1987). Field (1994) argued that the bandwidths of channels tuned to spatial frequency are optimized for this type of amplitude spectrum. Their bandwidth remains constant when expressed on an octave scale, so that a similar amount of
information is then carried by each channel. Atick and Redlich (1992) have argued that the shape of the contrast sensitivity function enables images with a 1/f spectrum to be coded efficiently. The contrast sensitivity is low (the channel has low gain) for low spatial
frequencies that have a high amplitude, and this conserves metabolic energy. The sensitivity increases as the amplitude decreases to a point where the signal-‐to-‐noise ratio is low, and then falls at high spatial frequencies when the signal can no longer be discriminated from noise reliably. Psychophysical experiments on discrimination tasks show that performance is optimal when stimuli have a 1/f spectrum (Geisler, Perry, Super, and Gallogly, 2001; Knill, Field, and Kersten, 1990; Parraga, Troscianko, and Tolhurst, 2000). Baker and Graf (2009) found that under conditions of binocular rivalry the dominant eye was the one that received an image with amplitude spectrum closer to 1/f.
structure produce a sparse cortical response (Atick and Redlich, 1992; Olshausen and Field, 1997; Simoncelli and Olshausen, 2001). The defining characteristic of this sparse response is that the distribution of neuronal firing is kurtotic, with few neurons highly active and many quiescent, thereby reducing metabolic demand (Attwell and Laughlin, 2001). It is of obvious importance to minimise energy metabolism given that the brain uses more than 15% of the body’s energy, even though less than 1% of its neurons are active at any one time (Lennie, 2003). The metabolism involved in image processing can be explored using functional magnetic resonance imaging. The fMRI BOLD signal reflects neuronal activation via oxygen and glucose metabolism. The signal is large for patterns that are uncomfortable (e.g., gratings with mid-‐range spatial frequency, i.e., around 3 cycles per degree -‐ cpd) and is larger in individuals who are particularly susceptible to discomfort viz those with migraine (Huang, Cooper, Satana, Kaufman, and Cao, 2003). Metabolism is also reflected in the near infrared oxyhaemoglobin signal, and this is also larger for coloured patterns that are uncomfortable (Haigh et al., 2013).
visual processing provide access to simple computational measures of discomfort, as we will demonstrate.
All the above studies have investigated the regularity in the variation of energy across spatial frequencies, and they have done so by averaging across orientation. Yet there are regularities in the variation of energy with orientation that this approach cannot capture, for example the energy in the vertical and horizontal orientations is usually greater than in the obliques (Switkes et al. 1978; Torralba and Oliva 2003; Girshick et al. 2012). In log-‐log coordinates the two dimensional Fourier amplitude spectrum of a natural image is
approximated by a cone with slope of -‐1, with small departures from radial symmetry that express the slightly greater energy in the horizontal and vertical orientations. We wished to take into account this regularity to see whether we could obtain a better computational correlate of discomfort than in previous studies, our purpose being to offer a tool for use by designers. By considering the whole (two-‐dimensional) spectrum, we grasp both
irregularities across frequencies at each orientation and across orientations at each frequency. Our rationale for considering Fourier content in all orientations instead of averaged over orientation is that some uncomfortable patterns have specific features that cannot be grasped by a one-‐dimensional description. In a checkerboard, the energy is distributed widely with respect to orientation, whereas in stripes, which are generally more uncomfortable than checks (Wilkins et al., 1984), the energy has a single orientation. On the other hand, figures of radiating lines, such as the MacKay figure (MacKay, 1957), and
concentric rings (MacKay, 1957), Figure 2, are perceptually more unstable than linear gratings, suggesting that the two dimensional distribution of energy is critical.
Our purpose in this paper is not to emulate or model the neurological processes involved in discomfort but to obtain an economic computational metric that predicts discomfort for practical purposes. We appeal to the simple logic that the visual system is optimized for the processing of natural images, which have a characteristic structure that enables efficient coding as a result of evolution and adaptation. Images that do not possess this structure are therefore likely to be processed relatively inefficiently, which may have consequences for metabolism, with possible associated homeostatic mechanisms that give rise to visual discomfort. We show that a simple measure of the departure from 1/f in the two-‐
reduce the spatial frequency content to a single dimension by averaging over orientation (Fernandez and Wilkins (2008); Juricevic et al (2010)). We propose that such a simple measure may help architects and designers prevent those aspects of design that have in the past given rise to complaints. We offer five case histories as examples of the complaints and the images that have given rise to them, and show that our metric would readily have identified these images as problematic.
2. Method
2.1. Images
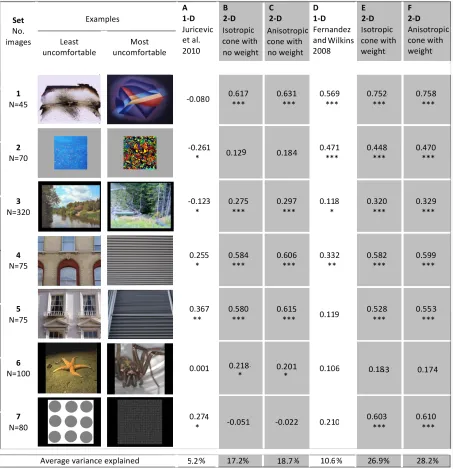
From a variety of studies, we obtained 7 sets of images, 765 images in total, our choice dictated simply by their availability. The discomfort each image evoked had been rated on a Likert scale (the higher the rating, the higher the discomfort evoked). Set 1 and Set 2
consisted respectively of 45 images of non-‐representation art from Study 1 by Fernandez and Wilkins (2008), and 70 images of non-‐representation art from their Study 2. Set 3 was obtained from the 160 rural and 160 urban images used by Pretty et al. (2005). Set 4 and Set 5 were two sets of 75 photographs of building frontages (all from the same camera) with ratings of discomfort from two independent groups of 10 young participants (Murphy, unpublished). Set 6 were the images used by Cole and Wilkins (2013 Experiment 3): 100 images of animals, 50 of them poisonous. Set 7 were 80 images of randomly arranged discs of variable size and contrast, with their associated ratings of discomfort, from an
undergraduate thesis by An Le. With the exception of the images from Fernandez and Wilkins (2008) and Pretty et al. (2005), the images were presented on the LCD screens (approximately 30 cm x 20 cm of laptop computers at a distance of about 60 cm. The images were rated individually by student volunteers; a minimum of 10 volunteers rated each image and their ratings were averaged.
2.2. Computational measure
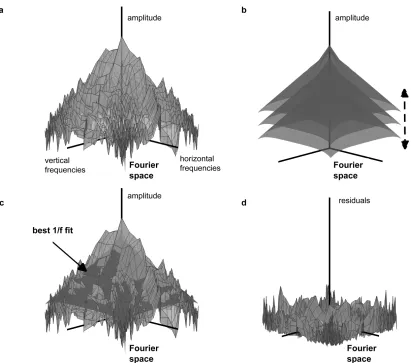
correction). We analysed the images using a method shown schematically in Figure 1. For each image, the two-‐dimensional Fourier amplitude spectrum was computed (Figure 1 (a)). In previous studies, a least square regression line has been obtained for the amplitude spectrum averaged over orientation, and a correction has been made for the greater number of points available at high spatial frequencies, typically by using bins of
exponentially increasing size to compensate for the over-‐representation of high frequencies. Here we used the two-‐dimensional Fourier transform and fitted a circular regular cone rather than a line. As will be described in Section 2.4, the amplitude spectrum could be weighted according to the contrast sensitivity function described by Mannos and Sakrison, (1974), whose formula reads
𝑠 𝑓 ≈ 2.6 0.0192+0.114 𝑓 𝑒! !.!!" ! !.!, (1)
The cone had slope of -‐1 on log-‐log coordinates and was centred on the DC component (average value of the image) of the two-‐dimensional spectrum. We used a Hanning window and therefore excluded spatial frequencies in the first four frequencies, including DC. The cone was either a circular regular cone with slope -‐1 or a cone-‐line surface that expressed the meridional anisotropy in natural images, as will be described in Section 2.3. The cone or cone-‐like surface was fit to the amplitude spectrum (Figure 1(b,c)), or to the weighted amplitude spectrum by keeping its shape unchanged and adjusting the gain in order to minimize the sum of the squares of the residuals using the function fminsearch in Matlab with default convergence criteria. For each image, having obtained the best fit, the sum of the squared residuals (Figure 1(d)) provided a measure of departure from scale invariance. (When the weighting was not applied, i.e. when the weights were uniformly 1.0 rather than
s(f), this was equivalent to subtracting the cone and the grand mean and computing the power.)
Figure 1. Schematics of the method. (a) Amplitude spectrum of a natural image in log-‐log coordinates. Each vertex on the surface has three coordinates, which, for the coordinates in the horizontal plane, correspond respectively to the logarithm of a horizontal frequency and a vertical frequency in the two-‐dimensional Fourier domain (frequencies with a DC
component have been discarded for display purposes). In the vertical plane the coordinate corresponds to the logarithm of the amplitude of the spectrum of the image at these frequencies. (b) Family of circular regular cones of slope 1/f with a (continuously) varying gain. (c) Amplitude spectrum pictured in (a) with its best fit amongst the (continuous) family of two-‐dimensional cones pictured in (b). (d) Residuals with respect to the best fit.
The sums of the squared residuals for the images were correlated with their ratings of discomfort on the Likert scale. Table 1, column B shows the correlations obtained.
[image:8.595.73.484.66.429.2]
[image:9.595.75.528.109.578.2]
The algorithm based on a circular regular cone was simple and yet it explained an average of 17.5% of the variance in people’s judgment of discomfort from images. Nevertheless, the approach has thus far ignored two parameters that are of possible significance. First, the images to which the visual system is adapted are anisotropic. They generally have less energy in oblique orientations than in the horizontal and vertical orientations (Schaaf and Hateren, 1996). Second, as mentioned above, the contribution of spatial frequencies to aversion is not uniform but greater for spatial frequencies to which the human visual system is most sensitive, namely around 3cpd +/-‐ one octave (Fernandez and Wilkins, 2008). We will consider each of these issues in turn.
2.3. Anisotropy
The association between the residuals and the discomfort may have arisen because the human visual system has adapted to its visual “diet”, and this “diet” typically contains images that are scale invariant or nearly so. However, the images are not only scale
The Spearman correlations between the residuals for the images and their discomfort ratings are shown in Table 1, column C. As can be seen, the correlations are very similar to those obtained with the simpler model based on an (isotropic) cone, although there is marginal improvement overall, the algorithm explaining on average 19% of the variance in people’s judgement of discomfort.
2.4. Spatial frequency weighting
As mentioned in the introduction, gratings are aversive at spatial frequencies in the range 0.5-‐20 cpd, and maximally so at ~3cpd, at the peak of the contrast sensitivity function. We therefore weighted the amplitude spectrum as a function of spatial frequency according to the contrast sensitivity function proposed in by Mannos and Sakrison (1974), whose formula was given in Equation 1. With this weighting function, when the (relative) contribution of a departure at 3cpd had a weight of 1.0, a departure at 1cpd, for example, had a weight of 0.46. This function is in good agreement with most of the contrast sensitivity functions in the literature and with the data from Wilkins et al (1984) and Fernandez and Wilkins (2008), Figure 4, who showed similar spatial frequency tuning functions for contrast sensitivity and for supra-‐threshold measures including (1) discomfort from gratings, (2) the correlation between discomfort and the one-‐dimensional Fourier amplitude and (3) the likelihood of epileptiform EEG activity in patients with photosensitive epilepsy. The function differs from that obtained by O’Hare and Hibbard (2011) which showed a slightly lower peak spatial frequency, but our choice of function was motivated by the similarity of contrast sensitivity with the (supra-‐threshold) functions for discomfort and photosensitive epilepsy.
The range of images used in the above analysis is large. Most are representational (sets 3 to 6), and so one might have expected the experience of discomfort to be influenced by the semantic content of the image. Any such influence was evidently insufficient to mask the relationship that emerged between simple mathematical properties of the image and the discomfort the image evoked.
Table 1 shows for comparison the correlations obtained for measures suggested by previous literature: the departure of the slope of the unidimensional amplitude spectrum, suggested by the work of Juricevic et al (2010), column A, and the ratio of the amplitude at mid-‐range spatial frequencies (around 3cpd) relative to that at frequencies two octaves below,
suggested by Fernandez and Wilkins (2008), column D. As can be seen, the correlations with these one-‐dimensional measures are generally lower than for the two-‐dimensional
measures advanced here. This supports the premise on which the present study was
conceived, namely that any measure should be able to capture differences in the discomfort from unidimensional patterns such as gratings and two-‐dimensional patterns such as
checks.
Ratings from judges have an intrinsic variability that limits the variance that any deterministic model can explain. In an attempt to estimate the contribution of such
variability, we randomly divided each group of judges into two equally sized sub-‐groups and calculated (1) the correlation of the mean ratings of each image from one sub-‐group with that from the other; (2) the correlation of the mean rating of each sub-‐group with the final model (Table 1, column F). We repeated the random division 1000 times for each available data set (Sets 1, 4, 5, and 7) and calculated the mean and SD of the Spearman coefficients. As can be seen from Table 2, across images, the correlation between the two groups was generally greater than the correlation of each group with the model, the only exception being when the group size was small. The difference between the correlations in Columns 3 and 4 of Table 2 was small, indicating that the model explained most of the available
variance. The correlations in Column 4 of Table 2 are similar to those in the last column of Table 1, although the latter are slightly higher, being based on the entire groups of raters.
Size of rating sub-‐ group
Mean correlation between mean ratings from each random half
Mean correlation between model and mean rank from random half
Study 1 21 0.705 (0.066) 0.684 (0.059) Study 4 5 0.448 (0.112) 0.507 (0.104) Study 5 5 0.662 (0.056) 0.498 (0.089) Study 7 17 0.810 (0.072) 0.589 (0.056)
Table 2. Spearman correlation of the mean ratings from one random sub-‐group with the mean ratings of the other (column 3) and (column 4) Spearman rank correlations of the final model (Table 1, column F) with the mean rank obtained from a random sub-‐group. Mean (SD) of 1000 random divisions of the group of raters.
3. Interim Discussion
The present studies make three contributions, all of which help explain the variance in judgements of discomfort from images. The novel and most important contribution arises from the use of two-‐dimensional Fourier spectra, which permits the investigation of the role of the distribution of energy across orientations. When energy is most concentrated in one orientation channel, that is to say not equally shared across orientations, the aversion is maximal and the two-‐dimensional spectra takes account of this. Allowing for the anisotropy in natural images had a slight contribution. Weighting the spectra to reflect the sensitivity of the visual system and discomfort susceptibility explained 10% additional variance, as
[image:13.595.76.357.76.239.2]Field, 1996; Simoncelli and Olshausen, 2001), can explain a high proportion of the variance in judgments of discomfort.
One of the purposes of this investigation has been to provide a tool that can be used by designers to prevent the discomfort experienced by individuals as a result of contemporary architectural design. Much of such design is now based upon computer graphics and it should be possible to use the representation that the software provides to ascertain before construction whether the design is likely to evoke discomfort. We offer five case histories in which our algorithm would have prevented an unfortunate and expensive outcome.
3.1. Case 1
A consultant at a large hospital who suffered migraine returned from vacation to find that her working environment had been decorated with large murals, commissioned by the hospital administration. She was unable to walk around the hospital without risking a headache. The hospital was obliged to cover the artwork. The story reached the national press and the artist lost a subsequent commission. A photograph of the one of the hospital walls gave residuals that corresponded to the 95th percentile in the corpus of images that contributed to the data summarized in Table 1.
3.2. Case 2
A building was commissioned for a major national bank. One of the office workers who suffered occasional headaches found the frequency of headaches increased to the point that she was unable to work in her new environment. Fortunately the bank was able to offer her alternative accommodation. Photographs of the interior of the bank building gave a percentile score averaging 94th.
3.3. Case 3
3.4. Case 4
The Daily Mirror carried a story concerning “the rug that will make you sick”. The image of the rug had a percentile score of 99th.
3.5. Case 5
Wilkins (1995) gives examples of patterns that have caused complaints, including the design for the cover of a scientific journal. This cover gave an average percentile score of 99th.
3.6. Additional observation
There would appear to be a public awareness of problems from patterns. The first 20 patterns from a Google search for “patterns that make you dizzy” gave an average percentile score of 93rd (SD 5.8%).
4. General Discussion
We have presented an algorithm that predicts discomfort from images. The algorithm is extremely simple and is parameter-‐free and yet, surprisingly, it explains more than a quarter of the variance in judgments of discomfort that are entirely subjective. The judgments did not obviously relate to stimulus parameters, as they do when participants rate the
colourfulness of a scene or its structural complexity – participants were simply asked to express any discomfort they felt. The model is based on two pervasive principles: (1) the spatial structure in scenes from nature and (2) sensitivity of the human visual system, as reflected in the contrast sensitivity function. The visual system has evolved to process
demand greater metabolic resources. There are preliminary indications that this might indeed be the case. Coloured gratings with a large (and unnatural, Webster, Mizokami, and Webster, 2007) colour difference result in a high-‐amplitude haemodynamic response and are uncomfortable to view. The discomfort is proportional to the colour difference, as is the amplitude of the haemodynamic response (Haigh et al., 2013). Furthermore individuals who are particularly susceptible to visual discomfort, those experiencing migraine with aura, demonstrate an abnormally large haemodynamic response to uncomfortable visual stimuli (Cucchiara et al, 2014), an abnormality that is normalised when the stimulus is made more comfortable (Huang et al., 2011). In general, one can think of pain as a homeostatic
mechanism that acts to restore equilibrium, and in this respect, discomfort from images is no different: it provides for homeostasis in so far as it reduces the metabolic demand to more typical levels.
Our algorithm is computationally economic in the sense that it takes a few milliseconds to process each image. It was successful in identifying designs that have caused complaints, and might therefore provide a tool to help designers. Designers have long known that images from nature are restful and restorative (e.g. Korpela, 2013) and recent studies have involved the measurement of cerebral haemodynamics in the study of such restoration (Pati et al., 2014). Our model potentially provides a means of quantifying this effect.
Acknowledgements
OP was supported partly by the Spanish Ministry of Science and Innovation through the research project Consolider Ingenio (CSD 2007-‐00018) and partly by the BBSRC grant J000272/1 to Professor Julie Harris and Dr Paul Lovell. We are grateful to Professor Harris for her support in allowing us to pursue this study. We thank An Le and Kelly Murphy for permission to use their images and data.
References
Atick, J. J., and Redlich, A. N. (1992). What does the retina know about natural scenes?
Neural Computation, 4, 196-‐210.
Attwell, D., and Laughlin, S. B. (2001). An energy budget for signaling in the grey matter of the brain. J Cereb Blood Flow Metab, 21(10), 1133-‐1145.
Baker, D.H. and Graf,E.W. (2009). Natural images dominate in binocular rivalry. Proceedings
of the National Academy of Sciences of the United States of America, 106(13), 5436-‐
5441.
Cucchiara, B., Datta, R., Aguirre, G.K., Idoko, K.E. and Detre, J. (2014). Measurement of visual sensitivity in migraine: validation of two scales and visual cortex activation.
Cephalalgia, DOI: 10.1177/0333102414547782.
Efron, B., Tibshirani, R. J. (1993). An introduction to the bootstrap. New York: Chapman & Hall.
Fernandez, D., and Wilkins, A. J. (2008). Uncomfortable images in art and nature. Perception,
37(7), 1098-‐1113.
Field, D. J. (1987). Relations between the statistics of natural images and the response properties of cortical cells. Opt. Soc. Am. A, 4(12), 2379-‐2394.
Geisler, W. S., Perry, J. S., Super, B. J., and Gallogly, D. P. (2001). Edge co-‐occurrence in natural images predicts contour grouping performance. Vision Research, 41(6), 711-‐ 724.
Girshick, A. R., Landy, M. S., Simoncelli, E. P. (2011). Cardinal rules: Visual orientation perception reflects knowledge of environmental statistics. Nature Neuroscience, 14(7), 926-‐932.
Haigh, S., Barningham, L., Berntsen, M., Coutts, L., Hobbs, E., Irabor, J., et al. (2013). Discomfort and the cortical haemodynamic response to coloured gratings. Vision
Research, 30(89), 47-‐53.
Huang, J., Cooper, T. G., Satana, D., Kaufman, D. I., and Cao, Y. (2003). Visual distortion provoked by a stimulus in migraine associated with hyperneuronal activity.
Headache, 43(6), 664-‐671.
Huang, J., Zong, X., Wilkins, A., Jenkins, B., Bozoki, A. and Cao, Y. (2011). fMRI evidence that precision ophthalmic tints reduce cortical hyperactivation in migraine. Cephalalgia , 31(8), 925-‐36.
Juricevic, I., Land, L., Wilkins, A. J., and Webster, M. (2010). Visual discomfort and natural image statistics. Perception, 39(7), 884-‐899.
Korpela, K.M. (2013) Perceived restorativeness of urban and natural scenes -‐ photographic illustrations. Journal of Architectural and Planning Research 30(1),23-‐39.
Knill, D. C., Field, D., and Kersten, D. (1990). Human discrimination of fractal images. Journal
of the Optical Society of America a-‐Optics Image Science and Vision, 7(6), 1113-‐1123.
Lennie, P. (2003). The cost of cortical computation. Current Biology, 13, 493-‐497. MacKay, D. M. (1957). Moving visual images produced by regular stationary patterns.
Nature, 180, 849-‐850.
Mannos, J. L., and Sakrison, D. J. (1974). Effects of a visual fidelity criterion on encoding of images. IEEE Transactions on Information Theory, 20(4), 525-‐536.
O'Hare, L., and Hibbard, P. B. (2011). Spatial frequency and visual discomfort. Vision
Olshausen, B., and Field, D. J. (1997). Sparse coding with an overcomplete basis set: a strategy employed by V1? Vision Research, 37, 3311-‐3325.
Olshausen, B. A., and Field, D. J. (1996). Emergence of simple-‐cell receptive field properties by learning a sparse code for natural images. Nature, 381(6583), 607-‐609.
Parraga, C.A., Baldrich, R., Vanrell, M. (2010). Accurate mapping of natural scenes radiance to cone activation space: a new image dataset. Proceedings of the Conference on
Colour in Graphics, Imaging, and Vision, CGIV, 50-‐57.
Parraga, C. A., Troscianko, T. and Tolhurst, D. J. (2000). The human visual system is optimised for processing the spatial information in natural visual images. Current
Biology, 10(1), 35-‐38.
Pati, D., O'Boyle, M., Amore, C., Hou, J., Valipoor, S. and Fang D. (2014). Neural correlates of nature stimuli: an fMRI study. Health Environments Research and Design Journal, 7(2), 9-‐26.
Pentland, A. P. (1984). Fractal-‐based description of natural scenes. IEEE Trans Pattern Anal
Mach Intell, 6(6), 661-‐674.
Schaaf, A. van de, and Hateren, J.H. van. (1996). Modelling the power spectra of natural images: statistics and information. Vision Research, 36(17), 2759-‐2770.
Simoncelli, E. P., and Olshausen, B. (2001). Natural image statistics and neural representation. Annual Review of Neuroscience, 24, 1193-‐1216.
Switkes, E., Mayer, M. J., Sloan, J. A. (1978). Spatial frequency analysis of the visual environment: Anisotropy and the carpentered environment hypothesis. Vision
Research, 18(10), 1393-‐1399.
Torralba, A. and Oliva, A. (2003). Statistics of natural image categories. Network:
Computation in Neural Systems, 14, 391–412.
Webster, M. A., Georgeson, M. A., and Webster, S. M. (2002). Neural adjustments to image blur. Nature Neuroscience, 5, 839-‐840.
Webster, M. A., Mizokami, Y., and Webster, S. M. (2007). Seasonal variations in the color statistics of natural images. Network-‐Computation in Neural Systems, 18(3), 213-‐233. Wilkins, A. J. (1995). Visual Stress. Oxford: Oxford University Press.
Wilkins, A. J., Nimmo-‐Smith, M. I., Tait, A., McManus, C., Della Sala, S., Tilley, A., et al. (1984). A neurological basis for visual discomfort. Brain, 107, 989-‐1017.