DOI 10.1007/s10035-013-0421-0 O R I G I NA L PA P E R
Simple shear in 3D DEM polyhedral particles and in a simplified
2D continuum model
Paul Langston · Jun Ai · Hai-Sui Yu
Received: 28 January 2013 / Published online: 10 May 2013
© The Author(s) 2013. This article is published with open access at Springerlink.com
Abstract We develop a discrete element model (DEM) simulation of mixed regular rounded polyhedra and spheres in simple shear with walls and periodic boundaries in 3-dimensions. The results show reasonably realistic behav-iour developing shear and dilation or compaction depend-ing on whether the initial state is dense or loose. Similarly non-coaxiality of principal stress direction and strain rate direction are shown. Polyhedra show more general realistic behaviour than spheres but take significantly longer to run. Particle forces include normal elastic, damping, and tangen-tial friction and rolling friction. No cohesion or interstitangen-tial fluid is modelled. A separate simplified dynamic implicit finite difference Eulerian continuum model is developed and its parameters are used to fit the DEM results. This uses mass and momentum balances, a non-linear constitutive model and Mohr–Coulomb failure criterion. It runs in 2D with periodic boundaries effectively making it pseudo-1D. The model can reproduce the general trend of the DEM results and is a good basis for further development and understanding the physics.
Keywords Simple shear·Non-coaxiality·Particle shape· Polyhedral·DEM·Continuum
1 Introduction
1.1 Background
Simple shear is one of the most common deformation patterns of particulate systems. For example, simple shear is generally
P. Langston (
B
)·J. Ai·H.-S. YuNottingham Centre for Geomechanics, The University of Nottingham, University Park, Nottingham NG7 2RD, UK
e-mail: [email protected]
appreciated as the typical deformation mode in localised fail-ure zones of granular materials and in shaking level grounds under seismic shear waves. In addition, it is also the dominant deformation mode in plane shear flow [1].
As one of the earliest methods for laboratory testing of soils, the simple shear test has significantly contributed to the initial work on the development of critical state soil mechancis at Cambridge e.g., [2]. A good review of simple shear testing of soils has been given by Airey et al. [3] where both advantages and limitations of the test are highlighted.
A key feature of simple shear loading is that the prin-cipal stress directions are not fixed but rotate during shear, resulting in a non-coaxiality between the principal stress and strain rate directions with the latter largely fixed during the simple shearing [4]. Due to anisotropy, the particle assembly may deform during principal stress rotation even when the shear stress level (or the mobilised friction angle) is kept con-stant. For example, it has been shown the rotation of principal stress direction has a significant effect on the permanent strain development [5]. In fact, principal stress rotations are gener-ally involved in loading conditions encountered in geotechni-cal engineering. Considerable evidence from laboratory soil tests, numerical simulations and micro-mechanical research of granular materials has shown that the principal axes of stress and strain rate are generally not coincident e.g., [5–10]. This “non-coaxiality” phenomenon has an important impli-cation on the constitutive modelling of granular materials [11,12].
As a complementary tool to the experimental appara-tus of simple shear, discrete element modelling (DEM) has been adopted to help investigate the simple shear behaviour of granular assembly. Most earlier DEM studies of simple shear mainly focused on steady state behaviour e.g., [1,13–
fully mobilised and the directions of principal stress and strain rate have already developed to be largely coincident. In contrast, the relatively small shear strain regime is of more importance in geomechanics where deformation and modu-lus are important factors for practical design. Previous DEM simulations investigating non-steady regime of simple shear are largely limited to strength and volumetric behaviour e.g., [16–19]. Only very few studies consider the non-coaxiality [20–22].
Most DEM studies either use spheres in 3D or circles in 2D. The advantage of this is that the code is simpler and faster than for non-spheres and many more particles can be simulated in a study. Such studies have produced realistic and useful results in many areas. However, many granular systems comprise non-spherical grains where the shape significantly affects the bulk response. Several tech-niques have been applied to model non-spheres includ-ing, sphere-union, sphere-intersection, hemi-sphere-ended-cylinders, super-quadrics and polyhedra. Mack et al. [23] reviews some of the methods and develops a 3D “rounded polyhedral” model which is validated against a small labo-ratory data of hopper flow with polyhedral dice and plastic spheres. This shows that the behaviour of the polyhedra with rounded edges is quite complex; for example in some cases they flow slightly faster than equivalent volume spheres yet can have a greater probability of forming a jammed system. Polyhedral particles introduce additional difficulties in DEM studies, namely when defining the contact plane and the contact frictional forces between particles. Mack et al. [23] models a multi-point contact to describe the region of contact and bases the analysis on the point of largest overlap. Pena et al. [24] sets an upper limit for the integration step based on the kinetic energy decay. It also shows that the usual way of defining the contact plane between two polygonal parti-cles is, in general, not unique which leads to discontinuities in the direction of the contact plane while particles move. A more accurate definition for the contact plane is based on the shape of the overlap area between touching particles, which evolves continuously in time. Another possibility would be to model the particles as overlapping spheres, however, this might affect the behavior.
Discrete element model has the intrinsic advantage that it can model the real system down to the individual particle level, and hence reproduce realistic assembly behaviour. It should be remembered, however, that a number of simpli-fications are applied at the particle level such as the use of “rolling friction” for spheres. A further level of detail can be added with the FEM_DEM approach, Latham et al. [25]. The main limitation of DEM is that only relatively small systems can be modelled. The complementary approach is continuum, for example a model of cohesionless granular flows described in Daniel et al. [26]—in which a constitu-tive model is developed based on the idea that friction and
solids fraction are exclusive functions of the inertial number, which represents the ratio of inertial to normal forces—the model was able to represent velocity and solid volume frac-tion profiles in experimental systems. Jiang et al. [27] uses kinematic variables such as ‘averaged micro-pure rotation rate’ to bridge discrete and granular mechanics in 2D. Con-tinuum models can simulate larger systems. They can also help our understanding of the physics in that the behaviour has to be more rigorously defined, whereas in a discrete sys-tem the behaviour arises out of the interaction of the ele-ments in a “numerical experiment”. Ideally one could say you want: field measurements, laboratory scale experiments, continuum models, DEM and even FEM_DEM models for an optimal engineering study. DEM results could help formu-late constitutive and failure equations for use in continuum models.
It is more generally noted that the study of non-spherical particles can have importance beyond granular matter as new nano and micrometer sized particles with ”hard” interactions have been synthesized recently [28].
1.2 Objectives and outline of paper
This study uses the 3D DEM polyhedral model developed in Mack et al. [23] to model a simple shear cell to investigate the micromechanical response in slow shear comparing a sample of spheres and a sample of mixed polyhedra and spheres (Sect.2). It then develops a separate 2D continuum dynamic model fitting some of its parameters to the DEM results (Sect.
3). The aim is to investigate the feasibility of DEM polyhedra for such an application and investigate how it might help in the development of a complementary continuum approach. Section4 describes the conclusions and recommendations for future work.
2 DEM 3D polyhedral shear model
2.1 Model summary
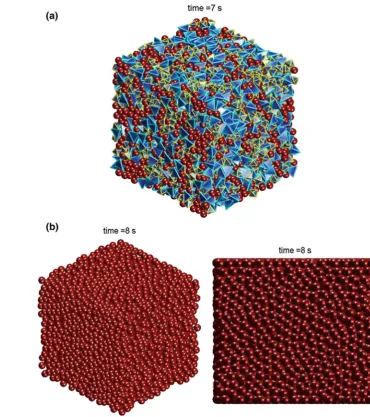
Fig. 1 a Snapshot of particles in shear cell for mix polyhedral and spheres sample (only particles near walls shown). b Snapshot of particles in shear cell for all spheres sample. Left general view direction (only particles near walls shown);
Right front view of all spheres.
More efficient packing for spheres results in slightly smaller cell than for mix polyhedra and spheres
a simple cohesion model but this was not tested experimen-tally. The current study does not consider particle cohesion.
2.2 DEM shearing scenarios
Four samples are modelled:
1. Mix polyhedra and spheres in initial dense state 2. All spheres in initial dense state
3. Mix polyhedra and spheres in initial loose state 4. All spheres in initial loose state
The mixed sample comprises equal numbers of tetrahe-dral, octahedral and spherical particles all with the same vol-ume and material. The polyhedra have rounded edges and vertices. The shear cell is approximately cubic, with fixed periodic boundaries in x (horizontal) the direction of shear. A constant vertical force is applied on the bottom movable
wall. The top wall has a fixed z position and shears right to left(−x); the bottom wall moves vertically in z and shears left to right; the front and back walls are fixed; the bottom movable wall mass is approximately 0.2 total particle mass; all particle–wall interactions have friction. Figure 1shows some example configurations of particles in the shearing cell.
z
[image:4.595.70.274.55.426.2]x
Fig. 2 View of particles from front of polyhedra mix (x horizontal,
z vertical) with periodic boundaries right and left, shearing walls top
and bottom, fixed walls front and back. Bottom figure shows part of cell during preparation stage before shearing as bottom wall is raised. All particles are given initial upward velocity equal to wall vertical velocity; no gravity (wire frame particle graphics)
Our study focuses on the quasi-static flow regime. The simple shear rate is controlled to limit the inertial number I to prohibit potential inertial effects. The inertial number is a dimensionless measure defined as the ratio between a micro timescale TP and a macro timescale Tγ˙ [1]. It is defined in our study as:
I = TP Tγ˙ =
d√ρ/P
1/γ˙ (1)
where d, ρ,P andγ˙ are mean particle diameter, assembly bulk density, mean stress and simple shear strain rate respec-tively. A flow system approaches quasi-static as I 1. In our simulations the shear rate is approximately constant and I is approximately 7.0×10⁻⁴, similar to some other studies e.g., [15], and so can be considered quasi-static.
Particle contact forces modelled are as described in Sect.
2.1above. The assembly stress and strain rate are periodically sampled in a spherical region around the centre of the cell.
The stress tensorσ¯i j across the whole cell is obtained by averaging the stress tensor of each particleσ¯i j(k)over the Np particles contained in the cell [29]
¯
σi j = 1 V
Np
¯
σ(k)
i j V(
k)
(2a)
where V and V(k) are the total volume of the cell and the volume of particle k respectively. The stress tensor of each particle was calculated from the contact forces fi(c) acting on the particle
¯
σ(k)
i j =
1 V(k)
Nc
xi(c)−xi(k)
f(jc) (2b)
where Nc is the number of contacts; xi(c) and x(
k)
[image:4.595.305.545.437.711.2]i are the locations of contact point and particle centroid, respectively. The strain rate tensor ε˙i j is obtained by evaluating the velocity gradient tensor of the deforming particle assembly [29]. This is achieved via a least-squares best-fit that mini-mizes the errorδbetween the predicted and measured relative velocities of all particles within the measurement domain:
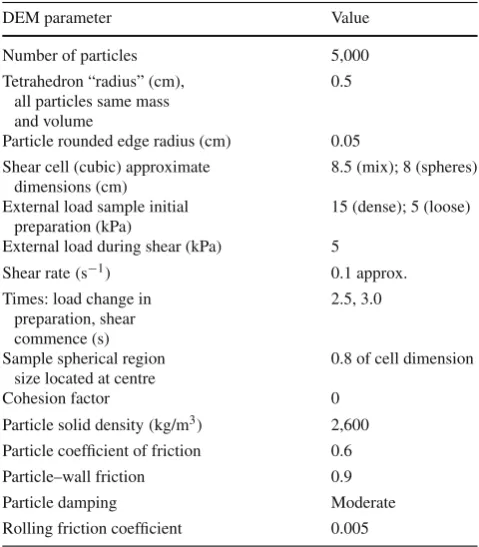
Table 1 Principal data in DEM simulation
DEM parameter Value
Number of particles 5,000
Tetrahedron “radius” (cm), all particles same mass and volume
0.5
Particle rounded edge radius (cm) 0.05 Shear cell (cubic) approximate
dimensions (cm)
8.5 (mix); 8 (spheres) External load sample initial
preparation (kPa)
15 (dense); 5 (loose) External load during shear (kPa) 5
Shear rate(s−1) 0.1 approx.
Times: load change in preparation, shear commence (s)
2.5, 3.0
Sample spherical region size located at centre
0.8 of cell dimension
Cohesion factor 0
Particle solid density(kg/m3) 2,600 Particle coefficient of friction 0.6
Particle–wall friction 0.9
Particle damping Moderate
Fig. 3 Example of
particle–particle contact force vectors in region of vessel during shear. Vectors drawn particle centre to centre, thickness proportional to magnitude. Top wall is moving right to left. Vector orientation in xz plane distribution is shown
0 0.01 0.02 0.03 0.04 0.05 0.06 0.07 0.08
-90 -45 0 45 90
P
roporti
on i
n
10
deg
ree bi
n
Angle to horizontal (deg)
δ=
Np
v˜(k)
i − ˜V(
k)
i
2 (3a)
∂δ ∂ε˙i j =
0 (3b)
wherev˜(ik)andV˜i(k)are respectively the predicted (product of strain rate tensor and relative position) and measured (DEM value) relative velocities of particle k against the mean par-ticle velocity of the monitored assembly.
It is noted that the all sphere sample, which has the same number and mass as the mixed sample, has a closer packing hence the shear cell for the spheres is slightly smaller. Peri-odic boundaries are used to avoid deformation of the cell in shear. This aspect is discussed later with the results. Experi-mental simple shear cells typically utilise rough top and bot-tom platens, but smooth and rigid side walls in order to allow the free dilation of the confined solid in vertical direction. Such different boundary wall conditions lead to
incompati-ble shear stress developed and hence non-uniform stress field in the solid. While using periodic boundaries, the side walls in the shearing direction are removed so that the incompat-ible boundary shear stress issue are avoided. It would also have been possible to set up a more idealised system using periodic boundaries for the front and back as well or used frictionless walls here. The system used here is more repre-sentative of a practical shear box. Note also that the external load is held constant, but the internal stress in z can vary dynamically as it would in a practical system.
The principal data used in the DEM simulations is shown in Table1.
Scenario for dense state:
1. Normal compression under high external load and zero particle friction, no shear
2. Normal compression continues under load used for shear and particle friction introduced, no shear
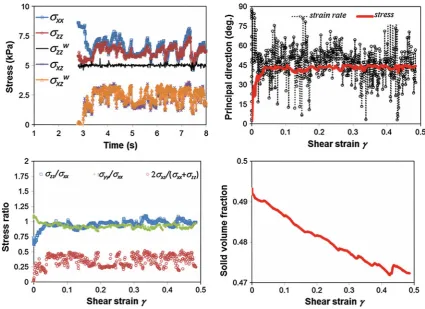
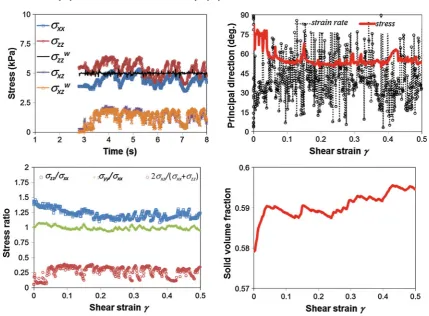
Fig. 4 DEM results: mix polyhedra with high external load in sample preparation: stress components, results are not shown before t=2.8 s while sample in preparation; major principal stress and strain rate orientations relative to x-axis; stress ratios; solid volume fraction
Scenario for loose state:
1. Normal compression under load used for shear and with particle friction, no shear
2. Shear commences
Wall friction is set high to help impart shearing.
2.3 DEM results
Figure3shows a view of the contact force vectors in a region of the shear cell for a mixed sample case. There is a clear indi-cation of the principal stress direction. The figure also shows the distribution of the contact vectors’ angles in the xz plane supporting this, but the main quantitative demonstration is in the principal major stress direction shown in the results following. The results of the DEM simulations for the four samples are shown in Figs.4,5,6and7.
Figure4shows the mixed dense state case. The sample is not quite at steady-state before shear commences, but close enough—see figure top left, there is about 1 kPa variation in the internal stress components for time 2.8–3 s, but the wall stresses are near constant. There are quite a lot of fluc-tuations in internal stress as would be expected on equiva-lent laboratory measurements and in major principal strain
rate direction. Fluctuations in wall normal stress are much lower. Ideally more particles should be modelled, but 5,000 seems to give overall reasonable results. Computer runtime is currently the main restriction on modelling more poly-hedra. The major principal strain rate direction fluctuation is due to localised rearrangement of particles as they move around each other. This has also been shown in our other work on 2D shear of spheres (not yet published), which also would explain stress fluctuation. There are good indications of dense packing in the shear stress response and solid vol-ume fraction evolution showing dilation. The internal nor-mal stresses are isotropic in the x−y horizontal plane (see stress ratio) which gives some indication that the periodic boundary is not significantly influencing the system. It has not achieved critical state in shear time simulated as shown by the solid volume fraction, but a significant proportion of the transient response is shown. Wall shear and internal shear stresses are in very close agreement, but it is noted that the internal normal stress in z is slightly higher than the wall stress. The horizontal stress is initially higher than verti-cal(K0 = (σx x/σzz)|t=3s >1), which is reasonable given
Fig. 5 DEM results: spheres with high external load in sample preparation
always lie in the x−z plane, so in terms of non-coaxiality, it is emphasised that we are concerned with the x − z plane components. The directions are relative to horizontal x direction.
Figure5shows the spheres dense state case. This case is fully settled before shear. The general response in shear is similar in trend to the mixed particle case above showing dense phase behaviour, but with significant differences. In terms of stresses the internal stresses are similar to the wall stresses. The shear stress (and shear stress ratio) is lower than with polyhedra showing less frictional behaviour as would be expected with spheres. The major principal stress direction approaches 45◦more quickly. The major principal strain rate direction fluctuates about 45◦as for the polyhedra—this is very dependent on instantaneous localised motion, even if the motion is less. As expected there is significantly closer pack-ing than with polyhedra (hence the smaller shear cell) and less dilation. Given that most granular systems do not com-prise only near spherical particles the polyhedra results— although somewhat idealised here and with some spheres— are more realistic, however, the simulation takes about 4–5 times longer which is significant. More work is needed to improve model efficiency.
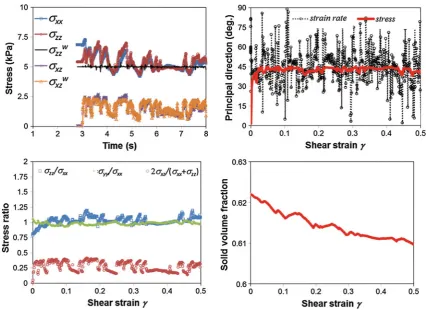
Figure 6 shows the mixed loose state case. There are indeed indications of loose behaviour with some compaction
on commencement of shear and generally rising mean shear stress. K0<1 here which is reasonable and the major
prin-cipal stress direction decreases from 90◦but changes more slowly than for the dense case. This is also consistent with the slower changing stresses and somewhat lower strain rate direction fluctuation. It is noticeable that the mean of the strain rate direction changes during shear and rises to 45◦ and that the mean of the major principal stress direction does not reach 45◦. The amount of compaction shown in the solid volume fraction is similar to the amount of dilation for the dense polyhedra.
Figure 7 shows the spheres loose state case. This also exhibits somewhat loose behaviour. Generally the differences between the all spheres case here and the previous mixed particle loose case are similar to the differences shown in the corresponding dense cases. It is noticeable here that the major principal stress direction reaches about 55◦.
3 Continuum 2D shear model
3.1 Model summary
Fig. 6 DEM results: mix polyhedra with low external load in sample preparation
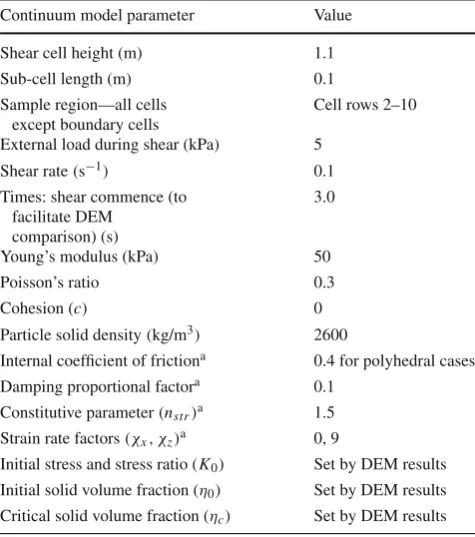
[image:8.595.82.512.380.696.2]Table 2 Principal data in 2D continuum simulation
Continuum model parameter Value
Shear cell height (m) 1.1
Sub-cell length (m) 0.1
Sample region—all cells except boundary cells
Cell rows 2–10 External load during shear (kPa) 5
Shear rate(s−1) 0.1
Times: shear commence (to facilitate DEM
comparison) (s)
3.0
Young’s modulus (kPa) 50
Poisson’s ratio 0.3
Cohesion (c) 0
Particle solid density(kg/m3) 2600
Internal coefficient of frictiona 0.4 for polyhedral cases
Damping proportional factora 0.1 Constitutive parameter(nstr)a 1.5
Strain rate factors(χx, χz)a 0, 9
Initial stress and stress ratio (K0) Set by DEM results
Initial solid volume fraction (η0) Set by DEM results
Critical solid volume fraction (ηc) Set by DEM results
aTrial and error was used to estimate general suitable values
The shear cell is divided into square sub-cells. It is an Eulerian fixed grid (x-horizontal, z-vertical) with staggered grids for stress and velocity. Left and right are periodic boundaries hence conditions are constant along x. (This phe-nomenon also helps to detect bugs in the code.) In effect this makes it pseudo 1-dimensional, although there are veloci-ties in x and z. The walls are not explicitly modelled but shear is imposed by setting a constant velocity x in the top (+ve) and bottom (−ve) rows at start of shear; the shear rate is specified by the user. All velocities are initialised to zero.
Mass and momentum balances are applied to granular flow in each sub-cell using an implicit solution of velocity at end of the time-step with relaxation of stress to get convergence. It is a single phase (solid no fluid) but with solid volume fraction ηapplied—stresses are bulk; gravity is zero. The momentum balance can be written:
∂(ηρu)
∂t + ∇(ηρuu)= −∇σs− ∇σd (4)
whereρ is solid density, u is velocity, subscripts s indicate static and d damping.
The initial conditions are set as follows: zero shear and velocity; specifyσx x, σzz(K0), hence estimateεx x, εzz. Then allow the system to settle to steady state before shear is imposed as described above. It would be possible to model
constant volume and mass during shear, but here constant external loading during shear is modelled by allowing mass to flow in/out of the top cells (ie constant volume but not constant mass in the system).
Strain rate is calculated from the velocities at mid-time step. The strain increment is then calculated:
ε=εrt (5)
A further component of strain increment is added as shown below and similarly for the zz component. This is some-what speculative and is necessary to model particulate like response.χrepresents two constants in x and z.
εx x =(η−ηc) χxεzx (6)
The stress increment is then calculated from the strain increment using Young’s modulus E and Poisson’s ratioν. A non-linear form of E is used, where ηis solid volume fraction,ηcis a critical value constant, nstr is a constant.
E∗=Eηnstr
r (7)
ηr =η/ηc (8)
The system response is sensitive to the failure criterion. In this initial model the Mohr–Coulomb criterion is used,σm is mean normal stress, rmc_maxis maximum radius of Mohr-circle, φ is constant friction angle, c is constant cohesion (c=0 in this study). If in a cell the stress state implies that the radius of Mohr’s circle is greater than the maximum, then it is reduced keeping the mean normal stress constant. (Another variant on this was tested keeping the minor principal stress constant, but that gave unrealistic results.)
rmc_ max=sin(φ)(σm+c/tan(φ)) (9)
A viscous (damping) shear stress is also applied directly pro-portional to shear rate as function of E andν. This is neces-sary to stop oscillations in velocity and stress.
3.2 Shear scenario
Table2shows the principal data used in the continuum model and Fig.8shows a snapshot of the shear cell configuration and graphical representation of solid volume fraction and velocity in each sub-cell. The data has been set as close as possible to the DEM cases. The length scale is somewhat different but that is not significant.
3.3 Continuum results
Fig. 8 Continuum model simple shear cell representation snapshot. Each circle represents square sub-cell within system. Periodic boundaries left and right making values in each
column the same i.e., the system
becomes pseudo 1-dimensional but with velocity in x and z.
Circle size is proportional toη
in sub-cell, velocity is proportional to line shown,
ux=0.05 ms−1at top
is sheared for slightly longer than DEM to display useful results, but started at t=3 s for compatibility—shear rate is matched in each case.
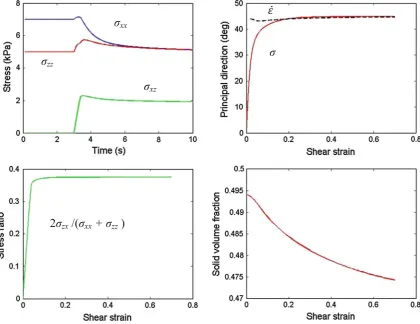
Figure9shows the continuum results matched to the DEM polyhedra dense case in Fig.4. As expected they are much
smoother here due to the intrinsic nature of the continuum model. Generally there is a reasonable fit with the stresses using the reduced friction coefficient, indicating particle fric-tion is not fully engaged in DEM; there is slightly slower dilation; major principal stress direction is similar but with a slower approach to the major principal strain rate direction. The vertical stress rises on commencement of shear then falls which is reasonable.
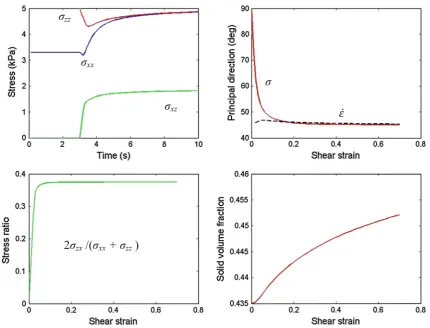
Figure 10 shows the continuum results matched to the DEM polyhedra loose case in Figure6. There is a generally reasonable fit again with the reduced internal friction coef-ficient. The normal stresses converge slightly faster in the continuum model unlike the dense case comparison. Shear is developed in continuum faster than in DEM. Compaction is a bit slower in continuum as with the dilation in the dense case. It is considered that the DEM probably does not develop shear until the compaction has occurred.
In summary the continuum results match the DEM reason-ably but the continuum is smoother, it needs a reduced fric-tion factor and there are some differences in response speed dependent on packing fraction. Hence the model needs some further development, for example, friction angle is probably a function of packing density.
Fig. 9 Continuum results: fit to polyhedra mix dense state withμ=0.4, η0=0.494, ηc=0.470,K0=1.4: stress components; major principal
[image:10.595.88.509.364.688.2]Fig. 10 Continuum results: fit to polyhedra mix loose state withμ=0.4η0=0.435, ηc=0.457,K0=0.66
4 Conclusions
A 3D rounded-polyhedral DEM—previously validated in experiments on non-cohesive hopper flow—is used here to monitor granular stress states in simple shear in a cubic cell with periodic boundaries with 5,000 particles. The results are generally reasonable but ideally more particles are required given the level of fluctuation. Dense and loose samples are simulated with appropriate responses in normal and shear stress, non-coaxiality and compaction or dilation.
A comparable sample of polydisperse spheres is also mod-eled. The polyhedra mix (including some spheres) develops higher shear stress and is more realistic of general granular systems, but takes longer to run. More work is required to develop efficiency in the simulation. It has been suggested that graphic processing units— enhanced models could help e.g., [30].
An initial continuum 2-dimensional shear cell model is developed using mass and momentum balances on Eulerian sub-cells. Data from the DEM model is used to set bound-ary conditions. Other model parameters are used to match the general behavior of DEM. Reasonable fits are possible
showing the continuum model has appropriate features. As expected the DEM results include fluctuations due to local-ized sliding and rotation of particles around each other and the limited number of particles, whereas the continuum results show smooth responses.
Developing the continuum model helps to understand the granular behavior because the overall physics must be explic-itly stated, whereas discrete models reproduce the overall response from individual particle physics in numerical sim-ulations. This study should also help develop more detailed continuum models for predictions on a larger scale not cur-rently feasible in DEM. It is envisaged that some of the model parameters used here, such as friction angle, are functions of packing density.
Acknowledgments We acknowledge the funding from Engineering and Physical Sciences Research Council (Grant EP/H011951/1) and reviewers’ suggestions for model development.
References
1. MiDi, G.D.R.: On dense granular flows. Eur. Phys. J. E 14(4), 341–365 (2004)
2. Roscoe, K.: The influence of strains in soil mechanics. Geotech-nique 20(2), 129–170 (1970)
3. Airey, D.W., Budhu, M., Muir-Wood, D.: Some aspects of the behaviour of soils in simple shear. Paper presented at the devel-opments in soil mechanics and foundation engineering, New York, USA
4. Yu, H.S.: Non-coaxial theories of plasticity for granular materials. Keynote paper presented at the the 12th international conference of international association for computer methods and advances in geomechanics (IACMAG), Goa, India, 1–6 October
5. Ishihara, K., Towhata, I.: Sand response to cyclic rotation of princi-pal stress directions as induced by wave loads. Soils Found. 23(4), 11–26 (1983)
6. Roscoe, K., Bassett, R., Cole, E.: Principal axes observed during simple shear of a sand. In: Proceedings of Geotechnical Confer-ence, Oslo, pp. 231–237 (1967)
7. Drescher, A., de Josselin de Jong, G.: Photoelastic verification of a mechanical model for the flow of a granular material. J. Mech. Phys. Solids 20(5), 337–351 (1972)
8. Oda, M., Konishi, J.: Rotation of principal stresses in granular material during simple shear. Soils Found. 14(4), 39–53 (1974) 9. Christoffersen, J., Mehrabadi, M., Nemat-Nasser, S.: A
microme-chanical description of granular material behavior. J. Appl. Mech. 48, 339 (1981)
10. Gutierrez, M., Ishihara, K., Towhata, I.: Flow theory for sand during rotation of principal stress direction. Soils Found. 31(4), 121–132 (1991)
11. Hill, R.: The Mathematical Theory of Plasticity. Oxford University Press, Oxford (1950)
12. Yu, H.S.: Plasticity and Geotechnics. Springer, Berlin (2006) 13. Shen, H.H., Sankaran, B.: Internal length and time scales in a simple
shear granular flow. Phys. Rev. E Stat. Nonlin. Soft Matter Phys. 70(5), 051308 (2004)
14. da Cruz, F., Emam, S., Prochnow, M., Roux, J.N., Chevoir, F.: Rheophysics of dense granular materials: discrete simulation of plane shear flows. Phys. Rev. E 72(2), 021309 (2005)
15. Sun, J., Sundaresan, S.: A constitutive model with microstructure evolution for flow of rate-independent granular materials. J. Fluid Mech. 682, 590–616 (2011). doi:10.1017/jfm.2011.251
16. Jiang, M., Yu, H.S.: Application of discrete element method to geomechanics. Mod. Trends. Geomech. 106, 241–269 (2006)
17. El Shamy, U., Gröger, T.: Micromechanical aspects of the shear strength of wet granular soils. Int. J. Numer. Anal. Methods Geomech. 32(14), 1763–1790 (2008)
18. Katagiri, J., Matsushima, T., Yamada, Y.: Simple shear simulation of 3D irregularly-shaped particles by image-based DEM. Granul. Matter 12(5), 491–497 (2010)
19. Wang, J., Yu, H., Langston, P., Fraige, F.: Particle shape effects in discrete element modelling of cohesive angular particles. Granul. Matter 13(1), 1–12 (2011)
20. Zhang, L.: The Behaviour of Granular Materials in Pure Shear, Direct shear and simple shear. Aston University, Birmingham, UK (2003)
21. Thornton, C., Zhang, L.: A numerical examination of shear banding and simple shear non-coaxial flow rules. Philos. Mag. 86(21–22), 3425–3452 (2006)
22. Wang, J.: Mechanical Behaviour of Granular Materials in Simple Shear Test Using DEM. University of Nottingham, Nottingham, UK (2009)
23. Mack, S., Langston, P., Webb, C., York, T.: Experimental validation of polyhedral discrete element model. Powder Technol. 214(3), 431–442 (2011). doi:10.1016/j.powtec.2011.08.043
24. Pena, A.A., Lind, P.G., Herrmann, H.J.: Modeling slow deforma-tion of polygonal particles using DEM. Particuology 6(6), 506–514 (2008). doi:10.1016/j.partic.2008.07.009
25. Latham, J.P., Munjiza, A., Garcia, X., Xiang, J., Guises, R.: Three-dimensional particle shape acquisition and use of shape library for DEM and FEM/DEM simulation. Miner. Eng. 21(11), 797–805 (2008)
26. Daniel, R.C., Poloski, A.P., Eduardo Sáez, A.: A continuum con-stitutive model for cohesionless granular flows. Chem. Eng. Sci. 62(5), 1343–1350 (2007). doi:10.1016/j.ces.2006.11.035 27. Jiang, M., Yu, H.-S., Harris, D.: Kinematic variables bridging
dis-crete and continuum granular mechanics. Mech. Res. Commun. 33(5), 651–666 (2006)
28. Damasceno, P.F., Engel, M., Glotzer, S.C.: Predictive self-assembly of polyhedra into complex structures. Science 337(6093), 453–457 (2012). doi:10.1126/science.1220869
29. Itasca: Manual of Particle Flow Code (PFC2D/3D). Itasca Consult-ing Group (2008)