Published 26th June 2013 in Criminal Justice Policy Review, Vol. 24 issue 4, pp.510-523 RUNNING HEAD: ESTIMATED COST OF HOMICIDE IN GLASGOW
Testing a method to develop preliminary cost estimates of homicide in Glasgow: A research note
Michael J. Harvey*, Damien J. Williams, and Peter D. Donnelly University of St Andrews
*Corresponding author:
Michael J. Harvey School of Medicine University of St Andrews
Medical and Biological Sciences Building North Haugh
St Andrews Fife, KY16 9TF SCOTLAND
Abstract
By European standards Scotland is a violent country with a disproportionate number of its homicides occurring in Glasgow. In addition to its devastating health and social impact, homicide imposes a considerable financial burden. The extent of the cost has been based on 2003 estimates for England and Wales. This study aimed to test a method for developing preliminary estimates of the cost of homicide in Glasgow from 2002–2009, based on four cost categories: lost output, incarceration cost, investigation cost and cost of physical and emotional impact. Findings suggested that the previous cost estimate of £1.46M
Introduction
Interpersonal violence has blighted Glasgow for over a century (Davies, 1998, 2007). The image portrayed by the media is that of a city built on a violent reputation, particularly the presence of violent young street gangs or “teams” who engage in recreational violence, often
involving sharp weapons. The impact is not only the large number of hospital admissions from lacerations, puncture wounds, and head trauma but also the significant number of homicides. Indeed, Glasgow, or more specifically the Strathclyde Police Force area,
accounted for 64% of Scottish homicides in 2010-2011 (Scottish Government, 2011). While this violence exacts a toll on the health and well-being of individuals, families, and society, it is also associated with a significant financial burden. An understanding of the financial impact of violence is important in economic analyses of prevention measures and ultimately in the decision making process around policy and practice regarding violence prevention. This study describes preliminary work testing a method to calculate cost estimates of homicide in Glasgow from 2002 to 2009.
The Extent of Violence in Scotland
While the burden of violence in Scotland is not as great as, for instance, the United States, it is becoming a persistent problem. This is highlighted by recent statistics from the United Nations Office on Drugs and Crime (UNODC) in which it was shown that Scotland has the highest police-recorded total assault rate in the world (1655.1 assaults per 100,000
rate (2.2 per 100,000) in Western Europe (with Finland and Portugal; UNODC, 2010). Furthermore, there was considerable difference between Scotland and its closest British neighbors: England and Wales (1.2 per 100,000) and Northern Ireland (1.4 per 100,000).
Epidemiological studies by Leyland (Leyland, 2006; Leyland & Dundas, 2010) provide greater insight into the homicide rate in Scotland. For instance, there was an 83% increase in the homicide rate between 1981 and 2003 (Leyland, 2006). Furthermore, Leyland and
Dundas determined the most at-risk group were men aged 15 to 44 in routine occupations (12 times higher than in professional/managerial occupations) and living in the most deprived quintile of areas (31.9 times higher than those living in the least deprived quintile). Indeed, Leyland and Dundas report that such inequalities in the social patterning of homicides not only exceed those in other countries but are also greater than for other causes of death in Scotland. Moreover, it was found that homicide rates were significantly higher in Glasgow (14.0 per 100,000) when compared to Scotland as a whole (Leyland, 2006), which is consistent with Glasgow’s violent history (see Davies, 1998, 2007; Patrick, 1973) and the label it acquired in 2004 as “The Murder Capital of Western Europe” (see Martin, 2004).
Measuring the Financial Burden of Homicide
Since 2000, two major studies on the overall cost of crime have been undertaken in England and Wales (Brand & Price, 2000; Dubourg, Hamed, & Thorns, 2005). In examining the work of Brand and Price four large cost categories emerged, including the following:
2. Incarceration costs: The total cost of housing an offender in the prison system 3. Investigation costs: All costs associated with the criminal investigation relating to a
homicide
4. Costs of physical and emotional impact: These intangible costs attempt to quantify victim pain, grief, suffering, and lost quality of life.
Specifically, it was found that in 2003 a homicide cost £1.46 million while a wound ranged from £8,000 to £21,000 (see Dubourg et al., 2005).
A similar approach has been utilized in Australia (see Mayhew, 2003); however, Scotland has not undertaken such an exercise and has relied on the figures generated for England and Wales, which may not truly reflect costs in Scotland (Detective Chief Superintendent John Carnochan, head of the Scottish Violence Reduction Unit, personal communication). Until now, the only economic studies on the cost of violence in Scotland have been undertaken by the National Health Service (NHS), which largely deals with injuries rather than homicides. For instance, the Chief Medical Officer for Scotland reported that violence was estimated to cost between 3% and 6% of the NHS budget—about £400 million (see Moss, 2008).
Relevance of Costing Estimates to Violence Prevention Policy and Practice
Economic analysis makes a significant input in the decision-making process regarding public policy and practice in the area of violence prevention (Waters et al., 2004). More specifically, such information aids the allocation of resource by allowing the selection between competing uses (Swaray, Bowles, & Pradiptyo, 2005) that may be similar in their outcomes (i.e.,
homicide or injury) to estimate the financial savings associated with the reduction in violence brought about through violence prevention measures. Thus, the current study tests a method to estimate preliminary annual costs of homicide in Glasgow between 2002 and 2009, focusing on costs outside NHS estimates (i.e., criminal justice, etc.). Glasgow has been chosen as the test site for this approach, due to the disproportionate number of Scottish homicides that occur in the city.
Method
All anonymized homicide data, including dates, location, and age of both the victim and offender, were supplied by the Violence Reduction Unit (VRU) in conjunction with Strathclyde Police. Similar to the approach devised by Brand and Price (2000; see also Dubourg et al., 2005; Mayhew, 2003) four main categories were examined and will be described in turn.
Lost Output Due to Homicide (Human Capital)
To calculate lost output, data on average age of death, pension age, and average annual salary were used. Lost output was only calculated for victims, not offenders. The human capital assumption of “full employment” was used for the lost output calculation. “Full employment”
Salary data on mean, annual, full-time income for Glasgow City was used from the Annual Survey of Hours and Earnings (taken from the ONS). Annual salaries were available yearly from 2002 to 2009. The annual discount period was calculated by subtracting the annual average age of death from the pension age. The present value of future income lost was calculated using a real discount rate of 3.5% (taken from HM Treasury). If the discount period was greater than 30 years, a discount rate of 3.0% was used for years 31+ (taken from HM Treasury). To calculate the annual total income lost, individual lost future income was multiplied by the number of deaths for the given year.
Incarceration Costs
Incarceration costs were calculated using data on annual incarcerations, inmate cost, and incarceration sentence length. The average incarceration time of 6 years was constructed from 2008-2009 prison system data provided by the Justice Analytical Services division of the Scottish Government. Data were also provided for annual incarceration costs from 2002 to 2009. Due to the average sentence length for homicide, future costs for incarceration had to be calculated for homicides that occurred after 2004 (i.e., the incarceration extended beyond 2009). The future cost of incarceration was projected as £30,431, which was an average of 2002 to 2009 costs. The average was used because of limited fluctuation in the cost between 2002 and 2009. Incarceration costs were calculated by 6 years of costs using available costs and projected costs (beyond 2009) where necessary.
Investigation Costs
most recent data on criminal investigation costs. Specific cost data were available for the period 2007 to 2009. Due to a large fluctuation in the data over those 3 years, the average investigation cost of £61,870 was calculated based on the 2007-2009 costs and used to estimate investigation costs for 2002-2006 as no data were available for these years.
The total cost of a criminal investigation was the sum of the following individual costs (not available separately): police officer salary, overtime, police force support salary, overtime, support services departmental expenses, identification parades, forensics, internal/external lab fees (including DNA processing), scene examination, casualty surgeon, vehicle/equipment hire, communications, interpreters, and other allowances.
Costs of Physical and Emotional Damages
The estimates of physical and emotional impact on victims, also displayed as intangible costs, were taken from Dubourg et al. (2005). According to the authors, these estimates were an improvement on the Brand and Price (2000) estimates due to the new methodology used. Whereas Brand and Price used willingness-to-pay (WTP) of society to avoid traffic fatalities to estimate the WTP value of avoiding homicides, Dubourg et al. calculated costs by
determining the number of Quality Adjust Life Years (QALYs) that would be lost as a result of a homicide. The number of QALYs lost was then combined with a value of
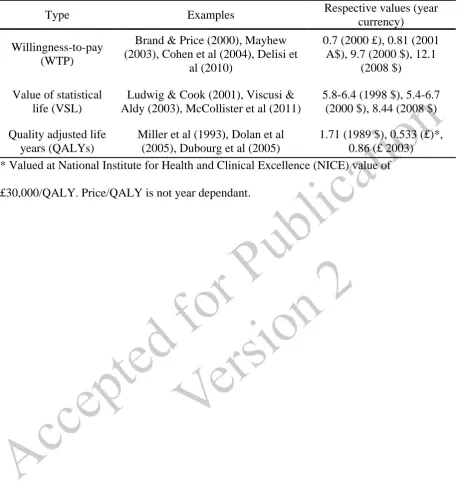
There have been many different methods used for calculating the intangible costs associated with violence (see Table 1). WTP is a type of revealed preference study that asks individuals how much money he or she would be willing to part with to avoid a particular incident (i.e., a homicide or road accident). Value of Statistical Life (VSL) studies impute a cost of life from other areas, such as the job market. This can be done, for example, by comparing wage compensation to job risk (as jobs that are higher risk typically pay more) to determine what the personal value of a life is. As demonstrated in Table 1 WTP methods surrounding crime can provide a great range of intangible costs. And while VSL has a tighter range
(comparatively), there is still debate on which is the most appropriate VSL model to use to determine intangible costs associated with crime (see Dolan, Loomers, Peasgood, & Tsuchiya, 2005). The QALYs approach from Dubourg et al. (2005) was taken for two reasons. First, it provides the most conservative estimate for intangible costs (see Table 1). Second, the approach used by Dubourg et al. was the most recent estimate of the intangible cost associated with homicide for Britain.
[Table 1 about here]
Results Lost Output Due to Homicide (Human Capital)
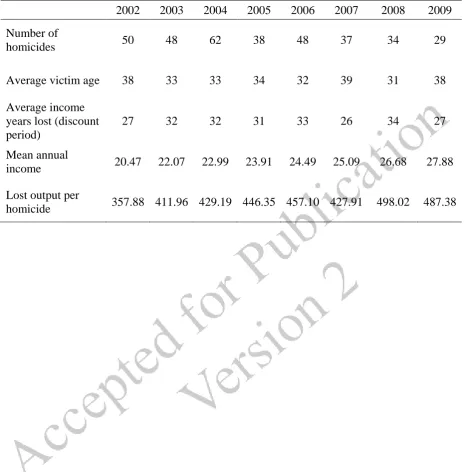
The itemization of the lost output calculations is presented in Table 2.
[Table 2 about here]
displays a positive skew in the age distribution of the victims with a modal age band at 25-29. Within the raw data (not presented) the annual skew patterns were similar to the combined age distribution (Figure 1) with two irregularities in 2005 and 2008: a negative skew with the modal age band at 40-44 years in 2005, and an approximately normal distribution with the modal age band at 35-39 years in 2008. The annual mean and median of missing-age data was 35%, with the range of 41% (2009) to 27% (2008).
[Figure 1 about here]
The change in victim age corresponds to the decrease in the cost of lost output per homicide from 2006 to 2007 and 2008 to 2009. Lower total lost outputs corresponded with years where victims were, on average, older. For example, average income increased £600 (2.3%) from 2006 to 2007 and average victim age increased 7 years, which were associated with a 7% total reduction in lost output. Lost output per homicide had an overall increasing trend.
Incarceration and Investigation Costs
The annual costs of incarceration and per homicide investigation costs are presented in Table 3. The mean incarceration time served for homicide (including nonlife sentences) was 2,192 days (6.005 years). The average incarceration cost ranged from £179, 980 (2002) to £185, 750 (2006). Incarceration costs did fluctuate over time. The smallest change was 0.3% (2004 to 2005) and the largest was 4.4% (2007 to 2008). Investigation costs for the years that data were available show an inconsistent decreasing trend of 1.9% between 2007 and 2008 and 47.1% from 2008 to 2009.
Costs of Physical and Emotional Damages
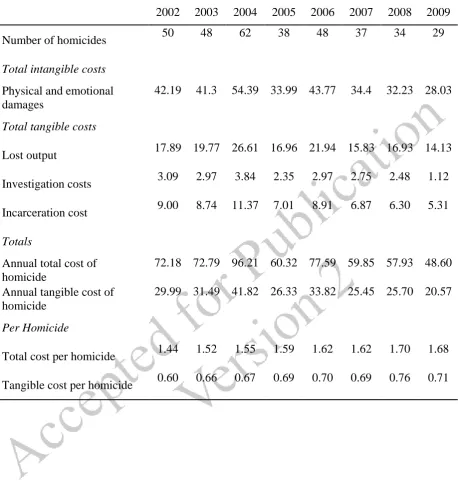
The cost of physical and emotional damages ranged from £843,000 (2002) to £966,650 (2009). As costs of physical and emotional damages were directly modified from Dubourg et al. (2005) no individual table was created; however, the total annual cost for physical and emotional damages are shown under intangible costs in Table 4.
Total Costs
The overall cost summary is presented in Table 4. The cost per homicide had a range of £1.45 million (2002) to £1.70 million (2008). The peak year for violent homicides in Glasgow was 2004 with 62, and a total cost of approximately £96 million. In 2009 there were fewest homicides (29) and also the lowest total cost of £46 million. On average, tangible costs accounted for 43% of the total per homicide cost. Within tangible costs, lost output accounted for an average of 64% and incarceration accounted
for an average of 27%. Tangible costs presented in Dubourg (2003) were £0.598 million per homicide, while the same year tangible costs per homicide in Glasgow were
£0.656 million. The largest difference between the two estimates was the criminal
justice system cost from Dubourg (£0.144 million/homicide) and the combined investigation and incarceration cost for Glasgow (£0.244 million/homicide).
[Table 4 about here]
Discussion
The aim of the current study was to test a method based on the approach of Brand and
£1.46 million; Dubourg et al., 2005). While this was useful, it did not properly estimate the cost for the corresponding year (2003, estimated here at £1.52 million) and presents an underestimation of the current cost (2009, estimated here at £1.68 million).
The results indicate that homicide numbers have been generally declining from the high of 62 in 2004, culminating in a low of 29 in 2009. Although beyond the scope of this article, this reduction does coincide with the formation of the Scottish Violence Reduction Unit, which adopts a Public Health approach to violence prevention in Scotland (see VRU, 2006). In 2004, the cost per homicide was approximately £1.55 million and the total cost for violent homicides (62) was almost £96 million. In contrast, in 2009 only 29 violent homicides were recorded, and the cost per homicide was greater by almost £130,000 (£1.68 million) with the total cost being £48 million.
Relevance to Policy and Practice
The Scottish Government has identified violence as a key policy issue and is committed to supporting violence prevention initiatives to combat Scotland’s violent reputation. Thus,
Scotland-specific cost estimates of homicide are necessary for economic analyses of violence prevention efforts, which can inform the decision-making process regarding public policy and practice (Waters et al., 2004) and allocation of resource (Swaray et al., 2005).
More broadly, however, the study adds to the evidence base regarding the economic analysis of violence. Along with Dubourg et al. (2005) and Mayhew (2003), the current study
economic analyses, such as the availability of reliable investigation costs for which it was necessary to estimate 2002-2006 annual costs based on 2007-2009 data.
Limitations of the Study
Although the current study has provided preliminary estimates for the cost of homicide in Glasgow, which may be more representative for Scotland, there are some differences between our methods and those applied to create estimates for England and Wales (Brand & Price, 2000; Dubourg et al., 2005). First, those studies used a more thorough costing scheme. For example, within the category of criminal justice system (CJS) costs, they included the individual costs of police activity, prosecution, magistrates’ court, crown court, jury service,
legal aid, nonlegal aid defense, probation services, prison services, and other CJS costs and overheads. In contrast, our study employed only large encompassing categories (e.g.,
investigation costs) without a monetary breakdown for each category as a result of the way in which the necessary data was provided. Also, we did not include small value costs for
homicides (e.g., health care expenditures, estimated at £708 per homicide by Dubourg et al., 2005). These figures were not included as health service involvement in cases of homicide is very sporadic (Detective Chief Superintendent John Carnochan, Director of VRU, personal communication) and the inclusion of the small monetary cost would not have a profound impact on the overall cost. Consequently, the current figures represent a lowest reasonable preliminary estimate of the cost of homicide in Glasgow.
between England and Wales (1.2 per 100,000 in 2008; UNODC, 2010) and Glasgow (14.0 per 100,000 in 2003; Leyland, 2006) and the differences in average life expectancy (male in the East End of Glasgow: 54 years; male in Scotland: 75.2 years, male in England: 77.9 years, male in Wales: 81.3 years; taken from ONS). The estimate of intangible costs for England and Wales were likely not appropriate estimates for Glasgow.
In calculating incarceration costs, we were limited in our ability to use other data to
extrapolate the costs of the sentences for those imprisoned after 2004 (therefore released after 2010 based on sentencing averages). Due to the relatively small fluctuation in incarceration costs, especially comparative to investigation costs, it was decided that it was most
appropriate to use an average for projected costs (i.e., costs of incarceration post-2009). Nonetheless, future work on projecting future incarceration costs will need to be undertaken.
In addition, it will be necessary to determine specific investigation costs from 2002 to 2006 rather than base them on the 2008 and 2009 figures, which changed from £72,810 to £31,100, possibly resulting from the Force Efficiency Drive due to budget cuts. This reduction affected aspects such as the amount of overtime that could be worked and reduced the use of
specialists for investigations unless necessary (VRU, personal communication). Given the 47% drop in costs from 2008 to 2009, it is possible that the average cost of £61,870 imputed for 2002 to 2006 is an underestimate, and the actual cost may be closer to the 2007 and 2008 costs.
statistical tests for significance could not be performed. Future work will need to examine fluctuations in the data, whether it is through statistical analysis or sensitivity analysis.
Finally, previous estimates (Brand & Price, 2000; Dubourg et al., 2005; Mayhew, 2003) have been based on the costs for a country rather than a single city as in the current study. Glasgow was considered an appropriate location to test the method and undertake preliminary analysis because it accounts for a disproportionate number of homicides in Scotland. While this focus on Glasgow may limit the generalizability of the findings to the whole of Scotland, it should represent a more reliable indicator of the cost of homicide than the figures for England and Wales and also highlights the necessity for Scotland-specific estimates.
Future Work
Continuing work on this project will address a number of the methodological issues raised during the creation of the preliminary estimates.
1. A new lost output calculation to account for natural death (i.e. not homicide related) in the population. This will aid the “full employment” until pension age assumption.
2. A better prediction of future incarceration costs for prison sentences that conclude beyond the study period.
3. Similar to Brand and Price (2000) and Dubourg et al. (2005) a thorough costing scheme will be utilized. This will allow for more accurate cost estimates as well as better comparisons to those estimates for England and Wales.
5. Scotland-specific estimates will be created for the costs of physical and emotional impact instead of continuing to use estimates for England and Wales.
6. Undertake sensitivity analysis to account for uncertainty in costs
7. The approach will be extended across Scotland and will account for more forms of violence (not just homicide).
Conclusion
In conclusion, homicide in Glasgow and Scotland as a whole represents a considerable health, social, and financial burden on individuals, families, and society. The implementation of attempts to prevent violence, while taking the toll on health and well-being as its focus, are often determined by cost. Until now, the cost of homicide in Scotland has often utilized outdated figures for England and Wales. The current study outlines a method to calculate the preliminary cost estimates of homicide in Glasgow from 2002 to 2009. It is evident that the England and Wales figures are underestimations of the current conservative cost estimates for homicide in Glasgow. Accurate financial estimates for the burden of homicide provide
important information for policy and practice with regards to decisions concerning
References
Brand, S., & Price, R. (2000). The economic and social costs of crime (Home Office Research Study 217). Retrieved from
http://webarchive.nationalarchives.gov.uk/20110218135832/rds.homeoffice.gov.uk/rds/pd fs/hors217.pdf
Cohen, M. A., Rust, R. T., Steen, S., & Tidd, S. T. (2004). Willingness-to-pay for crime control programs. Criminology, 42(1), 89-109.
Davies, A. (1998). Street gangs, crime and policing in Glasgow during the 1930s: The case of the beehive boys. Social History, 23(3), 251-267.
Davies, A. (2007). Glasgow’s “Reign of Terror”: Street gangs, racketeering and intimidation
in the 1920s and 1930s. Contemporary British History, 21(4), 405-427.
DeLisi, M., Kosloski, A., Sween, M., Hachmeister, E., Moore, M., & Drury, A. (2010). Murder by numbers: Monetary costs imposed by a sample of homicide offenders. Journal of Forensic Psychiatry & Psychology, 21(4), 501-513.
Dolan, P., Loomers, G., Peasgood, T., & Tsuchiya, A. (2005). The value of a statistical life: A critical review of market estimates throughout the world. British Journal of
Criminology, 45, 958-976.
Dubourg, R., Hamed, J., & Thorns, J. (2005). Estimating the cost of the impacts of violent crime on victims (Home Office Online Report 30/05, pp. 31-44). Retrieved from http:// webarchive.nationalarchives.gov.uk/20100413151441/http://www.homeoffice.gov.uk/rds/ pdfs05/rdsolr3005.pdf
Leyland, A. H. (2006). Homicides involving knives and other sharp objects in Scotland, 1981-2003. Journal of Public Health, 28(2), 145-147.
Leyland, A. H., & Dundas, R. (2010). The social patterning of deaths due to assault in Scotland, 1980-2005: Population-based study. Journal of Epidemiology of Community Health, 64(5), 432-439.
Ludwig, J., & Cook, P. J. (2001). The benefits of reducing gun violence: Evidence from contingent valuation survey data. Journal of Risk and Uncertainty, 22(3), 207-226. Martin, L. (2004, April 11). Murder capital paints itself the wrong shade of black. Guardian.
Retrieved from http://www.guardian.co.uk/uk/2004/apr/11/ukcrime.lornamartin Mayhew, P. (2003). Counting the costs of crime in Australia (Australian Institute of
Criminology Paper No. 247). Retrieved from
http://www.aic.gov.au/documents/A/A/3/%7BAA329573-5D62-46FB-9E6F-4D86A6DDD9BC%7Dti247.pdf
McCollister, K. E., French, M. T., & Fang, H. (2011). The cost of crime to society: New crime specific estimates for policy and program evaluation. Drug and Alcohol
Dependence, 108(1-2), 98-109.
McIntosh, E., Clarke, P. M., Frew, E. J., & Louviere, J. J. (2010). Applied methods of costbenefit analysis in health care. New York, NY: Oxford University Press.
Miller, T. R., Cohen, M. A., & Rossman, S. B. (1993). Victim costs of violent crime and resulting injuries. Health Affairs, 12(4), 186-197.
Moss (2008, April 17). GBP 400m: Cost to NHS of our violent society. Scotsman. Retrieved from
Office for National Statistics. (2012). Average age of retirement rises as people work longer
(News Release). London: Author.
Patrick, J. (1973). A Glasgow gang observed. London: Methuen.
Scottish Government (2011). Homicide in Scotland, 2010-11. Retrieved from
http://www.scotland.gov.uk/Resource/Doc/365275/0124207.pdf on April 21, 2012. Swaray, R. B., Bowles, R., & Pradiptyo, R. (2005). The application of economic analysis to
criminal justice interventions: A review of the literature. Criminal Justice Policy Review, 16(2), 141-163.
United Nations Office on Drugs and Crime. (2010). UNODC homicide statistics. Retrieved from http://www.unodc.org/unodc/en/data-and-analysis/homicide.html
Violence Reduction Unit. (2006). Reducing violence: An alliance for a safer future. Retrieved from
http://www.actiononviolence.com/sites/default/files/documents/Reducing%20Violence.pd f
Viscusi, W. K., & Aldy, J. E. (2003). The value of a statistical life: A critical review of market estimates throughout the world. Journal of Risk and Uncertainty, 27(1), 5-76. Waters, H., Hyder, A., Rajkotia, Y., Basu, S., Rehwinkel, J. A., & Butchart, A. (2004). The
Author note
Michael J. Harvey completed the study while undertaking a field placement at the University of St Andrews as a requirement for a Masters of Public Health in the School of Public Health at the University of Minnesota.
We would like to thank Detective Chief Superintendent John Carnochan and his staff at the Violence Reduction Unit for providing the anonymised homicide data and investigation costs (along with Strathclyde Police). We also thank members of the Justice Analytical Services division of the Scottish Government for providing incarceration costs.
Author Biographies
Michael J. Harvey, MPH, is a current Master of Research graduate student in the School of medicine at the University of St Andrews investigating the effectiveness of a new health promotion initiative in Scotland. His research interests include decision analysis for health care, policy level comparative effectiveness analysis, and economic evaluation methods. In September 2012, he will begin a PhD in Health Services, Organization and Policy at the University of Michigan.
Damien J. Williams, PhD, is a Research Fellow in Public Health Sciences in the School of Medicine at the University of St Andrews. His research interests include violence and violence prevention. He was the co-recipient of the inaugural 2011 Elizabeth Russell Award from the Faculty of Public Health for his work on gang violence prevention.
health systems. He is a member of the World Health Organization Violence Prevention Alliance steering group, chairs the research advisory group of the Scottish Violence
Figure 1. Distribution of age for victims of homicide in Strathclyde 2002-2009
0 5 10 15 20 25 30 35 40 45
0 5 10 15 20 25 30 35 40 45 50 55 60 65 70 75 80 85 90 95
100
Freque
ncy
Table 1
Methods of estimating intangible costs associated with violence (presented in £million)
Type Examples Respective values (year
currency) Willingness-to-pay
(WTP)
Brand & Price (2000), Mayhew (2003), Cohen et al (2004), Delisi et
al (2010)
0.7 (2000 £), 0.81 (2001 A$), 9.7 (2000 $), 12.1
(2008 $) Value of statistical
life (VSL)
Ludwig & Cook (2001), Viscusi & Aldy (2003), McCollister et al (2011)
5.8-6.4 (1998 $), 5.4-6.7 (2000 $), 8.44 (2008 $) Quality adjusted life
years (QALYs)
Miller et al (1993), Dolan et al (2005), Dubourg et al (2005)
Table 2
Lost output (human capital) 2002-2009 (monetary values presented in £thousand)
2002 2003 2004 2005 2006 2007 2008 2009
Number of
homicides 50 48 62 38 48 37 34 29
Average victim age 38 33 33 34 32 39 31 38
Average income years lost (discount period)
27 32 32 31 33 26 34 27
Mean annual
income 20.47 22.07 22.99 23.91 24.49 25.09 26.68 27.88 Lost output per
Table 3
Incarceration and investigation costs 2002-2009 (monetary values presented in £thousand)
2002 2003 2004 2005 2006 2007 2008 2009
Number of
homicides 50 48 62 38 48 37 34 29
Incarceration
costs 30.17 29.84 29.27 29.37 30.34 30.99 32.36 31.1 Investigation
Table 4
Total costs 2002-2009 (costs presented in £million)
2002 2003 2004 2005 2006 2007 2008 2009
Number of homicides 50 48 62 38 48 37 34 29
Total intangible costs
Physical and emotional damages
42.19 41.3 54.39 33.99 43.77 34.4 32.23 28.03
Total tangible costs
Lost output 17.89 19.77 26.61 16.96 21.94 15.83 16.93 14.13
Investigation costs 3.09 2.97 3.84 2.35 2.97 2.75 2.48 1.12
Incarceration cost 9.00 8.74 11.37 7.01 8.91 6.87 6.30 5.31
Totals
Annual total cost of homicide
72.18 72.79 96.21 60.32 77.59 59.85 57.93 48.60
Annual tangible cost of homicide
29.99 31.49 41.82 26.33 33.82 25.45 25.70 20.57
Per Homicide
Total cost per homicide 1.44 1.52 1.55 1.59 1.62 1.62 1.70 1.68
Tangible cost per homicide 0.60 0.66 0.67 0.69 0.70 0.69 0.76 0.71