reduction in greenhouse gas emissions
from temperate soils?
Shamsudheen Mangalassery
1,2, Sofie Sjo¨gersten
2, Debbie L. Sparkes
2, Craig J. Sturrock
2, Jim Craigon
2& Sacha J. Mooney
21Central Arid Zone Research Institute, Regional Research Station, Kukma-Bhuj, Gujarat 370105, India,2School of Biosciences, Sutton Bonington Campus, University of Nottingham, Sutton Bonington, Loughborough, Leicestershire, LE12 5RD, UK.
Soil tillage practices have a profound influence on the physical properties of soil and the greenhouse gas
(GHG) balance. However there have been very few integrated studies on the emission of carbon dioxide
(CO
2), methane (CH
4) and nitrous oxide (N
2O) and soil biophysical and chemical characteristics under
different soil management systems. We recorded a significantly higher net global warming potential under
conventional tillage systems (26–31% higher than zero tillage systems). Crucially the 3-D soil pore network,
imaged using X-ray Computed Tomography, modified by tillage played a significant role in the flux of CO
2and CH
4. In contrast, N
2O flux was determined mainly by microbial biomass carbon and soil moisture
content. Our work indicates that zero tillage could play a significant role in minimising emissions of GHGs
from soils and contribute to efforts to mitigate against climate change.
G
lobally, agriculture accounts for 10–12% of total anthropogenic emissions of greenhouse gases (GHGs),
estimated to be 5.1–6.1 Gt CO
2-eq yr
21in 2005
1. Conservation tillage is one among many different
mitigation options suggested to reduce GHG emissions from agriculture. Conservation tillage practices
such as reduced/minimum/zero tillage, direct drilling and strip cropping are also widely recommended to protect
soil against erosion and degradation of structure
2, create greater aggregate stability
3,4, increase soil organic matter
content, enhance sequestration of carbon
5,6, mitigate GHG emissions
7and improve biological activity
8. Derpsch
9estimated that approximately 45 million hectares was managed by conservation tillage worldwide in 2001 and this
figure had more than doubled by 2007.
Minimum tillage practices have been reported to reduce GHG emissions through decreased use of fossil fuels in
field preparation and by increasing carbon sequestration in soil
10. For example, Hermle et al.
13observed net
carbon sequestration to a depth of 50 cm after 20 years of no tillage. However, reduced tillage can lead to a
stratification of soil organic carbon at the surface
11in contrast to the more uniform distribution of carbon in
conventionally tilled soils
12. The crop residues accumulated on the soil surface under reduced tilled conditions
may result in carbon being lost to the atmosphere upon decomposition
10. Furthermore, climate change mitigation
benefits such as reduced CO
2emissions, by virtue of increased sequestration of carbon and increased CH
4uptake
under reduced tillage, could be offset by increased emissions of N
2O, a greenhouse gas with higher warming
potential than both CO
2and CH
413–15. Increased N
2O emissions have been linked to increased denitrification
under reduced tillage due to the formation of micro-aggregates within macro-aggregates that create anaerobic
micro sites
13with increased microbial activity leading to greater competition for oxygen
16.
Reduction of tillage can also create increased soil densification and a subsequent decrease in the volume of
macropores
17leading to reduction in gaseous exchange. Soil aggregation and the resultant geometry of the pore
structure are vitally important characteristics affected by tillage practices which impact on the physico-chemical
and hydro-thermal regime in soil, and ultimately crop yield. Additionally, the effect of tillage on the environment
varies across farms geographically since the impacts of cultivation on soil organic matter and net greenhouse
balance depends on soil type, climatic variables and management
15.
No previous studies have considered the effect of the soil porous architecture created by tillage on net balance of
greenhouse gas emissions. Traditional methods for inferring soil structure such as soil moisture retention curves
are limited as they are destructive and do not provide the soil pore size distribution in three dimensions
18.
However, imaging technologies such as X-ray Computed Tomography (CT) can be used to reveal the undisturbed
SUBJECT AREAS:
CLIMATE-CHANGE MITIGATION BIOGEOCHEMISTRY
Received
21 October 2013
Accepted
13 February 2014
Published
4 April 2014
structure, aggregation and pore characteristics at high resolutions
(e.g. microscale
,
100
m
m). In this study we sought to evaluate the
impact of zero tillage and conventional tillage on soil pore
character-istics, carbon sequestration and GHG emissions. We hypothesised
that zero tillage improves C sequestration and reduces GHG
emis-sions compared with conventional tillage through the enhanced
development of the soil porous network associated with less
anthro-pogenic disturbance.
Results
Soil physical properties
.
Soil texture varied between the different
experimental sites ranging from heavy clay soils to lighter sandy soils
(see supplementary Table 1). Crucially there was no significant
variation in soil texture between paired fields of conventional and
zero tilled soils (
P
.
0.05). Zero tilled soils had a higher bulk density
(1.16 Mg m
23) than tilled soils (1.09 Mg m
23) (Table 1,
P
,
0.001)
which was not influenced by length of zero tillage management
which ranged from 5–10 years (
P
.
0.05). Zero tilled soils had an
increased shear strength (26 MPa) compared to tilled fields
(12 MPa) (Table 1,
P
,
0.001), which was also independent of the
duration of zero tillage (
P
.
0.05). Soil moisture content
(volumetric) was significantly higher under zero tilled soils (29.6%)
compared to tilled soils (26.0%) (
P
,
0.01), regardless of the duration
of zero tillage (
P
.
0.05).
Soil pore characteristics
.
X-ray CT measured soil porosity was
significantly higher under tilled soil (13.6%) than zero tilled soil
(9.6%) (
P
,
0.001, Figure 1a). The porosity in the surface layer (0–
10 cm) of tilled soils were 46.9% higher than under zero tilled soils
and 33.2% higher in tilled compared to zero tilled soils in the 10–
20 cm layer (
P
,
0.001). Soil pore size followed similar pattern to soil
porosity (Figure 1b). Pore size significantly varied with tillage type
and soil depth with increased pore size at the surface layers of tilled
soil (Table 2,
P
,
0.05). Pores in tilled soils were twice as large
(0.52 mm
2) as those in zero tilled soils (0.27 mm
2) (
P
,
0.01). The
largest pore sizes were recorded in the 0–10 cm layer (0.55 mm
2) as
opposed to the 10–20 cm layer (0.24 mm
2) (
P
,
0.001). The surface
area of the total soil pore system was higher in tilled soils (Figure 1c,
P
,
0.001). The surface area of pores was also greater in the 0–10 cm
depth (1.83 mm
2) than the 10–20 cm depth (1.07 mm
2) across both
tilled and zero tilled soil treatments (
P
,
0.01).
Soil chemical and biological properties
.
Zero tilled soils contained
significantly more soil organic matter (SOM) than tilled soils (
P
,
0.001). Soil from the 0–10 cm layer contained more SOM than soils
from the 10–20 cm layers in both zero tilled (7.8 and 7.4% at 0–10 cm
and 10–20 cm respectively) and tilled soils (6.6% at 0–10 cm and
6.2% at 10–20 cm) (Table 1,
P
,
0.001). There were no significant
effects for duration of zero tillage on soil organic matter (Table 2).
Table 1 | Selected physico-chemical properties of soils under zero tillage and conventional tillage*
Tillage
Depth (cm)
Bulk density (Mg m23)
Shear strength (MPa)
Soil moisture
(%) pH
SOM (%)
NH4-N (mg
kg21 soil)
NO3-N
(mg kg21 soil)
Microbial C (mg kg21
soil)
Microbial N (mg kg21
soil)
Zero tilled 0–10 1.1660.04 25.761.47 31.2961.40 6.9860.13 7.8160.44 2.5960.10 0.6660.05 591.8655.0 104.967.92 10–20 ND** ND 27.9061.36 7.3260.10 7.4160.42 2.4260.08 0.4560.04 442.2626.6 77.365.11 Tilled 0–10 1.0960.04 12.061.12 26.9861.06 7.2260.14 6.5960.42 2.5160.16 0.6260.06 434.9644.3 73.465.11 10–20 ND ND 24.9661.11 7.2960.13 6.1560.40 2.3060.14 0.5460.06 402.5639.7 66.663.79
*Mean6Standard Error of mean (n533).
[image:2.595.121.477.451.707.2]**ND- not determined.
Neither ammonium (NH
4-N) nor nitrate (NO
3-N) content in soil
was affected by tillage. Soil from the upper 10 cm contained
signifi-cantly higher NH
4-N than the 10–20 cm layer (Table 1,
P
,
0.01).
Nitrate (NO
3-N) followed a similar trend to NH
4-N. Tillage type and
duration did not influence the NO
3-N content (
P
.
0.05). Soil depth
significantly influenced NO
3-N content (
P
,
0.001) with highest
amount in the surface layer (0–10 cm) under both zero tillage and
conventional tillage.
Zero tilled soils contained significantly more microbial biomass
carbon than tilled soils (
P
,
0.001). The mean microbial biomass
carbon under zero tilled soil was 517.0 mg kg
21soil compared with
418.7 mg kg
21soil in tilled soils. Microbial biomass carbon was
significantly higher in the 0–10 cm layer (517 mg kg
21soil) than
the 10–20 cm layer (419 mg kg
21soil) under zero tillage and
con-ventional tillage (
P
,
0.001, Table 1). Significantly higher microbial
biomass carbon was recorded at the 0–10 cm layer in zero tilled soil
(591.8 mg kg
21soil) with a significant tillage and depth interaction
(
P
,
0.001). However there was no significant effect of duration of
zero tillage (Table 2).
Tillage and soil depth significantly influenced soil microbial
bio-mass nitrogen (Table 1 and 2). Zero tilled soils contained a higher
microbial biomass nitrogen (91.1 mg kg
21soil) than tilled soil
(70.0 mg kg
21soil) (
P
,
0.001). Surface layers (0–10 cm)
main-tained more microbial biomass nitrogen than sub surface layers
(10–20 cm) under both zero tilled soils and tilled soils.
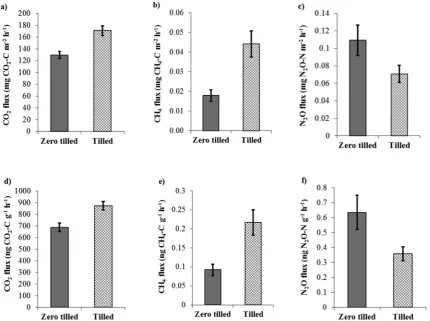
Fluxes of greenhouse gases
.
Potential CO
2flux was higher from
tilled soil than zero tilled soil (
P
,
0.05, Figure 2a). Potential CO
2fluxes under zero tilled soil ranged from 47 to 216 mg m
22h
21with a
mean value of 141 mg m
22h
21whilst under tilled soil it ranged from
119 to 236 mg m
22h
21with a mean value of 171 mg m
22h
21. The
potential CO
2flux on a per soil weight basis was also higher under
tilled soil (873 ng g
21h
21soil) compared to zero tilled soil (688 ng
g
21h
21soil) (
P
,
0.01, Figure 2d).
Potential CH
4fluxes were generally positive and higher from tilled
soils (0.044 mg m
22h
21or 0.22 ng g
21soil) compared to zero tilled
soil (0.018 mg m
22h
21or 0.09 ng g
21h
21soil) (
P
,
0.05, Figure 2b
and 2e). In contrast, potential N
2O emissions were higher under zero
tilled soil (0.63 ng g
21h
21) than tilled soil (0.36 ng g
21h
21) (54%
higher under zero tilled soil when measured on a soil area basis and
77% on a soil dry weight basis compared to tilled soil) (
P
,
0.01,
Figure 2c and 2f).
The net global warming potential calculated as per IPCC
19was
significantly higher from tilled soil than zero tilled soil. Tilled soil
produced 31% on an area basis or 26% on a weight basis greater
global warming potential (GWP) than zero tilled soil (
P
,
0.05,
Figure 3). There was no evidence to suggest that the different
dura-tion of zero tillage considered in this study, (5–10 years) affected net
emissions of greenhouse gases.
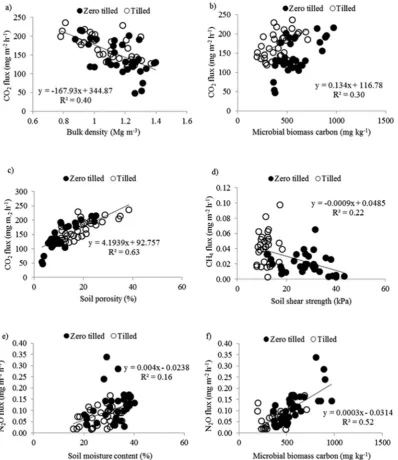
Relationship between greenhouse gas fluxes and soil properties
.
Potenital CO
2fluxes were predicted by a multiple regression model
(
P
,
0.001) including bulk density (BD), microbial biomass carbon
(MBC) and soil porosity (P) which accounted for 69.9% of the
variation. The optimal model for the potential CO
2flux is
provided in the equation (1).
CO
2flux mg m
{2
h
{1~
124
:
1
{
39
:
1BD
z
0
:
0412MBC
z
3
:
689P
ð
1
Þ
In this model the soil porosity contributed to c. 40% of variation,
much higher than the individual contribution by any other
parameter, as illustrated by retaining the parameter when fitting last
to the model. Together microbial biomass carbon and bulk density
contributed to 30% of the total variation (Figures 4a, 4b and 4c).
Only soil shear strength (SS) explained variation (18%) in the
potential CH
4flux (Equation 2, Figure 4d,
P
,
0.01).
CH
4flux mg m
{2
h
{1~
0
:
05344
{
0
:
001078SS
ð
2
Þ
The optimal model in equation (3) for potential N
2O flux accounted
for 62.0% of the variation and included soil moisture (SM), microbial
biomass nitrogen (MBN) and microbial biomass carbon (MBC)
(Figures 4e and 4f,
P
,
0.001).
N
2O flux mg m
{2
h
{1~{
0
:
0746
z
0
:
002057SM
{
0
:
00049 MBN
z
0
:
0003104MBC
ð
3
Þ
[image:3.595.44.557.87.265.2]Individually microbial biomass carbon explained the greatest
pro-portion (20.8%) of the total variation when fitted last in the model.
Removing soil moisture and microbial biomass nitrogen separately
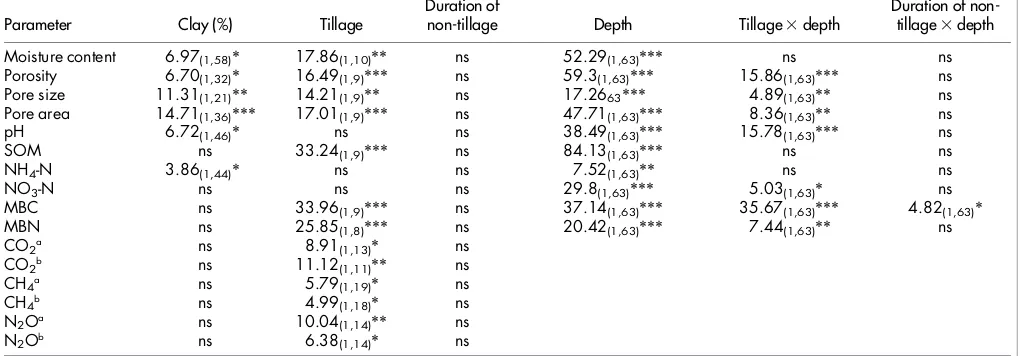
Table 2 | Statistical output from linear mixed modelling (texture, tillage, duration, depth) for the physico-chemical characteristics of soils
under zero tillage and conventional tillage (F
(df1,df2)statistic)
Parameter Clay (%) Tillage Duration ofnon-tillage Depth Tillage3depth Duration of non-tillage3depth
Moisture content 6.97(1,58)* 17.86(1,10)** ns 52.29(1,63)*** ns ns
Porosity 6.70(1,32)* 16.49(1,9)*** ns 59.3(1,63)*** 15.86(1,63)*** ns
Pore size 11.31(1,21)** 14.21(1,9)** ns 17.2663*** 4.89(1,63)** ns
Pore area 14.71(1,36)*** 17.01(1,9)*** ns 47.71(1,63)*** 8.36(1,63)** ns
pH 6.72(1,46)* ns ns 38.49(1,63)*** 15.78(1,63)*** ns
SOM ns 33.24(1,9)*** ns 84.13(1,63)*** ns ns
NH4-N 3.86(1,44)* ns ns 7.52(1,63)** ns ns
NO3-N ns ns ns 29.8(1,63)*** 5.03(1,63)* ns
MBC ns 33.96(1,9)*** ns 37.14(1,63)*** 35.67(1,63)*** 4.82(1,63)*
MBN ns 25.85(1,8)*** ns 20.42(1,63)*** 7.44(1,63)** ns
CO2a ns 8.91(1,13)* ns
CO2b ns 11.12(1,11)** ns
CH4a ns 5.79(1,19)* ns
CH4b ns 4.99(1,18)* ns
N2Oa ns 10.04(1,14)** ns
N2Ob ns 6.38(1,14)* ns
Subscripted numbers indicate degrees of freedom for F value; df15numerator df, df25denominator df, ns: non-significant, SOM: soil organic matter, MBC: microbial biomass carbon, MBN: microbial biomass nitrogen, superscripts a and b following CO2, CH4and N2O represents potentials expressed in mg m22h21and ng g21h21, respectively).
***p,0.001.
**p,0.01.
from the model did not substantially decrease the amount of
vari-ation explained suggesting that these factors were confounded.
Discussion
We have demonstrated tillage practice has the potential to strongly
influence release of CO
2, CH
4and N
2O, through its impact on soil
biophysical properties across a wide range of soil textures. However,
the main driving factors and the direction of change varied among
the three GHGs measured. The higher CO
2release found in response
to tillage highlights the role of ploughing in the breakdown of soil
aggregates and exposure of organic materials for microbial
decom-position
20. Soil pore characteristics (previously ignored in similar
studies), such as total porosity and pore size, were a stronger
pre-dictor of CO
2flux than soil organic matter and microbial biomass
carbon, which has not been previously reported. The effects of zero
tillage was to reduce soil porosity by 33%, which lead to 21%
reduc-tion in potential CO
2efflux. These results demonstrate the increased
soil porosity under conventional tillage favours the respiration of
aerobic organisms by improving movement of water and air through
the soils
21with important implications for CO
2
emissions. In parallel,
strong effects of soil bulk density on CO
2production from soil cores
have been shown by Beare et al.
22who found 2.3 times more CO
[image:4.595.84.515.51.372.2]2
production under uncompacted soil than in compacted soil. The
potential CO
2flux data presented here (47 to 235 mg m
22h
21) is
Figure 2
|
Fluxes of greenhouse gas from zero tilled and tilled soil.(a) CO2expressed in mg CO2-C m22h21, (b) CH4expressed in mg CH4-C m22h21, (c) N2O expressed in mg N2O-N m22h21, (d) CO2expressed in ng CO2-C g21h21, (e) CH4expressed in ng CH4-C g21h21and (f) N2O expressed in ng N2O-N g21h2(average values for different sites and standard error of the mean are shown, n533). [image:4.595.99.499.567.719.2]in the range of that reported from laboratory incubations of soils
from 13 European sites including, arable land (47 mg m
22h
21) and
grassland (186 mg m
22h
21)
23. Similar effects of tillage on CO
2
fluxes
were found by Ball
et al.
24investigating
in situ
CO
2
fluxes, they
attributed the greater CO
2efflux to the larger pores created by tillage.
Potential CH
4flux ranged from 0.0025 to 0.16 mg m
22h
21, which is
high compared to values reported by Schaufler et al.
23: e.g. average
CH
4flux in arable land was 0.0014 mg m
22h
21and in grassland it
was 0.0005 mg m
22h
21. Despite the less porous and wetter status of
zero tilled soils, which normally promote CH
4production
31, the
opposite was the case here which may be due to increased activity
of methanotrophic bacteria
32. The reduced potential CH
4
flux under
zero tillage was best predicted by soil shear strength which reflects
the reduced porosity and high bulk density in zero tilled
soils
17,25,26.Increased bulk density in soil can prevent flow of CH
4
in
soil and the resulting enhanced retention of CH
4in soil may improve
oxidation by methanotrophs
27resulting in lower CH
4
emissions.
Furthermore, the development of methanotrophic populations is
negatively affected by tillage
28which are slow to recover
29,30. The
potential N
2O fluxes measured were comparable to field
measure-ment by Regina et al.
33in Finnish soils after 5–7 years of zero till
management (0.003 to 0.23 mg m
22h
21) with significantly higher
N
2O fluxes under zero tillage. They reported 21 to 86% higher N
2O
flux in zero till soils when compared to tilled soils. The average
increased emission of
in situ
N
2O flux under zero tilled soils obtained
by Oorts et al.
34was 39% for a 30 year experiment. As with CH
4
, N
2O
is produced under reducing conditions in waterlogged and poorly
aerated soils
35,36, so we attribute the increased potential N
[image:5.595.102.501.50.511.2]2
O
emis-sions from zero tilled soils in part to the wetter and denser soils found
under this management regime. In contrast to the potential CO
2and
CH
4fluxes, the potential production of N
2O was most strongly
related to the soil microbial biomass. The greater total soil microbial
biomass found under zero tillage may hence play a very important
role in N
2O release. One important aspect of zero tillage is enhanced
crop residue retention resulting in greater SOM content. Given the
importance of an adequate supply of labile substrates for the
denit-rifying bacteria
35, it may also be that the crop retention under zero
tillage drives greater N
2O release.
Considering the GHGs together, tilled soil produced 20% greater
net global warming than zero tilled soil indicating a potential for zero
tillage system to mitigate climate change after only 5 to 10 years since
conversion (earlier than this was not measured here). In parallel with
this Del Grosso et al.
37also reported a 33% reduction in global
warm-ing potential under zero tillage (0.29 Mg C ha
21y
21) compared with
tilled soil (0.43 Mg C ha
21y
21) for major non-rice cropping systems
in US based on simulation using DAYCENT ecosystem model. Also
in subtropical conditions, zero tillage has been found to reduce GWP
by c. 20%
38.
Zero tilled soils had enhanced SOM, microbial biomass carbon
and nitrogen. Importantly, the time during which the soils had been
under conservation tillage did not influence the SOM content in the
soil (although only changes between 5 and 10 years were measured),
suggesting that increases in SOM occurred within five years
follow-ing conversion to zero tillage. However West and Post
5in similar
work recorded a large increase in soil between 5–10 years. The time
required to reach a steady state for carbon sequestration will vary
with respect to climate, soil types and the management practices
followed
39.
A very important question that remains to be addressed is how the
impact of the change in the soil porous architecture brought by
tillage/zero tillage on net GHG release and the GWP varies
spatio-temporaly across a greater range of soils types, crops and climate than
those explored in our study. With reduced tillage practices becoming
more prevelant globally, it is important to further understand the
impacts of this on the biophysical evolution of the soil environment
at both micro and macroscales. It is clear from this study that the
modification of soil structure by tillage plays a crucial role for GHG
release. Our study was based on analysis of intact cores removed
from the field. To fully account for the impact of zero tillage on
GHG release it is important to extend this work to
in situ
field
measurement through the year to account for variation in weather
and crop development. In conclusion, we have shown soils under
zero tillage increased potential N
2O emissions, but this is
counter-balanced by a significant reduction in potential CO
2and CH
4emis-sions which is closely linked to the geometry of the soil porous
architecture. To evaluate the potential of zero tillage as a tool for
mitigation of climate change, there is a need to further assess its
impact on yield to ensure a balance between climate change
mitiga-tion and food security is achieved.
Methods
Soils.A selection of 22 farms from Leicestershire, Nottinghamshire and Lincolnshire
in the East Midlands of the U.K. were chosen for this study. All sampling sites comprised pairs of intensely tilled farms and farms where zero tillage practices were followed, located directly adjacent to each other. The zero tilled soils had been managed in this way for a minimum of 5 years to a maximum of 10 years. In fields under zero tillage, stubble was left at the surface after harvest of the previous crop. Seed drilling was carried out between the root stocks of previous crop using a range of min-till seed drills. The crops cultivated under zero tilled and tilled sites were wheat, oil seed rape and oats. The tilled soil sites were annually ploughed to depths of 20–25 cm and contained the same crops as the zero tilled fields at the time of sampling. Sampling was undertaken shortly after seedbed preparation and sowing so as to minimize any effect of the emerging root system on soil structure.
Intact soil cores were collected using a manual core sampler that used transparent sample liner tubes (Van Walt Ltd, Haslemere, UK). The core sampling was performed to a depth of 20 cm with a diameter of 5 cm and in triplicate. The samples were labelled and sealed in plastic bags before transporting to the laboratory. Samples were stored at 4uC until measurements were taken (,2 weeks). Bulk soil samples of about 1 kilogram were also collected from two depth ranges (0 to 10 cm and 10 to 20 cm) and stored at 4uC until measurement. Smaller soil cores were collected in the field using stainless steel cylinders (radius 3.4 cm, height 4 cm) for measurement of bulk density40.
Soil physical properties.Soil shear strength was recorded in the field using a Pilcon
120 kPa hand vane from the upper 50 mm of soil. Similarly the volumetric water content of the surface layer of soil (0–10 cm depth) was recorded using a Delta-T Theta probe connected to a Theta meter. All observations were recorded in triplicate for each field. Particle size analysis was performed using the hydrometer method41.
Soil textural classification was made according to European classification using 60mm as the upper limit for silt42.
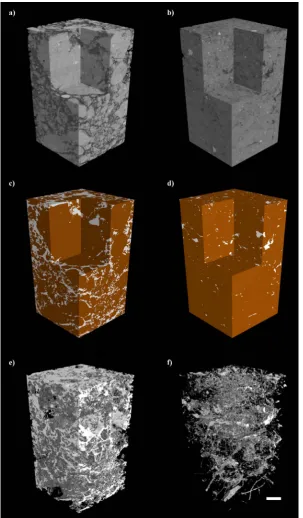
X-ray Computed Tomography (CT).Prior to the study of GHGs, the soil core
samples were subjected to morphological analysis using an X-ray CT scanner (Nanotom, Phoenix X-ray, GE Sensing and Inspection Technologies GmbH, Germany) to visualise and measure the internal soil structure. The cores were scanned at a voltage of 140 kV and a current of 100 mA. A copper filter of thickness 0.25 mm was used to minimise artefacts such as beam hardening. The image resolution was 64mm per voxel. The soil core was positioned vertically onto the scanner platform. Each scan lasted 100 minutes per core, scanning both top and bottom 10 cm portions in a split scan. Whilst it is possible to achieve much faster scan times than this, a larger scan time was used to achieve the highest possible image quality. For each scan 1000 images were collected. The obtained images were visualised using the software, VG StudioMax (Volume Graphics). The images were converted to the tiff format and analysed using ImageJ43to study the soil pore characteristics. A rectangular region of
interest (27.94327.94 mm2) was selected to avoid the edges of the soil cores. In
addition the first 100 images each from the beginning and end of the scan were discarded due to cone beam artefacts. The images were sharpened to highlight the image features and then smoothed by a median filter before being converted to the binary scale using the minimum threshold algorithm in ImageJ. Both dark and bright outliers were removed and the ‘fill holes’ function was used to minimise noise. Measurements on soil physical features were obtained on the binary images which included porosity, number of pores, pore size and surface area of pores (Figure 5).
Soil chemical and biological properties.Soil pH was determined on air dried 2 mm
sieved soils using 152 soil to water ratio using a combined glass electrode. Total soil organic matter (SOM) content in soil was determined by loss on ignition following igniting oven dried soil at 550uC in a muffle furnace. For the measurement of ammonium and nitrate (NH4-N and NO3-N) concentration, 6 g of field moist soil
was used. An extraction was carried out using 40 ml of 2 M KCl by shaking and filtration. Ammonium in the extracts was determined colourimetrically44. A suitable
aliquot of the filtrate (1 ml) was made to react with phenol and hypochlorite to form a blue indophenol complex in solution. The concentration of ammonium in solution was measured by comparing the absorbance with known standards prepared using NH4Cl at a wavelength of 635 nm. For the determination of NO3-N, nitrate in a
suitable aliquot of KCl extract was reduced to nitrite using spongy cadmium, which was further complexed to form a red azo-species in solution. The concentration of NO3-N was measured by comparing the absorbance with known standards of KNO3
at a wavelength of 543 nm45. Field moist soil samples (both surface 0–10 and
subsurface 10–20 cm depths) were used for the estimation of microbial biomass carbon and nitrogen by the chloroform fumigation-extraction technique46. Samples
were incubated in the chloroform environment in presence of soda lime. The extraction was carried out using 0.5 M K2SO4at the start of fumigation in
un-fumigated samples and 24 hour after fumigation in un-fumigated samples. Microbial biomass carbon and nitrogen in the extracts were analysed using a Shimadzu CN analyser (TOC-V CPH Shimadzu). The results were corrected using the value of 0.45 for both carbon and nitrogen47.
Potential fluxes of greenhouse gases.Cores were removed from the 4uC
environment and kept at a constant temperature of 16uC for 48 hours to activate and stabilise the biological activity. Gas sampling was performed by placing cores in 1.5 litre plastic jars (20 cm height and 10 cm diameter) with a septum on the top to aid gas sampling using a 20 ml syringe. The air in the headspaces was mixed, before sampling at time intervals 0, 15, 30 and 60 minutes using 20 ml syringes. The collected gas samples were stored in airtight pre-evacuated glass vials and analysed for concentration of CO2, CH4and N2O using gas chromatography equipped with a
Thermal Conductivity Detector (TCD), Flame Ionization Detector (FID) and an electron capture detector (ECD) (GC-2014, Shimadzu). The fluxes of these samples were calculated using linear regression of the gas concentration against time. The GHG data was converted to mass per volume and mass per weight basis by the use of ideal gas equation and the molecular mass of each gas48.
n~PV
RT ð4Þ
Where n is the number of moles of CO2, N2O or CH4, P is atmospheric pressure
(<1 atm), V is the volume of head space (dm23), R is the ideal gas constant
(0.08205746 L atm K21mol21) and T is the temperature of sampling (273.151room
temperature inuC). From this the flux of gas was measured.
E~nm
at|1000 ð5Þ
Where E5flux of each gas in mg m22h21, n5number of moles of CO
2, N2O or CH4,
m5molar weight of CO2(44.01), N2O (44.01) or CH4(16.04), a5area of the soil
core used and t is the time in hour. Finally total greenhouse balance or net global warming potential (GWP) was calculated in CO2-equivalents19using the following
GWP~ CO2|44
12
zðCH4|23ÞzðN2O|296Þ
ð6Þ
Statistical analysis.Each site consisted of a pair of fields; one of which was ploughed
and the other had been tilled for a number of years. The sites were in areas consisting of a range of soil types in different geographical regions although at each site the tilled and zero tilled fields were located adjacent to each other. Samples were taken at a number of random locations in each field and at two soil depths (0–10 and 10–20 cm). The variation in soil properties in response to tillage and soil depth was analysed as split-split plot design in a linear mixed model with site, field and location within fields as random effects. Tilled vs non-tilled, soil depth and their interaction
[image:7.595.148.452.50.569.2]were considered as fixed effects. The variation among just the zero-tilled fields was further partioned to test for a trend in response to the number of years since adoption of zero tillage. This test was thus orthogonal to the tilled vs zero-tilled contrast as was its interactions with soil depth. To account for potential differences with respect to soil texture, the clay content of the soil was considered as a covariate by including it as a fixed effect in the model. The covariate could account for significant amounts of the random variation among fields and locations. In such cases, by reducing the unexplained residual variation, the model including the covariate is likely to be more sensitive for detecting tillage effects than a model without the covariate. Multiple linear regressions were used to predict the best model describing the fluxes of GHGs from soil. The maximal model consisted of all the physical, chemical and biological properties studied in this experiment. By using a stepwise backwards elimination process, only the variables that contributed significantly to the model and reduced the residual sum of squares were retained in the model. For illustrative purposes we also
carried out the single linear regression between the parameters that contributed to the multiple regression models. All tests were performed using Genstat (14thEdition,
VSN International Ltd, UK).
1. Smith, P.et al. [Agriculture]Climate Change 2007: Mitigation. Contribution of Working Group III to the Fourth Assessment Report of the Intergovernmental Panel on Climate Change[Metz, B.et al. (ed.)] (Cambridge University Press, Cambridge, United Kingdom and New York, USA, 2007).
2. Petersen, S. O., Mutegi, J. K., Hansen, E. M. & Munkholm, L. J. Tillage effects on N2O emissions as influenced by a winter cover crop.Soil Biol. Biochem.43, 1509–1517 (2011).
3. Ferna´ndez, R., Quiroga, A., Zorati, C. & Noellemeyer, E. Carbon contents and respiration rates of aggregate size fractions under no-till and conventional tillage.
Soil Tillage Res.109, 103–109 (2010).
4. Zotarelli, L., Alves, B. J. R., Urquiaga, S., Boddey, R. M. & Six, J. Impact of tillage and crop rotation on light fraction and intra-aggregate soil organic matter in two Oxisols.Soil Tillage Res.95, 196–206 (2007).
5. West, T. O. & Post, W. M. Soil organic carbon sequestration rates by tillage andcrop rotation.Soil Sci. Soc. of Am. J.66, 1930–1946 (2002).
6. Six, J., Elliott, E. T. & Paustian, K. Soil macroaggregate turnover and microaggregate formation: a mechanism for C sequestration under no-tillage agriculture.Soil Biol. Biochem.32, 2099–2103 (2000).
7. Kong, A. Y. Y., Fonte, S. J., van Kessel, C. & Six, J. Transitioning from standard to minimum tillage: Trade-offs between soil organic matter stabilization, nitrous oxide emissions, and N availability in irrigated cropping systems.Soil Tillage Res. 104, 256–262 (2009).
8. Helgason, B. L., Walley, F. L. & Germida, J. J. No-till soil management increases microbial biomass and alters community profiles in soil aggregates.Appl. Soil Ecol.46, 390–397 (2010).
9. Derpsch, R. & Friedrich, T.Proceedings, Lead Papers, 4th World Congress on Conservation Agriculture429–438 (New Delhi, India, 2009).
10. Petersen, S. O., Schjønning, P., Thomsen, I. K. & Christensen, B. T. Nitrous oxide evolution from structurally intact soil as influenced by tillage and soil water content.Soil Biol. Biochem.40, 967–977 (2008).
11. Baker, J. M., Ochsner, T. E., Venterea, R. T. & Griffis, T. J. Tillage and soil carbon sequestration--What do we really know?Agric. Ecosyst. Environ.118, 1–5 (2007). 12. Campbell, C.et al. Quantifying short-term effects of crop rotations on soil organic
carbon in southwestern Saskatchewan.Can. J. Soil Sci.80, 193–202 (2000). 13. Hermle, S., Anken, T., Leifeld, J. & Weisskopf, P. The effect of the tillage system on
soil organic carbon content under moist, cold-temperate conditions.Soil Tillage Res.98, 94–105 (2008).
14. Six, J.et al. The potential to mitigate global warming with no-tillage management is only realized when practised in the long term.Global Change Biol.10, 155–160 (2004).
15. Chatskikh, D. & Olesen, J. E. Soil tillage enhanced CO2 and N2O emissions from loamy sand soil under spring barley.Soil Tillage Res.97, 5–18 (2007). 16. West, T. O. & Marland, G. Net carbon flux from agricultural ecosystems:
methodology for full carbon cycle analyses.Environ. Pollut.116, 439–444 (2002). 17. Schjønning, P. & Rasmussen, K. J. Soil strength and soil pore characteristics for
direct drilled and ploughed soils.Soil Tillage Res.57, 69–82 (2000). 18. Gantzer, C. J. & Anderson, S. H. Computed tomographic measurement of
macroporosity in chisel-disk and no-tillage seedbeds.Soil Tillage Res.64, 101–111 (2002).
19. IPCC.Climate Change 2001: The Scientific Basis, Contribution of Working Group I to The Third assessment Report Of The Intergovernmental Panel On Climate Change[Houghton, J. T.et al. (ed.)] (Cambridge University Press, 2001). 20. Ussiri, D. A. N. & Lal, R. Long-term tillage effects on soil carbon storage and
carbon dioxide emissions in continuous corn cropping system from an alfisol in Ohio.Soil Tillage Res.104, 39–47 (2009).
21. Udawatta, R. P. & Anderson, S. H. CT-measured pore characteristics of surface and subsurface soils influenced by agroforestry and grass buffers.Geoderma145, 381–389 (2008).
22. Beare, M. H., Gregorich, E. G. & St-Georges, P. Compaction effects on CO2 and N2O production during drying and rewetting of soil.Soil Biol. Biochem.41, 611–621 (2009).
23. Schaufler, G.et al. Greenhouse gas emissions from European soils under different land use: effects of soil moisture and temperature.Eur. J. Soil Sci.61, 683–696 (2010). 24. Ball, B. C., Scott, A. & Parker, J. P. Field N2O, CO2 and CH4 fluxes in relation to tillage, compaction and soil quality in Scotland.Soil Tillage Res.53, 29–39 (1999). 25. Bhattacharyya, R., Prakash, V., Kundu, S. & Gupta, H. S. Effect of tillage and crop rotations on pore size distribution and soil hydraulic conductivity in sandy clay loam soil of the Indian Himalayas.Soil Tillage Res.86, 129–140 (2006). 26. Wu, L., Swan, J. B., Paulson, W. H. & Randall, G. W. Tillage effects on measured
soil hydraulic properties.Soil Tillage Res.25, 17–33 (1992).
27. Smith, P.et al. Enhancing the carbon sink in European agricultural soils: including trace gas fluxes in estimates of carbon mitigation potential.Nutr. Cycl. Agroecosys. 60(2001).
28. Mosier, A.et al. Impact of agriculture on soil consumption of atmospheric CH4 and a comparison of CH4 and N2O flux in subarctic, temperate and tropical grasslands.Nutr. Cycl. Agroecosys.49, 71–83 (1997).
29. Hu¨tsch, B. W. Tillage and land use effects on methane oxidation rates and their vertical profiles in soil.Biol. Fert. Soils27, 284–292 (1998).
30. Nazaries, L.et al. Response of methanotrophic communities to afforestation and reforestation in New Zealand.ISME J.5, 1832–1836 (2011).
31. Yu, K., Bohme, F., Rinlebe, J., Neue, H. & DeLaune, R. D. Major biogeochemical processes in soils-A microcosm incubation from reducing to oxidizing conditions.
Soil Sci. Soc. Am. J.71, 1406–1417 (2007).
32. Ussiri, D., Lal, R. & Jarecki, M. K. Nitrous oxide and methane emissions from long-term tillage under a continuous corn cropping system in Ohio.Soil Tillage Res.104, 247–255 (2009).
33. Regina, K. & Alakukku, L. Greenhouse gas fluxes in varying soils types under conventional and no-tillage practices.Soil Tillage Res.109, 144–152 (2010). 34. Oorts, K., Merckx, R., Grehan, E., Labreuche, J. & Nicolardot, B. Determinants of
annual fluxes of CO2 and N2O in long-term no-tillage and conventional tillage systems in northern France.Soil Tillage Res.95, 133–148 (2007).
35. Choudhary, M. A., Akramkhanov, A. & Saggar, S. Nitrous oxide emissions from a New Zealand cropped soil: tillage effects, spatial and seasonal variability.Agric. Ecosyst. Environ.93, 33–43 (2002).
36. Gregorich, E. G., Rochette, P., St-Georges, McKim , U. F. & Chan, C. Tillage effects on N2O emission from soils under corn and soybeans in Eastern Canada.Can. J. Soil Sci.88, 153–161 (2008).
37. Del Grosso, S. J., Mosier, A. R., Parton, W. J. & Ojima, D. S. DAYCENT model analysis of past and contemporary soil N2O and net greenhouse gas flux for major crops in the USA.Soil Tillage Res.83, 9–24 (2005).
38. Piva, J. T.et al. No-till reduces global warming potential in a subtropical Ferralsol.
Plant Soil361, 359–373 (2012).
39. Post, W. M.et al. Enhancement of carbon sequestration in US soils.Bioscience54, 895–908 (2004).
40. Page, A. L., Miller, R. H. & Keeney, D. R.Methods Of Soil Analysis, Part 2-Chemical And Microbiological Properties-Second Edition.(American Society of Agronomy and Soil Science Society of America, Madison, WI, USA, 1982). 41. Bouyoucos, G. J. Hydrometer method improved for making particle size analyses
of soils.Agron. J.54, 464–465 (1961).
42. Rowell, D. L.Soil Science: Methods And Applications(Longman Scientific and Technical, UK, 1994).
43. Rasband, W. NIH ImageJ, Research Service Branch, National Institute of Mental Health, National Institute of Health, Bethesda, MD (2002) Available online at http://rsb.info.nih.gov/ij/docs/intro.html (Date of access: October 21, 2013) (2002).
44. Kempers, A. J. Determination of sub-microquantities of ammonium and nitrates in soils with phenol, sodiumnitroprusside and hypochlorite.Geoderma12, 201–206 (1974).
45. Jones, M. N. Nitrate reduction by shaking with cadmium: Alternative to cadmium columns.Water Res.18(1984).
46. Vance, E. D., Brookes, P. C. & Jenkinson, D. S. An extraction method for measuring soil microbial biomass C.Soil Biol. Biochem.19, 703–707 (1987). 47. Jenkinson, D. S., Brookes, P. C. & Powlson, D. S. Measuring soil microbial
biomass.Soil Biol. Biochem.36, 5–7 (2004).
48. Denef, K., Zotarelli, L., Boddey, R. M. & Six, J. Microaggregate-associated carbon as a diagnostic fraction for management-induced changes in soil organic carbon in two Oxisols.Soil Biol. Biochem.39, 1165–1172 (2007).
Acknowledgments
We acknowledge the research funding by the Indian Council of Agricultural Research, New Delhi through International Fellowship programme and the University of Nottingham through Research Excellence Scholarship. Thanks are also due to the farmers who permitted access to their land and to Boris Lazarevic for field assistance.
Author contributions
Original ideas for the research came from S.S., D.S. and S.J.M; S.M., S.S. and S.J.M. undertook all sampling; S.M. and C.J.S. conducted the X-ray CT scanning and analysis; J.C. provided statistical advice; Construction of paper by S.M., S.S., C.J.S., J.C., D.S. and S.J.M.
Additional information
Supplementary informationaccompanies this paper at http://www.nature.com/ scientificreports
Competing financial interests:The authors declare no competing financial interests.
How to cite this article:Mangalassery, S.et al. To what extent can zero tillage lead to a reduction in greenhouse gas emissions from temperate soils?Sci. Rep.4, 4586; DOI:10.1038/srep04586 (2014).