Investigating the molecular orientation of Ir(ppy)3 and Ir(ppy)2(acac) emitter complexes by X-ray diffraction
Caroline Murawski, Chris Elschner, Simone Lenk, Sebastian Reineke, Malte C. Gather
PII: S1566-1199(17)30568-2 DOI: 10.1016/j.orgel.2017.11.036 Reference: ORGELE 4411
To appear in: Organic Electronics
Received Date: 25 July 2017 Revised Date: 6 October 2017 Accepted Date: 24 November 2017
Please cite this article as: C. Murawski, C. Elschner, S. Lenk, S. Reineke, M.C. Gather, Investigating the molecular orientation of Ir(ppy)3 and Ir(ppy)2(acac) emitter complexes by X-ray diffraction, Organic Electronics (2017), doi: 10.1016/j.orgel.2017.11.036.
M
AN
US
CR
IP
T
AC
CE
PT
ED
Investigating the molecular orientation of Ir(ppy)
3
and Ir(ppy)
2
(acac) emitter complexes by X-ray
diffraction
Caroline Murawski1,2, Chris Elschner1, Simone Lenk1, Sebastian Reineke1, and Malte C.
Gather1,2,*
1
Dresden Integrated Center for Applied Physics and Photonic Materials (IAPP) and Institute for
Applied Physics, Technische Universität Dresden, Nöthnitzer Str. 61, 01187 Dresden, Germany
2
Organic Semiconductor Centre, SUPA, School of Physics & Astronomy, University of St
Andrews, North Haugh, St Andrews, KY16 9SS, Scotland, UK
*[email protected] (Corresponding Author)
ABSTRACT. We study thermally evaporated thin films of Ir(ppy)3 and Ir(ppy)2(acac) by means
of grazing incidence X-ray diffraction (GIXRD) and grazing incidence wide-angle X-ray
scattering (GIWAXS). Ir(ppy)3 and Ir(ppy)2(acac) are both widely used as phosphorescent green
emitter molecules in organic light-emitting diodes (OLEDs) and it was previously found that
differences in their average transition dipole orientation affect the light extraction efficiency in
OLEDs. Here we show that in pure films both materials form crystalline grains and that these
M
AN
US
CR
IP
T
AC
CE
PT
ED
amorphous host, both the orientation and formation of the crystallites remain nearly unchanged
for the concentration range accessible with GIXRD and GIWAXS. This is remarkable given that
the transition dipole moments have found to be oriented only for Ir(ppy)2(acac) but isotropic for
Ir(ppy)3. Analysis of the crystallite size indicates that the tendency to form crystallites is stronger
for Ir(ppy)3 than for Ir(ppy)2(acac). From a comparison of the thin-film diffraction data of
Ir(ppy)3 to its powder pattern, we infer that Ir(ppy)3 molecules are oriented with their permanent
dipole moment roughly parallel to the substrate. Our findings will guide the further
understanding of the mechanisms controlling transition dipole orientation and may thus lead to
further improvements in device efficiency.
KEYWORDS. Phosphorescent iridium complex, orientation, organic light-emitting diode, X-ray
diffraction.
1. Introduction
The orientation of the emitting molecules in organic light-emitting diodes (OLEDs) has a
significant impact on OLED efficiency.[1–5] In particular, if all transition dipole moments are
aligned horizontally with respect to the substrate, one expects an increase in outcoupling
efficiency by approximately 60% compared to isotropic orientation.[6] A preferential orientation
of the transition dipole moment has been observed for many emitting molecules but its origin
remains a subject of debate in the OLED community. Graf et al. suggested that strong
dipole-dipole potential of iridium compounds leads to aggregation and, thus, random orientation, while
the observed anisotropy of emitters with a weaker potential is based on matrix-induced London
M
AN
US
CR
IP
T
AC
CE
PT
ED
preferentially aligned with respect to the substrate due to the formation of supramolecules with
the host materials.[6] Recently, Jurow et al. suggested that the strong chemical asymmetry that is
often observed in heteroleptic emitter complexes means that molecules adopt a preferential
orientation with respect to the substrate when they impinge on the film surface during thermal
evaporation.[8]
So far, there is a lack of experimental data on the alignment of the molecules themselves (i.e. the
average orientation of the principal axes of symmetry) because the quantity that has been
measured in most experiments so far is the average orientation of the transition dipole moments
in the film with respect to the substrate. Typical measurement techniques include variable angle
spectroscopic ellipsometry[4] and angular resolved photoluminescence[9,10] and
electroluminescence[3,7] measurements. While molecules that show a predominant orientation
of their transition dipoles will automatically have a preferred orientation of their symmetry axis,
the situation is less clear for molecules that show an isotropic dipole orientation when
characterized with the above optical methods. For these molecules, the observed isotropy can
either be due to random orientation of the molecule or may be indicative of a situation where
molecules are aligned on the substrate but have their transition dipole moments slanted such that
they contribute equally in all three emission directions.[6,11]
Very recently, X-ray diffraction studies have shown that phosphorescent platinum emitters can
form large crystals with a nearly perfect horizontal alignment of the transition dipoles.[12] In
contrast, the light-emitting structures that are traditionally used in OLEDs are generally believed
to comprise of amorphous films which are generally not amenable to investigation by X-ray
M
AN
US
CR
IP
T
AC
CE
PT
ED
transistors or photovoltaics where crystalline or semi-crystalline morphology is more
prevalent.[13–15] In this contribution, we use X-ray diffraction measurements to determine the
orientation of the symmetry axes of Ir(ppy)3 and Ir(ppy)2(acac) molecules and, thus, their
alignment on a substrate. Ir(ppy)3 and Ir(ppy)2(acac) are selected as model emitters because they
are well-studied in terms of their transition dipole orientation and their tendency to form
aggregates.[3,16] We have previously found that in a CBP matrix the transition dipoles of
Ir(ppy)2(acac) exhibit a preferential horizontal orientation with an anisotropy factor of a = 0.23
while the transition dipoles of Ir(ppy)3 showed isotropic orientation (a = 0.33).[3] (The
anisotropy factor a is defined as the ratio of vertical transition dipole moments to the total
radiated power, i.e. a = 0 represents perfect horizontal orientation.)
When X-ray diffraction measurements are performed in conventional specular geometry, i.e. the
incident angle ω equals the reflection angle 2θ, the penetration depth of X-rays into the surface
of the sample is several µm, which is orders of magnitude larger than the typical layer thickness
of organic thin films. In order to get information about the organic films and to not
predominantly probe the underlying substrate, grazing-incidence geometries are used here, i.e.
the angle ω between the incident X-rays and sample surface is kept very small (ω≈ 0.2°). This
leads to total reflection at the interface between the organic thin film and substrate and thus
allows probing solely the organic material.
2. Experimental Section
Layer fabrication. Tris(2-phenylpyridine)iridium(III) (Ir(ppy)3) and
M
AN
US
CR
IP
T
AC
CE
PT
ED
or doped into 4,4’,4”-tris(N-carbazolyl)-triphenylamine (TCTA) or
4,4’-bis(carbazol-9-yl)biphenyl (CBP) using co-evaporation. All materials were purchased commercially and
purified further by vacuum sublimation prior to use. 50 nm thick organic films were prepared on
pre-cleaned glass substrates by thermal evaporation in UHV at a base pressure of 10-7 mbar (Kurt
J. Lesker Co.). The host materials were deposited at rates between 0.3 and 0.8 Å/s. For
co-evaporation, the deposition rate of the dopant was adjusted to achieve the desired doping
concentration. The rates and layer thicknesses were controlled in-situ by calibrated quartz crystal
monitors. Samples were packed into sealed boxes under nitrogen atmosphere directly after
fabrication and boxes were only opened immediately before the measurement to avoid extended
exposure of the films to air.
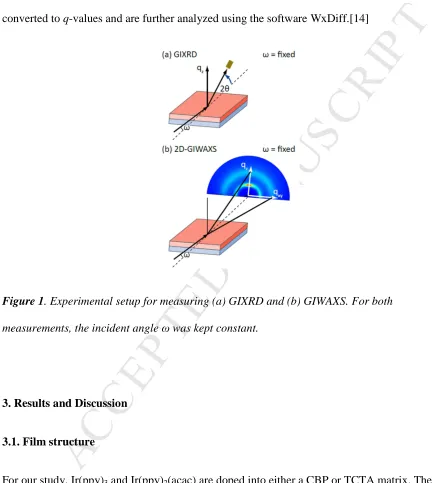
X-ray diffraction measurements. Two different configurations were employed – grazing
incidence X-ray diffraction (GIXRD) and grazing incidence wide-angle X-ray scattering
(GIWAXS) (see Figure 1a and b, respectively). GIXRD was measured at a Bruker D8 Discover
diffractometer, which uses Cu-Kα radiation (λ = 1.54 Å) and a scintillation counter. The angle of
incidence was kept constant at approximately ω≈ 0.2° while the reflection angle 2θ was scanned
from 3−90° in angular steps of 0.1°, using a 30 s sampling time. Additionally, the background
was measured at a smaller angle of incidence so that X-rays were totally reflected at the interface
between air and organic thin film. All measurements shown were background-corrected (cf. Ref.
[17] for more details). Due to the small incident angle, the spot size is several mm. With such a
large area contributing to the scattering of X-rays, Bragg reflections are broadened compared to
the conventional specular geometry. The instrument response is estimated to FWHM ≈ 0.6°,
M
AN
US
CR
IP
T
AC
CE
PT
ED
2D-GIWAXS measurements were performed at the Stanford Synchrotron Radiation Lightsource
(SSRL), beamline 11-3, at an energy of 12.735 keV using a MAR2300 image plate detector for
recording. The incident angle was kept constant at ω = 0.12°. 2D-GIWAXS data are isotropically
converted to q-values and are further analyzed using the software WxDiff.[14]
Figure 1. Experimental setup for measuring (a) GIXRD and (b) GIWAXS. For both
measurements, the incident angle ω was kept constant.
3. Results and Discussion
3.1. Film structure
For our study, Ir(ppy)3 and Ir(ppy)2(acac) are doped into either a CBP or TCTA matrix. The
doping concentration is varied from 0 wt% (i.e. pure matrix) via 20 wt% and 50 wt% to 100 wt%
[image:8.595.68.510.175.658.2]M
AN
US
CR
IP
T
AC
CE
PT
ED
concentrations here since lower concentrations would diminish the relatively weak X-ray signal
too much. All thin-film samples are measured without encapsulation under ambient conditions.
Previous studies have shown that the molecular arrangement and, hence, X-ray measurements,
are not influenced by storage and measurement in air.[18]
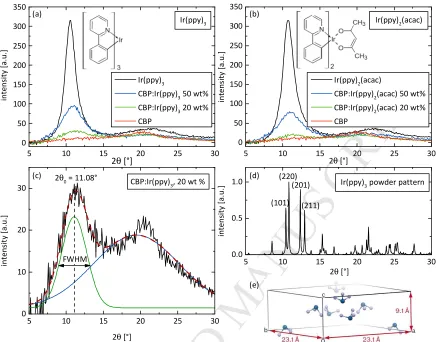
In the following, grazing incidence X-ray diffraction (GIXRD) measurements are discussed in
the out-of-plane direction, i.e. perpendicular to the substrate. Figure 2a and b show the results
for Ir(ppy)3 and Ir(ppy)2(acac) as pure films and when doped into CBP at different
concentrations. The pure emitter films show a distinct peak at around 11°, which indicates the
presences of crystallites. In addition, the weak shoulder at approximately 22° originating from
diffusely scattered radiation suggests the presence of additional amorphous regions in the film. In
contrast, the GIXRD spectra of pure CBP and TCTA only show the shoulder at 22°, indicating
that both matrix materials have an amorphous morphology. For films containing one of the
emitters doped into either of the two matrix materials, the diffraction peak at 11° decreases, but
remains visible down to a doping concentration of 20 wt%. This leads us to the conclusion that
Ir(ppy)3 and Ir(ppy)2(acac) form crystalline grains also when embedded into a matrix, at least
down to a concentration of 20 wt%. Since the concentrations of Ir(ppy)3 and Ir(ppy)2(acac) used
in OLEDs are typically around 8 wt%, we also tested TCTA films with 8 wt% of Ir(ppy)3 or
Ir(ppy)2(acac). However, we did not observe a diffraction peak for this low concentration. This
implies that at 8 wt% molecular aggregation is either reduced or that a lower amount and
possibly smaller size of crystallites means that their diffraction peak can no longer be resolved.
In reality, a combination of both effects is likely. In the absence of other options to study
aggregation with XRD, we therefore resorted to extrapolating results and drawing conclusions
M
AN
US
CR
IP
T
AC
CE
PT
ED
Figure 2. XRD measurements of thin films containing (a) Ir(ppy)3 and (b) Ir(ppy)2(acac) as a
guest doped into a CBP host matrix at different concentrations. (c) GIXRD spectrum of
CBP:Ir(ppy)3 at 20 wt% doping concentration (black line) together with a fit (red dashed line)
that is composed of two individual Gauss functions, one for the Bragg reflection (green line) and
one to approximate the amorphous halo (blue line). (d) Literature powder diffraction pattern of
Ir(ppy)3 with indication of the four main peaks. Figure drawn from data given in Ref. [19]. (e)
Packing diagram of Ir(ppy)3 showing the unit cell containing eight molecules. Molecules are
outlined by their iridium cores and the three nitrogen atoms. The spatial depth of the molecules
is indicated by decreasing color intensity.
5 10 15 20 25 30
0 50 100 150 200 250 300 350
2θ [°]
in te n si ty [ a .u .] (a)
Ir(ppy)3 (b) Ir(ppy)2(acac)
Ir(ppy)3
CBP:Ir(ppy)3 50 wt%
CBP:Ir(ppy)3 20 wt%
CBP
5 10 15 20 25 30
0.0 0.5
1.0 (d) Ir(ppy)3 powder pattern
in te n si ty [ a .u .]
2θ [°] (220)
(101) (201)
(211)
(e)
5 10 15 20 25 30
0 50 100 150 200 250 300 350 in te n si ty [ a .u .]
2θ [°] Ir(ppy)2(acac)
CBP:Ir(ppy)2(acac) 50 wt%
CBP:Ir(ppy)2(acac) 20 wt%
CBP
5 10 15 20 25 30
0 10 20 30 in te n si ty [ a .u .] (c)
2θ [°]
2θ0 = 11.08° CBP:Ir(ppy)
3, 20 wt %
[image:10.595.72.510.106.448.2]M
AN
US
CR
IP
T
AC
CE
PT
ED
According to Bragg's law, the diffraction angle θ is inversely proportional to the distance d of the
repeating structures:
= 2 , (1)
where λ is the wavelength of the X-rays and n is an integer. To extract the peak position and full
width at half maximum (FWHM) from the GIXRD data, all spectra are fitted with two Gauss
functions (see Figure 2c). This ensures that the 22° peak caused by diffusely scattered radiation
does not interfere with the position of the main peak. The results of all fits and the associated
errors are summarized in Table 1.
Table 1. Diffraction angle 2θ0 of the main X-ray reflex and coherence length Lc calculated from
the peak width via the Scherrer equation (Eq. (2)). Errors are calculated from the standard
deviation of the fits and the instrumental response.
material Ir(ppy)3 Ir(ppy)2(acac)
2θ0 [°] Lc [nm] 2θ0 [°] Lc [nm]
guest 100 wt% 10.60±0.10 4.38±0.26 10.82±0.10 3.81±0.21
TCTA:guest 50 wt% 10.75±0.10 2.07±0.07 10.99±0.12 1.43±0.05
TCTA:guest 20 wt% 10.95±0.12 1.49±0.06 12.40±0.14 1.24±0.06
CBP:guest 50 wt% 10.86±0.10 2.46±0.10 10.98±0.10 2.26±0.08
CBP:guest 20 wt% 11.08±0.11 2.22±0.12 11.17±0.12 2.09±0.13
Compared to the Ir(ppy)3 peak, which is located at (10.60 ± 0.10)°, the peak in Ir(ppy)2(acac) is
M
AN
US
CR
IP
T
AC
CE
PT
ED
also observe that the diffraction peak shifts to higher angles as the emitter concentration is
reduced, which implies that emitter aggregates become smaller with reducing concentration.
For comparison, Figure 2d shows the powder X-ray diffraction pattern of Ir(ppy)3 as reported in
the literature (data provided by Berger et al., Ref. [19], c.f. Cambridge Crystallographic
Database entry CCDC-747921). Two peaks are observed in the close vicinity of the thin-film
diffraction peak observed in our measurement. The smaller peak at 10.42° originates from
diffraction at the (101)-plane and the larger peak at 10.82°, which is also the most intense peak
of the powder spectrum, is associated with scattering at the (220)-plane. In an independent set of
measurements, Takayasu et al.[20] found the (220)-peak to be positioned at 10.72° which leads
them to assume a slightly larger crystallite size than Berger et al. (Both groups however conclude
that the space group of the Ir(ppy)3 crystallites is acentric tetragonal 42.) Although neither of
the two peaks from the powder spectrum fits exactly to the observed thin-film peak, it is likely
that the thin-film peak originates from reflection at the plane. This is because the
(220)-peak is the most intense (220)-peak in the powder spectrum, and also because for decreasing Ir(ppy)3
concentrations the position of the peak in the thin-film diffraction data agrees much better with
the (220)-peak from the powder data than with the (101)-peak. Figure 2e shows the crystal
packing of the Ir(ppy)3 unit cell, which contains eight molecules. The C3 symmetry axis of the
Ir(ppy)3 molecules and their large permanent dipole moment (magnitude, 6.4 D) lie
approximately parallel to the c axis of the unit cell, pointing in the direction of the nitrogen
atoms.[7] Within the crystal, groups of four molecules always form a tetramer. Every second
molecule has different chirality meaning that their permanent dipole moments oppose in
direction and will compensate in far-field.[19] It should be noted that Ir(ppy)3 is polymorphic,
M
AN
US
CR
IP
T
AC
CE
PT
ED
different from the crystal structure found for single crystals grown by slow evaporation from
solution.[21] The crystal structure for Ir(ppy)2(acac) has so far only been measured for crystals
grown from solution.[22,23] Given that our Ir(ppy)2(acac) films are vacuum sublimed and
considering the polymorphism observed for Ir(ppy)3 it therefore remains unclear where the
Ir(ppy)2(acac) thin-film diffraction peak, which occurs at a similar position as the Ir(ppy)3 peak,
originates from.
3.2. Molecular aggregation
Studies of the film morphology not only give valuable insight into molecular orientation but may
also provide insight into aggregation, which can enhance the rate of exciton annihilation and thus
typically increases the efficiency roll-off of OLEDs at high current densities.[24,25] In order to
compare the amount of molecular aggregation between the two emitters, the size of the
crystallite grains is approximated with the Scherrer equation, which correlates the FWHM ∆(2θ0)
of the diffraction peak (located at 2θ0) with the coherence length Lc:[15]
c =
cos((2 )/2)Δ(2 ).
(2)
Here, K denotes a shape factor that can be approximated as 1. The resulting coherence length is
4.4 nm and 3.8 nm for the 100 wt% samples of Ir(ppy)3 and Ir(ppy)2(acac), respectively (Table
1). The Lc value predicted by Eq. (2) decreases for films in which the emitter molecules are
embedded into a host. We note that our calculation yields the coherence length in the
out-of-plane direction and thus approximates the size of aggregates perpendicular to the substrate. The
M
AN
US
CR
IP
T
AC
CE
PT
ED
For all host-guest combinations studied here, Lc is higher for Ir(ppy)3 than for Ir(ppy)2(acac) and
higher for CBP than for TCTA as host. A longer coherence length correlates with larger
crystallite grains and therefore indicates that Ir(ppy)3 forms larger aggregates than Ir(ppy)2(acac),
as has been previously suggested by Reineke et al.[16]. However, the calculated coherence
length only gives a lower limit for the size of aggregates. For instance, a distortion of the
molecular arrangement due to cumulative disorder leads to small estimates of grain size although
a larger molecular arrangement is present.[15] In addition, only the crystallite components of the
materials can be considered while amorphous parts with possibly different structure and size are
neglected. Although doping concentrations were only investigated down to 20 wt%, aggregation
is likely to also be present for lower concentrations even though a (220)-Bragg reflection was not
observed for these.[26] Note that a diffraction peak can only be observed if the crystal structure
is preserved within aggregates, which requires at least one complete unit cell.
3.3. Molecular orientation
Up to now, we have only discussed scattering in out-of-plane direction as observed by GIXRD.
In order to learn more about the orientation of molecules on the substrate, we performed 2D
grazing incidence wide-angle X-ray scattering (2D-GIWAXS) measurements. Data for Ir(ppy)3-
and Ir(ppy)2(acac)-doped CBP films are shown in Figure 3 (again at doping concentrations of 0,
20, 50 and 100 wt%). Here, qz denotes the out-of-plane direction and qxy the in-plane direction.
M
AN
US
CR
IP
T
AC
CE
PT
ED
z=2
(sin + sin(2 − )).
(3
)
Figure 3. 2D-GIWAXS measurements on thin films of Ir(ppy)3 and Ir(ppy)2(acac) doped
into CBP at different concentrations. (a) plain Ir(ppy)3 film; (b) 50 wt% Ir(ppy)3 in CBP;
(c) 20 wt% Ir(ppy)3 in CBP; (d) plain Ir(ppy)2(acac) film; (e) 50 wt% Ir(ppy)2(acac) in
CBP; (e) 20 wt% Ir(ppy)2(acac) in CBP; (g) plain CBP film. Shown is a false color plot of
the scattering intensity as a function of the in-plane and out-of-plane scattering vectors qxy
and qz.
An isotropic orientation of the crystallites would appear as a ring in the 2D-measurements,
whereas spots indicate strong orientation.[15] For the pure Ir(ppy)3 and Ir(ppy)2(acac) films, an
intense spot-shaped peak is observed in out-of-plane direction at q = 0.75 Å−1 with further
intensity along a ring. The intensity of the peak decreases when Ir(ppy)3 and Ir(ppy)2(acac) are
doped into CBP. There is also a second broad halo ring at q = 1.5 Å−1. The diffraction patterns
are similar for Ir(ppy)3 and Ir(ppy)2(acac).
(a) Ir(ppy)3 (b) CBP:Ir(ppy)3, 50 wt % (c) CBP:Ir(ppy)3, 20 wt %
in-plane χ o u t-o f-p la n e
qxy[Å
-1]
qz
[Å
-1]
0 1 2
1 2
qxy[Å
-1]
0 1 2
1 2 4800 0 1600 1200 0 1200 0
qxy[ Å
-1]
0 1 2
1 2 900 600 300 800 400 3600 2400 1200
(e) CBP:Ir(ppy)2(acac), 50 wt %
qxy[Å-1]
0 1 2
1 2 1600 1200 0 800 400 (d) Ir(ppy)2(acac)
in-plane χ o u t-o f-p la n e
qxy[Å-1]
qz
[Å
-1]
0 1 2
1 2 4800 0 3600 2400 1200
(f) CBP:Ir(ppy)2(acac), 20 wt %
0
qxy[Å-1]
0 1 2
1 2 900 1200 600 300 (g) CBP
qxy[Å-1]
0 1 2
[image:15.595.84.509.102.381.2]M
AN
US
CR
IP
T
AC
CE
PT
ED
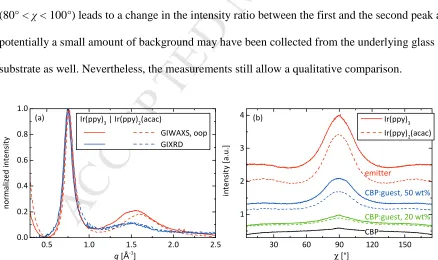
Before analyzing the 2D-GIWAXS data further, we compared the scatting in out-of-plane
direction against the results from the earlier GIXRD measurement. Figure 4a shows the
out-of-plane component of the 2D-GIWAXS signal for the pure Ir(ppy)3 and Ir(ppy)2(acac) films,
summed over the polar angle χ from 80° < χ < 100° and compares this data to the GIXRD
measurements. The 11° diffraction peak from the GIXRD measurement is clearly reproduced by
the peak and ring at q = 0.75 Å−1, showing that the main 2D-GIWAXS peak is associated with
(220)-scattering. The broad halo ring at q = 1.5 Å−1 is related to the second peak in GIXRD
measurements at around 22° confirming the presence of diffusely scattered radiation due to
amorphous regions in the film.[17] There are slight deviations in the width of the first peak
between the GIXRD and 2D-GIWAXS measurement and a more pronounced difference in the
intensity of the second peak. These deviations are mainly due to missing background information
for the 2D-GIWAXS data. Furthermore, the summation over a range of polar angles
(80° < χ < 100°) leads to a change in the intensity ratio between the first and the second peak and
potentially a small amount of background may have been collected from the underlying glass
substrate as well. Nevertheless, the measurements still allow a qualitative comparison.
Figure 4. (a) Comparison of the out-of-plane (oop)-component of the 2D-GIWAXS data,
calculated by summation over all χ between 80° and 100°, to the GIXRD-measurements. (b)
0.5 1.0 1.5 2.0 2.5
0.0 0.2 0.4 0.6 0.8 1.0 (b) Ir(ppy)
3 | Ir(ppy)2(acac)
GIWAXS, oop GIXRD n o rm a li ze d i n te n si ty
q [Å-1] (a)
30 60 90 120 150
1 2 3
4 Ir(ppy)
3
Ir(ppy)2(acac)
emitter
CBP:guest, 50 wt%
CBP:guest, 20 wt%
in te n si ty [ a .u .]
[image:16.595.71.509.420.680.2]M
AN
US
CR
IP
T
AC
CE
PT
ED
Intensity of the ‘inner ring’ of 2D-GIWAXS data for the films shown in Fig. 2 as a function of the
angle χ, intensity summed over 0.6 Å-1≤ q ≤ 1.0 Å-1.
Next, we investigated the change in the scattering intensity at q = 0.75 Å−1 with polar angle.
Figure 4b shows the scattering signal for all films as a function of the polar angle χ, summed
over all q from 0.6 Å−1 to 1.0 Å−1. For the pure Ir(ppy)3 film there is a pronounced peak in
out-of-plane direction (χ = 90°, FWHM ≈ 30°), which indicates that the Ir(ppy)3 crystallites are
preferentially oriented with their (220)-plane in out-of-plane direction. A similar behavior is
found for the Ir(ppy)2(acac) film. For films of Ir(ppy)3 and Ir(ppy)2(acac) doped into CBP the
overall intensity is significantly reduced, but the FWHM of roughly 30° is preserved suggesting
that the preferential orientation is retained. For the pure Ir(ppy)3 and Ir(ppy)2(acac) films, there is
also a slight increase in intensity in in-plane direction (χ = 90°), which may indicate that a
fraction of the crystallites is rotated by approximately 90°. The trend vanishes for lower emitter
concentrations and is not present in the pure CBP film.
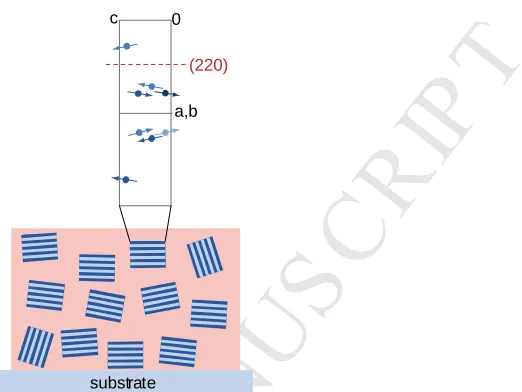
4. Conclusions
The 2D-GIWAXS measurements show that, although the degree of order is relatively low and
the crystallite size is small, there is a preferential orientation of both Ir(ppy)3 and Ir(ppy)2(acac)
in thin vacuum sublimed films. For Ir(ppy)3, we found that crystallites are predominantly
oriented with the (220)-plane parallel to the substrate. Hence, one can conclude that the
symmetry axis of the Ir(ppy)3 molecules is roughly parallel to the substrate as illustrated in
Figure 5. This orientation is preserved when doping Ir(ppy)3 into a matrix, at least for the
M
AN
US
CR
IP
T
AC
CE
PT
ED
due to its unknown crystal structure the exact molecular orientation with respect to the substrate
cannot be determined at this stage.
Figure 5. Schematic illustration of the orientation of Ir(ppy)3 crystallites embedded in a matrix.
The top part of the sketch shows the crystal structure of the Ir(ppy)3 unit cell with the
(220)-plane parallel to the substrate. The symmetry axis of the Ir(ppy)3 molecule and its permanent
dipole moment, which both point along the direction of the blue arrows, are oriented roughly
in-plane. The spatial depth of the molecules is indicated by decreasing color intensity. A small
fraction of the crystallites sketched in the lower part of the illustration is turned by
approximately 90° with respect to the majority of the crystallites.
Very recently, Lee et al. performed molecular density (MD) simulations of CBP films
comprising Ir(ppy)3 and Ir(ppy)2(acac) as emitters, respectively.[28] For both emitters they found
a preferential orientation of the emitter symmetry axis with respect to the substrate. In contrast to
our experimental findings, however, the symmetry axes of Ir(ppy)3 molecules were aligned
preferentially perpendicular to the substrate. A similar set of MD simulations on the same
host-guest system that was very recently performed by Moon et al. revealed no preferential (220)
0
a,b c
[image:18.595.235.496.167.363.2]M
AN
US
CR
IP
T
AC
CE
PT
ED
orientation.[29] Both sets of MD simulations do not take aggregation of emitter molecules into
account but this is likely to be a relevant factor for the orientation observed in experiments.
Our measurements reveal that molecular orientation is particularly pronounced for pure films of
the emitter molecules and it seems to be an intrinsic property of the material growth during
thermal evaporation. The observation that the crystallites and permanent dipoles of both iridium
complexes investigated here are oriented in thin evaporated films is particularly significant given
that transition dipole moments only show a preferential orientation for Ir(ppy)2(acac) but were
found to be isotropic for Ir(ppy)3.[3] Quantum chemical calculations can give an indication as to
how the transition dipoles are oriented with respect to the symmetry axis of the molecule, even
though it is not yet clear if this yields reliable results and to which extend the environment
influences the orientation of the transition dipole vector.[28] Using this approach, Moon et al.
recently found that the transition dipole moments of the three triplet sublevels of Ir(ppy)3 point
from the iridium core to the three ligands and are mutually orthogonal.[30] Hence, the three
transition dipoles cancel each other, which leads to the isotropic dipole orientation that was
previously observed in OLEDs.
For Ir(ppy)2(acac), instead, the two transition dipole vectors point towards the phenylpyridine
ligands and, thus, lie roughly in the same plane, perpendicular to the symmetry axis.[23,28]
Together with the orientation of Ir(ppy)2(acac) molecules on the substrate that we found in our
2D-GIWAXS study, this would explain the observed preferential horizontal orientation of the
transition dipole moment in OLEDs.
In conclusion, we found that both Ir(ppy)3 and Ir(ppy)2(acac) form crystalline grains which
M
AN
US
CR
IP
T
AC
CE
PT
ED
aggregates of emitter molecules are formed, which retain the molecular orientation. Hence, the
emitter orientation seems to be an intrinsic property of the film formation process.
ACKNOWLEDGMENT
We thank Dr. Lutz Wilde at Fraunhofer IPMS, Center Nanoelectronic Technologies, Dresden,
for carrying out the GIXRD measurements and Dr. Philipp Liehm and Prof. Stefan C. B.
Mannsfeld for fruitful discussions. This work received funding from the European Community
Seventh Framework Programme under Grant Agreement No. FP7 267995 (NUDEV) and from
the European Social Fund and the Free State of Saxony through the OrganoMechanics project.
CM acknowledges funding from the Graduate Academy of the TU Dresden and by the European
Commission through a Marie Skłodowska-Curie Individual Fellowship (703387).
DATA AVAILABILITY
The research data supporting this publication can be accessed at
http://dx.doi.org/10.17630/2dc12142-818e-4c40-8ae8-6ef03a75e49f.
REFERENCES
[1] T.D. Schmidt, D.S. Setz, M. Flämmich, J. Frischeisen, D. Michaelis, B.C. Krummacher,
N. Danz, W. Brütting, Evidence for non-isotropic emitter orientation in a red
phosphorescent organic light-emitting diode and its implications for determining the
emitter’s radiative quantum efficiency, Appl. Phys. Lett. 99 (2011) 163302.
doi:10.1063/1.3653475.
[2] M. Flämmich, J. Frischeisen, D.S. Setz, D. Michaelis, B.C. Krummacher, T.D. Schmidt,
M
AN
US
CR
IP
T
AC
CE
PT
ED
Electron. 12 (2011) 1663–1668. doi:10.1016/j.orgel.2011.06.011.
[3] P. Liehm, C. Murawski, M. Furno, B. Lüssem, K. Leo, M.C. Gather, Comparing the
emissive dipole orientation of two similar phosphorescent green emitter molecules in
highly efficient organic light-emitting diodes, Appl. Phys. Lett. 101 (2012) 253304.
doi:10.1063/1.4773188.
[4] D. Yokoyama, Molecular orientation in small-molecule organic light-emitting diodes, J.
Mater. Chem. 21 (2011) 19187. doi:10.1039/c1jm13417e.
[5] M.C. Gather, S. Reineke, Recent advances in light outcoupling from white organic
light-emitting diodes, J. Photonics Energy. 5 (2015) 57607. doi:10.1117/1.JPE.5.057607.
[6] K.-H. Kim, S. Lee, C.-K. Moon, S.-Y. Kim, Y.-S. Park, J.-H. Lee, J.W. Lee, J. Huh, Y.
You, J.-J. Kim, Phosphorescent dye-based supramolecules for high-efficiency organic
light-emitting diodes, Nat. Commun. 5 (2014) 4769. doi:10.1038/ncomms5769.
[7] A. Graf, P. Liehm, C. Murawski, S. Hofmann, K. Leo, M.C. Gather, Correlating the
transition dipole moment orientation of phosphorescent emitter molecules in OLEDs with
basic material properties, J. Mater. Chem. C. 2 (2014) 10298. doi:10.1039/C4TC00997E.
[8] M.J. Jurow, C. Mayr, T.D. Schmidt, T. Lampe, P.I. Djurovich, W. Brütting, M.E.
Thompson, Understanding and predicting the orientation of heteroleptic phosphors in
organic light-emitting materials, Nat. Mater. 15 (2015) 85–91. doi:10.1038/nmat4428.
[9] M. Flämmich, M.C. Gather, N. Danz, D. Michaelis, A.H. Bräuer, K. Meerholz, A.
Tünnermann, Orientation of emissive dipoles in OLEDs: Quantitative in situ analysis,
Org. Electron. 11 (2010) 1039–1046. doi:10.1016/j.orgel.2010.03.002.
[10] J. Frischeisen, D. Yokoyama, C. Adachi, W. Brütting, Determination of molecular dipole
M
AN
US
CR
IP
T
AC
CE
PT
ED
Appl. Phys. Lett. 96 (2010) 73302. doi:10.1063/1.3309705.
[11] R. Mac Ciarnain, D. Michaelis, T. Wehlus, A.F. Rausch, S. Wehrmeister, T.D. Schmidt,
W. Brütting, N. Danz, A. Bräuer, A. Tünnermann, Plasmonic Purcell effect reveals
obliquely ordered phosphorescent emitters in Organic LEDs, Sci. Rep. 7 (2017) 1826.
doi:10.1038/s41598-017-01701-8.
[12] K.-H. Kim, J.-L. Liao, S.W. Lee, B. Sim, C.-K. Moon, G.-H. Lee, H.J. Kim, Y. Chi, J.-J.
Kim, Crystal Organic Light-Emitting Diodes with Perfectly Oriented Non-Doped
Pt-Based Emitting Layer, Adv. Mater. 28 (2016) 2526–2532. doi:10.1002/adma.201504451.
[13] L. Li, Q. Tang, H. Li, X. Yang, W. Hu, Y. Song, Z. Shuai, W. Xu, Y. Liu, D. Zhu, An
ultra closely pi-stacked organic semiconductor for high performance field-effect
transistors, Adv. Mater. 19 (2007) 2613. doi:10.1002/adma.200700682.
[14] S.C.B. Mannsfeld, M.L. Tang, Z. Bao, Thin film structure of
triisopropylsilylethynyl-functionalized pentacene and tetraceno[2,3-b]thiophene from grazing incidence x-ray
diffraction, Adv. Mater. 23 (2011) 127. doi:10.1002/adma.201003135.
[15] J. Rivnay, S.C.B. Mannsfeld, C.E. Miller, A. Salleo, M.F. Toney, Quantitative
Determination of Organic Semiconductor Microstructure from the Molecular to Device
Scale, Chem. Rev. 112 (2012) 5488–5519. doi:10.1021/cr3001109.
[16] S. Reineke, T.C. Rosenow, B. Lüssem, K. Leo, Improved High-Brightness Efficiency of
Phosphorescent Organic LEDs Comprising Emitter Molecules with Small Permanent
Dipole Moments., Adv. Mater. 22 (2010) 3189. doi:10.1002/adma.201000529.
[17] C. Elschner, A.A. Levin, L. Wilde, J. Grenzer, C. Schroer, K. Leo, M. Riede, Determining
the C60 molecular arrangement in thin films by means of X-ray diffraction, J. Appl.
M
AN
US
CR
IP
T
AC
CE
PT
ED
[18] C. Elschner, Structural Investigations of Disordered Organic Thin Films, Technische
Universität Dresden, 2013. http://d-nb.info/1037923774.
[19] R.J.F. Berger, H.G. Stammler, B. Neumann, N.W. Mitzel, Fac-Ir(ppy)3: Structures in the
gas-phase and of a new solid modification, Eur. J. Inorg. Chem. 2010 (2010) 1613–1617.
doi:10.1002/ejic.201000125.
[20] S. Takayasu, T. Suzuki, K. Shinozaki, Intermolecular interactions and aggregation of
fac-tris(2-phenylpyridinato-C2,N)iridium(III) in nonpolar solvents., J. Phys. Chem. B. 117
(2013) 9449–56. doi:10.1021/jp403974h.
[21] J. Breu, P. Stössel, S. Schrader, A. Starukhin, W.J. Finkenzeller, H. Yersin, Crystal
Structure of fac − Ir(ppy)3 and Emission Properties under Ambient Conditions and at
High Pressure, Chem. Mater. 17 (2005) 1745–1752. doi:10.1021/cm0486767.
[22] S. Lamansky, P. Djurovich, D. Murphy, F. Abdel-Razzaq, R. Kwong, I. Tsyba, M. Bortz,
B. Mui, R. Bau, M.E. Thompson, Synthesis and Characterization of Phosphorescent
Cyclometalated Iridium Complexes, Inorg. Chem. 40 (2001) 1704–1711.
doi:10.1021/ic0008969.
[23] J. Frey, B.F.E. Curchod, R. Scopelliti, I. Tavernelli, U. Rothlisberger, M.K. Nazeeruddin,
E. Baranoff, Structure-property relationships based on Hammett constants in
cyclometalated iridium(iii) complexes: their application to the design of a fluorine-free
FIrPic-like emitter., Dalt. Trans. 43 (2014) 5667–79. doi:10.1039/c3dt52739e.
[24] S. Reineke, G. Schwartz, K. Walzer, M. Falke, K. Leo, Highly phosphorescent organic
mixed films: The effect of aggregation on triplet-triplet annihilation, Appl. Phys. Lett. 94
(2009) 163305. doi:10.1063/1.3123815.
M
AN
US
CR
IP
T
AC
CE
PT
ED
Diodes, Adv. Mater. 25 (2013) 6801. doi:10.1002/adma.201301603.
[26] C. Murawski, C. Elschner, S. Lenk, S. Reineke, M.C. Gather, Orientation of OLED
Emitter Molecules Revealed by XRD, in: Light. Energy Environ., OSA, Washington,
D.C., 2016: p. SSW2D.7. doi:10.1364/SSL.2016.SSW2D.7.
[27] U. Pietsch, V. Holý, T. Baumbach, High-Resolution X-Ray Scattering, Springer-Verlag
New York, 2004.
[28] T. Lee, B. Caron, M. Stroet, D.M. Huang, P.L. Burn, A.E. Mark, The molecular origin of
anisotropic emission in an organic light-emitting diode, Nano Lett. (2017).
doi:10.1021/acs.nanolett.7b03528.
[29] C. Moon, J. Kim, K.-H. Kim, Unraveling the origin of the orientation of Ir complexes
doped in organic semiconducting layers, in: F. So, C. Adachi, J.-J. Kim (Eds.), Proc.
SPIE, SPIE, 2017: p. 1036213. doi:10.1117/12.2273505.
[30] C.-K. Moon, K.-H. Kim, J.W. Lee, J.-J. Kim, Influence of Host Molecules on Emitting
Dipole Orientation of Phosphorescent Iridium Complexes, Chem. Mater. 27 (2015) 2767–
2769. doi:10.1021/acs.chemmater.5b00469.
TABLE OF CONTENTS GRAPHIC
substrate
in-plane χ
o
u
t-o
f-p
la
n
e
q
xy[Å -1]
0 1 2
1 2
4800
0 3600
2400
1200
q z
[Å
M
AN
US
CR
IP
T
AC
CE
PT
ED
• Grains show a preferred orientation on the substrate.
• Ir(ppy)3 molecules orient roughly parallel to the substrate.