1
Image analysis and modelling of the orientation of pores in a constrained
film on a rigid substrate
By C.S. Ni & John T.S. Irvine*
Corresponding author: email [email protected]
School of Chemistry, University of St Andrews, Fife KY16 9ST, Scotland
Abstract
The nature of porosity in functional materials is often a critical parameter in
determining their functionality e.g. in structure materials and fuel cell electrodes. Here
we study the development of the anisotropy of porous yttria-stabilized zirconia (YSZ),
focusing particularly upon the contribution of pore orientation to this anisotropy.
Simulation from when the ink is deposited on the surface of a rigid substrate shows
that plate-like pores are found tend to align along the transverse direction of the
substrate. Cross-sectional image analysis of the pores from the attendant pores of YSZ
particles or pore forming agent (PFA) matches with the simulated modelling when
materials transport is insignificant in determining the shape of pores. The anisotropy
created in the densification stage is separated from that in the green body by analysing
the image of porous structures formed with spherical glassy carbon which is unable to
contribute to anisotropy during green state processing.
Keywords: constrained sintering, texturing, YSZ, porous ceramic.
2
Porous ceramics are of significant interest in many fields due to their wide range of
applications in energy-conversion and piezoelectric materials, biomaterials, catalyst
supports and infiltration membranes1. Among the methods used to prepare porous
ceramics, screen printing is a low-cost method that is scalable and well-suited for the
fabrication of thick film (10 - 50 m) on rigid substrate. For example, pre-sintered
porous YSZ scaffold via screen printing can be infiltrated with conductive perovskite
to prepare highly active electrodes for solid oxide fuel cell2 , 3. The addition of
pyrolyzable pore former is a simpler but more effective way of producing pores in
ceramic sintered at high sintering temperature for better connectivity and/or bridging
between the components, compared to the alternative partial-sintering method.
Graphite is a popular choice as pore forming agent (PFA) because of the vast
availability and compatibility with the organic solvent, but its two-dimensional shape
causes the anisotropy of the ceramics.
The preferred orientation (or texturing) is of great interest because it is common in
ceramics and has significant influence on physical properties such as strength4, mass
transport5,6, electrical conductivity7, and optical property8,9. To be specific, the shape
and array of pores in the electrode of a solid oxide fuel cell dictates the tortuosity of
the gas permeation5 and the distribution of the infiltrated phases10,11. However, the
cause of anisotropy of the pores comes from two major sources which tend to cause
orientations in perpendicular directions to each other. The non-uniform packing
density of a green body prepared by tape casting and the anisotropy from the particles
are thought to be important directors for the orientation12,13,14,15,16. For a green body
fabricated using screen printing or tape casting, the particle rearrangement by
capillary forces takes place when the solvent evaporates and the surface of slurry
3
direction more aligned to the in-plane direction. On the other hand, in the case of a
screen printed film where no in-plane shrinkage is allowed in a continuum system, the
orientation can also arise from the constrained sintering process of a screen-printed
layer for dense ceramic; the pores align along the direction perpendicular to the film
plane17,18 owing to the uneven materials transport between the in-plane direction and
its perpendicular direction. The anisotropy from the two sources is perpendicular to
each other and causes the final texturing in the ceramic to be difficult to predict. As a
result, a balance of the two reasons for anisotropy should be considered in the very
screen printed porous ceramic on a rigid substrate.
In this work, image analysis and modelling based on the continuum assumption of the
green body or ceramic film were used to study the microstructure orientations at
different stages starting from the application of inks to the final sintered ceramic. Inks
with graphite (plate-like in shape) or glassy carbon (spherical in shape) were used to
detect the orientation evolution at different stages of sintering. Moreover, the
two-dimensional images of anisotropic pores with varied pore size distributions were
generated to study the relationship between the pores of two scales: small interstitial
pores among ceramic particulates (~0.1 m) to large pore former (~1 m).
Experimental
Materials
Two types of 8 mol.% Y2O3-stabilised ZrO2 (8-YSZ) were used in the ink making
process, Unitec 8-YSZ 1-um and 2-um powder (denoted as Unitec 1-um and 2-um
powder) both from UCM Advanced Ceramics GmbH, Laufenburg, Germany. The
4
Mastersizer 2000 particle size analyzer (Malvern Instruments LTD, Malvern, UK)
after ball milling in an isopropanol solution containing 2 wt.% triton as surfactant for
24 h to simulate the de-agglomeration process during ink-making. The size
distributions are shown in Figure 1 (a), and are consistent with the SEM images
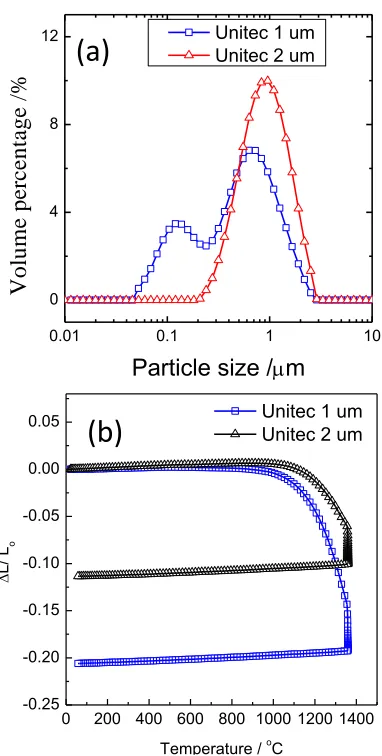
(Figure S1), i.e. the Unitec 1-um powder contains finer particles. The PSA data of
2-um powder show only one peak at ~1 m, while those of 1-um powder exhibit two
peaks at 0.1 m and 0.8 m. A pellet of 13 mm in diameter and 1 mm in thickness
was obtained by pressing the powder under a uniaxial pressure of 149 MP and then its
sinterability was measured via a dilatometer (DIL 402C, NETZSCH GmbH & Co.
Holding KG, Germany) with a heating rate of 3 oC/min up to 1350 oC, as shown in
Figure 1 (b). Results show that the Unitec 1-um powder started to sinter at 950 oC and
the other would not sinter until the temperature reaches 1100 oC. The shrinkage of the
pellets from Unitec 1-um powder is twice that from Unitec 2-um powder after
dwelling for 3 h.
Sample preparation and image analysis
In the ink-making process, Hypermer KD-1 (Croda Inc. East Yorkshire, UK) was
used as dispersant, and terpineol containing 5 wt. % Butvar Polyvinyl Butyral (PVB)
as a vehicle. The pore former is graphite (325 mesh, Alfa Aesar, Lancashire, UK) or
glassy carbon (Alfa Aesar, Lancashire, UK). The graphite is composed of aggregated
plates with varied dimensions while the glassy-carbon particles are 10-20 m spheres.
A mixed powder containing the YSZ powder, and PFA (if any) was ball milled at
160 rpm for 24 h in a plastic bottle containing 36 1-cm diameter zirconia balls using
acetone as solvent. Then the contents, except zirconia balls, were transferred to a
5
stirring, resulting in a well-dispersed viscous ink. The recipes of the inks with or
without PFAs are shown in table 1. The amount of PFAs is controlled to be small in
order to avoid their possible interaction.
3.7 g 8-YSZ (HSY-8, DKKK, Osaka, Japan) powder was uniaxially pressed at a static
pressure of 150 MPa and sintered at 1500 oC for 10 h to result in a dense pellet of
2-mm thickness and 2 cm in diameter. The screen printing process was performed using
a computer-controlled machine (248 Dek Printing Machines, Shenzhen, China) and a
325-mesh screen and 2-mm printing gap were used for the thick layers. The squeegee
was under a load of 60 kN and moves at a speed of 35 mm/min. The viscosities
(Figure S2.) of the inks were measured with a programmable rheometer (Brookfield
DV-III ultra, Middleboro, MA), and were quite similar to each other. The
screen-printed pellets with inks 1, 2 and 4 were then sintered at 1320 oC for three hours using
a heating ramp of 1 oC/min before 1000 oC and 3 oC/min afterwards with a cooling
ramp of 3 oC/min. The pellet with ink 3 was sintered at 1100 oC for 3 hours with a
heating ramp of 1 oC/min and cooling rate of 1 oC/min. The sintered samples were
vacuum mounted in an epoxy, cut with a diamond saw and polished to 1-m diamond
polishing paste. The backscattered-electron images were taken on a Jeol 6700F to
give highly contrasting images which were binarized by choose a threshold to
separate the pores and ceramics and analyzed with ImageJ software (National Institute
of Health, Bethesda, MD). The choice of threshold is verified with the porosity from
the measurement of weight and thickness. The evaluation of particle orientation was
accomplished by circumscribing a best-fit ellipse to every single particle, as
demonstrated in reference 12. The angles of the particles are converted into the range
6
without PFA or with PFA respectively were not taken into account due to the
difference in magnification of the images.
Modelling of the rearrangement of PFA/pore
The sintering properties of a ceramic are, to some extent, dependent on the local
interaction between the particles and macroscopic properties (>1 m)19. The use of
continuum mechanics, which has been successfully applied to the analysis of
compaction of porous bodies, is extended to the whole process starting from the point
when the slurry is deposited on the rigid substrate, as demonstrated in Figure 2. L0 is
the thickness of the inks on the surface of the substrate (initial state) and L1 is the
thickness when the sintering is about to start after the drying process and burning off
the organics and pore former. After the sintering at the final temperature, the
thickness of the film becomes L2. In the whole process, a plate-like graphite/attendant
pore is going to rotate and align toward the surface of the substrate as shown in the
magnified area in Figure 2, where a continuum of the system is assumed. Because the
ink will be confined in the compartment of the screen, and the squeegee and mesh will
confine the move of liquid in the depositing process, and therefore the effect of
Marangoni convection could be diminished in screen printing. X-axis is the reference
axis for the angle of particles. The plate-like graphite burns off at a temperature below
900 oC to produce pores of the same shape, so the plate-like pore former is assumed to
be interchangeable with the pores in the modelling process. The interaction among
pore formers is also neglected since the amount of PFA is small. Because of the rigid
substrate, the reaction or shrinkage in the in-plan direction is negligible and the
7
1=arctan(Lf/L0*tan(0)) (1)
where Lf is the thickness of the film in the range of [L0, L1]; 0 and 1 represent the
angle of the graphite and pore in relation with the x axis. The shrinkage of film, , is
determined by equation:
= 1- Lf/L0 (2)
Specifically, the shrinkage in stage I, and the shrinkage at stage II, are defined as
= 1- L1/L0 (3)
1- L2/L1 (4)
It should be noted that before the removal of graphite, the length of graphite that is
represented by the cross-section of plate-like graphite on the plane of interest varies
with the rotation process in the modeling, but this is more applicable to the situation
of pores after the burning of PFA.
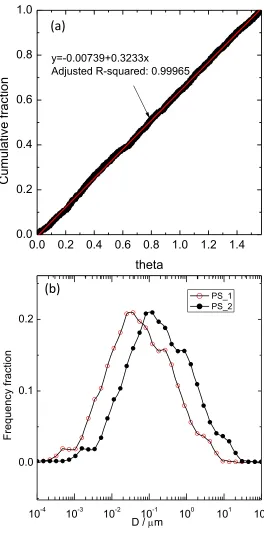
One thousand graphite particles of normalized length distribution were randomly
generated on a 50 m by 50 m area. The linear angle distribution, Figure 3 (a),
indicates a random distribution of the pore former in the initial stage, suggesting that
1000 pore formers/pores are sufficient to represent a random system. The pore size
distribution of two sets of pore formers / pores is indicated in Figure 3 (b), denoted as
PS_1 and PS_2. The pore sizes cover about 5 decades. The anisotropic image is
intensified as increase from 0 to 0.9 in the slurry based system. Patwardhan20
low-8
solid-loading slurry produces more intense anisotropy, and this could be understood
by a smaller value for a film with less solvent. Actually, this model also indicates
that a looser-packing system is more prone to produce anisotropy given the same final
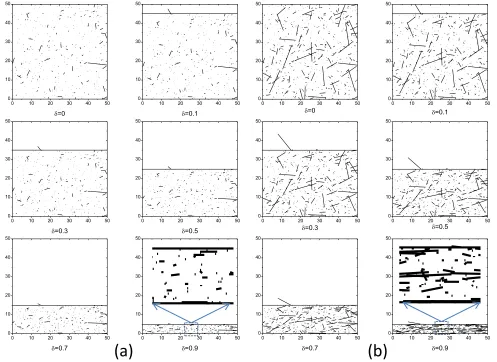
density, similar to the study of Zainuddin21. In this study, the image of the film at
different shrinkages, , is shown in Figure 4, where the length of each particle in (a) is
elongated by a factor of 5, as shown in (b). The image was then compressed to
simulate the drying process and constrained sintering in the y-axis without
considering the variation of pores by transport process. A tape-cast film with coarser
powders is found to be more orientated than that with finer powders of similar
geometry23. The image simulation indicates that only the large pores are obvious in
the image. The comparison of these two images also suggests that image analysis at
an inappropriate magnification is misleading sometimes because of the capacity of the
information in the images.
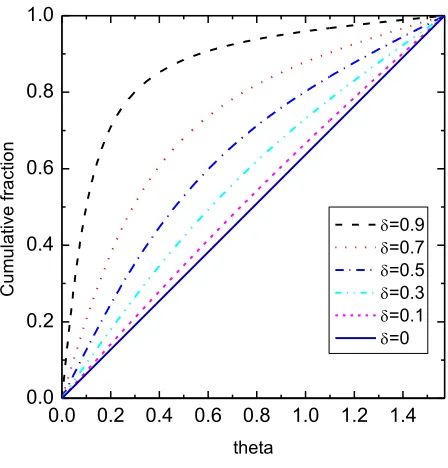
The cumulative percentage of orientation profile at different stage of sintering is
showing in Figure 5 if equation 1 is used to predict the angle change from a random
distribution system. The cumulative probability equation is
=(2/)arctan((1-)-1tan()) (5)
where is the cumulative probability of the particles with an angle of .
The percentage of the particles within /4 is used to index the anisotropy of the
film22 , 23, even though Guillon et al. 17, 24 and Mucke et al. 25 proposed different
parameters to indicate the pore orientation. For instance, when is 0.9, 90 % of the
9
during the sintering process, the shrinkage of the stage II, , couple with the shrinkage
in stage I, is used to predict the orientation and the result can be represented in the
formula:
=(2/)arctan((1-)-1(1-)-1tan()) (6)
When equals zero, the orientation of particles is governed totally by the sintering
process. The one dimensional shrinkage value is different from the parameter
measured from the dilatometery data because the constrained densification is greatly
retarded compared to free sintering26,27. However, if there is a massive transport of
materials between the ceramic particles, the orientation profile will deviate
completely from the prediction above as analyzed below.
Results and discussion
Image analysis of the anisotropy from sintering of the film without PFA
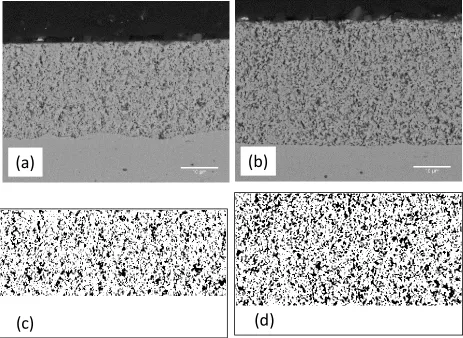
The cross-sectional images of the two films from Unitec 1-um and 2-um powder are
shown in Figure 6 (a) and (b) and the corresponding binary images of the film are
shown accordingly in (c) and (d). The average thickness of film from Unitec 1-um
and 2-um is to be 24.9 m and 31.5 m, respectively, by analyzing five images at this
magnification. Images at higher-magnification images (Figure S3) are analyzed for
the porosities of films, and the average porosities from five images are 29 % and 40 %
for the film from 1 um and 2 um powder, respectively. We also used the weight of the
porous structure and the thickness to calculate the density, and the porosities are 28%
10
from image analysis. Based on the conservation of mass of the ceramic in the porous
structure and ink, the thickness of wet ink containing vehicle L0 can be calculated:
L0=Lf(1-)/Vc (7)
is the porosity of the film and Vc is the volume fraction of the ceramic in the ink.
Because the organics and PFA would be burn off below 45028 and 900 oC 29,
respectively, this equation is valid at temperature above 450 and 900 oC for the
sample without and with PFA.
In combination with equation 2, equation 7 gives
= 1- Vc/(1-) (8)
If the Vc value for the ink in table 1 is used, the shrinkage of ink with Unitec 1-um and
2-um should be 0.58 and 0.50, respectively, if the porosity from image analysis is
used. The cumulative percentage of the diameter and angle of the pores are presented
in Figure 7 (a) and (b). The pore size covers less than two decades, peaking at 0.25
m and 0.32 m for the ink with Unitec 1-um and 2-um powder, respectively, in the
same order of the grain size measured by PSA, though the 2-D image analysis cannot
represent the 3-D pore size very precisely. The asymmetry and narrow range of pore
size distribution comparing to the simulation may be explained by the cut-off length
of particles for counting or the sintering process that causes the disappearance of finer
pores18. If the anisotropy of the ceramic powders and their attendant pores are rotating
with the contraction of the films, the anisotropy of the pores should follow equation 5.
However, the percentage of the particles with /4 is less than 50% meaning the
11
Figure 5, considering the value. Unitec 1-um powder tends to produce a more
orientated microstructure with lower porosity then Unitec 2-um powder does, in
agreement with the dilatometry curves, therefore we can conclude that the anisotropy
is intensified by the degree of sintering that can be determined from the dilatometry.
This trend coincides with the experimental result of Guillon et al.17 but contradicts
that of Wang et al.18. According to the simulation of Wang et al.18 and Cannon et
al.30,31, the anisotropy caused by the faster in-plane grain diffusion with respect to
grain boundary causes the spheroidization of the pores; anisotropy was found to
increase then decrease along with the densification process30. The ultra-fine powder in
the bi-model Unitec 1-um powder is beneficial in promoting the grain boundary
diffusion in the sintering process, which explains the higher degree of anisotropy of
the film from Unitec 1-um powder. The diffusion of the materials through the grain
boundary in the densification process has significant influence on the pore shape in
the attendant pores, but the possible initial in-plane anisotropy cannot be excluded.
Image analysis of the constrained film with plate-like pore former.
Although the anisotropy is affected by the substrate and densification process,
in-plane anisotropy of BaLa4Ti4O15 without PFA at the initial stage of sintering was also
reported32. To study the anisotropy in stage I immediately after the densification
process even started the ink with pore former (ink 3) was fired at 1100 oC when is
equal to , and the cross-sectional image is shown in Figure 8 (a). The microstructure
could be considered as the initial sintering stage, given the dilatometry data provided
in Figure 1 (b). This image is dominated by long pores aligning along the x-axis,
similar to the image in Figure 4, but more information about the pore size and
12
procured by choosing a threshold to separate the pores and ceramics, as shown in
Figure 8 (b), with a porosity of 56.4%. The despeckling was used to delete the very
fine pores (area < 0.6 m2) and a white line to separate some of the overlapping large
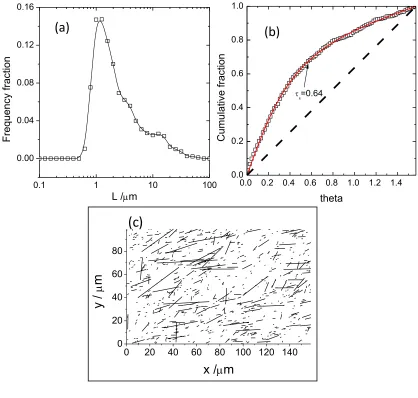
pores manually for better analysis (Figure 8 (c))23. The Feret diameter was employed
to evaluate the length of these extremely elongated pores and the discrete frequency
profile is plotted in Figure 9 (a). The pore size is peaking at 1.18 m, and contains a
significant fraction of pores around 10 m. Although the comparison of the
distribution in Figure 7(a) and Figure 9 (a) shows an overlap in the range of 0.5-2 m,
but the attendant pores of the ceramic powder at 1100 oC should be much smaller than
those at 1300 oC due to the diminishing of fine pores and growth of big pores. The
profile of the distribution and the best-fitting curve with a parameter s=0.64 is shown
in Figure 9 (b). The value and was calculated to be c=0.66 in equation 8 using the
measured porosity and Vc in table 1. The good match between s and the calculated c
indicates that the orientation profile is independent of the pore size distribution for the
larger pores. An image with a value of 0.66 is provided using the same length
profile of pores shown in Figure 9 (c). We can see that Figure 9(c) is quite similar to
Figure 8 (c) in the anisotropy. The direct observation of the attendant pores at the
starting temperature of sintering may be one way to detect the anisotropy at stage I,
but the poor mechanical property and small size of the pores makes the result
unreliable and difficult to analyze.
Image analysis of the constrained film with spherical pore former
Figure 10(a) shows the image from the ink with glassy carbon (ink 4) fired at 1100 oC
13
pore contains an inner shell separated from the porous YSZ matrix and this could be
explained by the contraction of the glassy carbon coated with YSZ powder in the
heating process33. However, after sintered at 1320 oC, the pores from glassy carbon
compressed in y-axis direction to form ellipses as shown in Figure 10 (b), in contrast
to pores from spherical particles in a free sintering system where no anisotropy was
observed34,35. Albano et al.33 found a good match between the shape of pore former in
the green tape of tape casting and that of pores formed after being freely sintered.
Because glassy carbon particles are spherical, the rotation in stage I does not exert any
orientation in the green body of the film in stage I at the length scale of glassy carbon,
ie, the anisotropy is attributed totally to the constrained sintering process. Due to the
large length scale of pores from glassy carbon particles, the anisotropy from the
diffusion is negligible in determining the shape of glassy carbon. Figure 11 shows the
ratio of the Feret length of the pores in y axis direction in comparison to that in x axis,
denoted as Ry/x. The pores in contact with the edge of the image are not included
either. Most of the pores can be chosen to indicate the shrinkage because a continuous
film of certain thickness is uniformly stressed except for those on the edge of the film
where the pores show better densification36. We can observe the scattering of the Ry/x
values, indicating that some pores are not suited for demonstrating the anisotropy in
this stage than the others. The overlapping between pores, the crack that appeared at
high temperature sintering and the tilting owing to the unbalance force around each
pore will affect the image analysis process. For film sintered at 1100 oC, the Feret
lengths in x and y direction of the pores are similar to each other, since Ry/x is equal
to 1.04. The Ry/x is only 0.69 for the pores sintered at 1320 oC, indicating that the
sintering from 1100 oC to 1320 oC causes a shrinkage of 0.31 in y direction, i.e,
14
shrinkage value of 11.6 % in a 3-D shrinkage, which is slightly lower than the
shrinkage measured from dilatometry at 1320 oC, ca. 15 %. For a system containing
plate-like pores sintered at elevated temperature to the final state, the and should
contribute together to enhance the anisotropy as calculated in Figure 5. However, the
real situation is more complex because the difference in coordination number may
result in change in the morphology of the pores37, transport that causes the
disappearance or growth of pores18 and the defect evolution in the constrained film38.
Conclusion
Two stages of orientation process are identified in this work without considering the
transport of materials: the in-plane alignment caused by the confinement of the film in
the forming of green body and the constrained sintering process. If the pores are in the
scale of particles, ~0.1 m, the uneven material transport will alter the shape of the
pores to a direction normal to the substrate. On the contrary, for the pores from PFA
on the scale between 1 and 10 m, the effect of materials transport is negligible to the
anisotropy. The image simulation offers more information that could be neglected in
the real image analysis process, and a comparison of these parameters suggests that
the anisotropy in the porous ceramic just before sintering is independent of pore size.
Acknowledgement
15
Captions of FiguresFigure 1. (a) Particle size analysis of the Unitec 1-um and 2-um powder after ball
milling for 24 h in isopropanol containing 2 wt.% triton. (b) Dilatometry of the pellets
from two powders pressed under 149 MP.
Figure 2. Schematics of the thickness of the deposited film and the orientation of the
pore/PFA at different stages. The axes are shown in the image to in indicate x- and
y-direction. X-axis is the reference axis for the angle of particles.
Figure 3. (a) Cumulative angle distribution of the particles in the simulation work; (b)
discrete pore size fraction of the 2D pores/PFAs used in the modelling, PS_1 is 4
times larger than PS_2.
Figure 4. Image evolution with pores/PFAs of random angle distribution at different
shrinkage values. The length of the pore/PFAs in figure (a) and (b) is PS_1 and PS_2,
respectively. The size of the original image when =0 is 50m x 50 m. The width of
images for the simulation of shrinkage, the width of image is 50 m and the height
change to (1-) x 50 m by pressing the image from the top to the bottom. The insert
image when =0.9 are the zoom-ins of the area in the ellipses.
Figure 5. Statistics of the angle of the particles at different shrinkage in terms of
values.
Figure 6. Back-scattered images of the film sintered at 1320 oC with ink containing
Unitec 1-um (a) and 2-um (b) YSZ powder: (c) and (d) is the respective binarized
16
Figure 7. Pore size distribution (a) and cumulative fraction (b) of the constrained film
from Unitec 1-um and 2- um YSZ powder as shown in Figure 6.
Figure 8. (a) back-scattered image of the film sintered at 1100 oC with the ink
containing YSZ and graphite; (b) binarized image for measurement of porosity and (c)
despeckled image for measurement of pore size and orientation. The scale bars
represent 20 m.
Figure 9. (a) Pore size distribution and (b) cumulative fraction of the pores at different
angle. (c) is an image with the length profile of lines shown in (a) using the angle
distribution when is 0.66.
Figure 10. Back-scattered images of the film sintered at 1100 oC (a) and 1320 oC (b)
from the ink containing YSZ and glassy carbon. The length of scale bar is 10 m.
Figure 11 the Ry/x values for the pores from glassy carbon after a sintering at 1100 oC
and 1320 oC. The straight line in each group of data shows the average value and the
rectangle shows the standard deviation.
Caption of table
17
Reference
1 S. Somiya, F. Aldinger, N. Claussen, R.M. Spriggs, K. Uchino, K. Koumoto and M.
Kaneno, Handbook of Advanced Ceramics. Volume II: Processing and Their Applications.
Academic Press, Oxford, 2003.
2
J. Chen, F. Liang, D. Yan, J. Pu, B. Chi, S. P. Jiang, and L. Jian, "Performance of
Large-scale Anode-supported Solid Oxide Fuel Cells with Impregnated La0.6Sr0.4Co0.2Fe0.8O3-
+Y2O3 Stabilized ZrO2 Composite Cathodes," J. Power Sources,195[16] 5201-05 (2010). 3
C. S. Ni, J. Vohs, R. J. Gorte, andJ. T. S. Irvine, "Fabrication and Characterisation of a
Large-Area Solid Oxide Fuel Cell Based on Dual Tape Cast YSZ Electrode Skeleton
Supported YSZ Electrolyte with Vanadate and Ferrite Perovskite- Impregnated Anode and
Cathode," J. Mater. Chem. A,2 19150-55 (2014).
4
T. Ohji, "Microstructural Design and Mechanical Properties of Porous Silicon Nitride
Ceramics," Mater. Sci. Eng.: A,498[1–2] 5-11 (2008).
5
J. R. Wilson, W. Kobsiriphat, R. Mendoza, H.-Y. Chen, J. M. Hiller, D. J. Miller, K.
Thornton, P. W. Voorhees, S. B. Adler, and S. A. Barnett, "Three-dimensional Reconstruction
of a Solid-oxide-fuel-cell Anode," Nat. Mater.,5[7] 541-44 (2006).
6
S. W. Sofie, "Fabrication of Functionally Graded and Aligned Porosity in Thin Ceramic
Substrates with the Novel Freeze-tape-casting Process," J. Am. Ceram. Soc.,90[7] 2024-31
(2007).
7
J. Mizusaki, K. Waragai, S. Tsuchiya, H. Tagawa, Y. Arai, andY. Kuwayama, "Simple
Mathematical Model for the Electrical Conductivity of Highly Porous Ceramics," J. Am.
Ceram. Soc.,79[1] 109-13 (1996).
8
J. Kim, J. Peretti, K. Lahlil, J.-P. Boilot, and T. Gacoin, "Optically Anisotropic Thin Films
by Shear-oriented Assembly of Colloidal Nanorods," Adv. Mater. (Weinheim, Ger.), Doi:
10.1002/Adma.201300594(2013).
9
A. D. Rey and M. M. Denn, "Dynamical Phenomena in Liquid-crystalline Materials," Annu.
Rev. Fluid Mech.,34[1] 233-66 (2002).
10
M. J. Zhi, N. Mariani, R. Gemmen, K. Gerdes, and N. Q. Wu, "Nanofiber Scaffold for
Cathode of Solid Oxide Fuel Cell," Energy Environ. Sci.,4[2] 417-20 (2011).
11
C.S. Ni, M. Cassidy and J. T. S. Irvine, " Image Analysis of the Porous Yttria-Stabilized
Zirconia (YSZ) Structure for the Impregnated Electrode of Solid Oxide Fuel Cell (SOFC)," to
be published.
12
J. L. Jones, B. J. Iverson, and K. J. Bowman, "Texture and Anisotropy of Polycrystalline
18
13
A. Heunisch, A. Dellert, and A. Roosen, "Effect of Powder, Binder and Process Parameters
on Anisotropic Shrinkage in Tape Cast Ceramic Products," J. Eur. Ceram. Soc.,30[16]
3397-406 (2010).
14
F. V. Dimarcello, P. L. Key, and J. C. Williams, "Preferred Orientation in Al2O3
Substrates," J. Am. Ceram. Soc.,55[10] 509-14 (1972).
15
S. Tanaka, Y. Kuwano, and K. Uematsu, "Packing Structure of Particles in a Green
Compact and Its Influence on Sintering Deformation," J. Am. Ceram. Soc.,90[11] 3717-19
(2007).
16
K. Uematsu, S. Ohsaka, N. Shinohara, and M. Okumiya, "Grain-Oriented Microstructure of
Alumina Ceramics Made through the Injection Molding Process," J. Am. Ceram. Soc.,80[5]
1313-15 (1997).
17
O. Guillon, L. Weiler, and J. Rödel, "Anisotropic Microstructural Development During the
Constrained Sintering of Dip-Coated Alumina Thin Films," J. Am. Ceram. Soc.,90[5]
1394-400 (2007).
18
X. Wang and A. Atkinson, "Microstructure Evolution in Thin Zirconia Films: Experimental
Observation and Modelling," Acta Mater.,59[6] 2514-25 (2011).
19
E. A. Olevsky, "Theory of Sintering: From Discrete to Continuum," Mater. Sci. Eng.
R-Rep.,23[2] 41-100 (1998).
20
J. S. Patwardhan and W. R. Cannon, "Factors Influencing Anisotropic Sintering Shrinkage
in Tape-cast Alumina: Effect of Processing Variables," J. Am. Ceram. Soc.,89[10] 3019-26
(2006).
21
M. I. Zainuddin, S. Tanaka, R. Furushima, and K. Uematsu, "Influence of Particles Packing
in Granules on the Particles Orientation in Compacts," J. Eur. Ceram. Soc.,31[1-2] 3-11
(2011).
22
A. Dellert, A. Heunisch, and A. Roosen, "The Origin of Anisotropic Shrinkage in Tape-cast
Green Tapes," Int. J. Appl. Ceram. Technol.,8[6] 1312-19 (2011).
23
G. Besendörfer and A. Roosen, "Particle Shape and Size Effects on Anisotropic Shrinkage
in Tape-cast Ceramic Layers," J. Am. Ceram. Soc.,91[8] 2514-20 (2008).
24
J.-B. Ollagnier, O. Guillon, and J. Rödel, "Effect of Anisotropic Microstructure on the
Viscous Properties of an LTCC Material," J. Am. Ceram. Soc.,90[12] 3846-51 (2007).
25
R. Mücke, N. H. Menzler, H. P. Buchkremer, and D. Stöver, "Cofiring of Thin Zirconia
Films During Sofc Manufacturing," J. Am. Ceram. Soc.,92 S95-S102 (2009).
26
J.-S. Kim, R. A. Rudkin, X. Wang, and A. Atkinson, "Constrained Sintering Kinetics of
3YSZ Films," J. Eur. Ceram. Soc.,31[13] 2231-39 (2011).
27
D. W. Ni, E. Olevsky, V. Esposito, T. T. Molla, S. P. V. Foghmoes, R. Bjørk, H. L.
19
II–Experiments and Model Applications," J. Am. Ceram. Soc., (2013). Doi:
10.1111/Jace.12374
28
Z. Fu and A. Roosen, "Shrinkage of Tape Cast Products During Binder Burnout," J. Am.
Ceram. Soc.,98[1] 20-29 (2015).
29
F. Jones and J. Irvine, "Preparation of thin films using the tape-casting process for use in
the solid oxide fuel cell," Ionics,8[5] 339-43 (2002).
30
W. R. Cannon and P. M. Raj, "Evolution of Sintering Anisotropy Using a 2D Finite
Difference Method," J. Am. Ceram. Soc.,92[7] 1391-95 (2009).
31
P. M. Raj, A. Odulena, and W. R. Cannon, "Anisotropic Shrinkage During Sintering of
Particle-oriented Systems—Numerical Simulation and Experimental Studies," Acta
Mater.,50[10] 2559-70 (2002).
32
L. Amaral, C. Jamin, A. M. R. Senos, P. M. Vilarinho, andO. Guillon, "Constrained
sintering of BaLa4Ti4O15 thick films: Pore and grain anisotropy," J. Eur. Ceram. Soc.,33[10]
1801-08 (2013).
33
M. Albano, L. Garrido, K. Plucknett, and L. Genova, "Influence of Starch Content and
Sintering Temperature on the Microstructure of Porous Yttria-stabilized Zirconia Tapes," J.
Mater. Sci.,44[10] 2581-89 (2009).
34
R. Zuo, E. Aulbach, R. K. Bordia, and J. Rödel, "Critical Evaluation of Hot Forging
Experiments: Case Study in Alumina," J. Am. Ceram. Soc.,86[7] 1099-105 (2003).
35
A. Shui, Z. Kato, S. Tanaka, N. Uchida, and K. Uematsu, "Sintering Deformation Caused
by Particle Orientation in Uniaxially and Isostatically Pressed Alumina Compacts," J. Eur.
Ceram. Soc.,22[3] 311-16 (2002).
36
Y. Zhao and L. R. Dharani, "Theoretical-Model for the Analysis of a Ceramic Thin-Film
Sintering on a Non-Sintering Substrate," Thin Solid Films,245[1-2] 109-14 (1994).
37
H. L. Zhang, J. F. Li, and B. P. Zhang, "Microstructure and Electrical Properties of Porous
Pzt Ceramics Derived From Different Pore-forming Agents," Acta Mater.,55[1] 171-81
(2007).
38
C. L. Martin, H. Camacho-Montes, L. Olmos, D. Bouvard, and R. K. Bordia, "Evolution of
Defects During Sintering: Discrete Element Simulations," J. Am. Ceram. Soc.,92[7] 1435-41
Figure 1. (a) Particle size analysis of the Unitec 1-um and 2-um powder after ball milling for 24 h in isopropanol containing 2 wt.% triton. (b) Dilatometry of the pellets from two powders pressed under 149 MP
(b)
0 200 400 600 800 1000 1200 1400 -0.25
-0.20 -0.15 -0.10 -0.05 0.00
0.05 Unitec 1 um
Unitec 2 um
L/
Lo
Temperature / o
C
(a)
0.01 0.1 1 10
0 4 8 12
V
o
lu
m
e
p
e
rc
e
n
ta
g
e
/
%
Particle size /m
[image:20.540.177.368.45.423.2]Initial state
L
oStarting sintering
L
1Final state
L
2q
0q
1x
y
Stage I
Stage II
Pore of PFA
[image:21.540.80.438.91.350.2]Pore of PFA
Figure 3 (a) Cumulative angle distribution of the particles in the simulation work; (b) discrete particle size fraction of the 2D pores/PFAs used in the modelling, PS_2 is 4 times larger than PS_1.
(b)
0.0 0.2 0.4 0.6 0.8 1.0 1.2 1.4 0.0
0.2 0.4 0.6 0.8 1.0
y=-0.00739+0.3233x
Adjusted R-squared: 0.99965
C
um
ulat
iv
e
frac
tion
theta
(a)
0.0 0.1 0.2
F
re
q
u
e
n
cy
f
ra
ct
io
n
PS_1 PS_2
D / m
[image:22.540.173.437.92.631.2]0 10 20 30 40 50 0 10 20 30 40 50 =0
0 10 20 30 40 50
0 10 20 30 40 50 =0.1
0 10 20 30 40 50
0 10 20 30 40 50 =0.3
0 10 20 30 40 50
0 10 20 30 40 50 =0.5
0 10 20 30 40 50
0 10 20 30 40 50 =0.7
0 10 20 30 40 50
0 10 20 30 40 50 =0.9
0
10
20
30
40
50
0
10
20
30
40
50
=0
0
10
20
30
40
50
0
10
20
30
40
50
=0.1
0
10
20
30
40
50
0
10
20
30
40
50
=0.3
0
10
20
30
40
50
0
10
20
30
40
50
=0.5
0
10
20
30
40
50
0
10
20
30
40
50
=0.7
0
10
20
30
40
50
=0.9
0 10 20 30 40 50
0 10 20 30 40 50 =0
0 10 20 30 40 50
0 10 20 30 40 50 =0.1
0 10 20 30 40 50
0 10 20 30 40 50 =0.3
0 10 20 30 40 50
0 10 20 30 40 50 =0.5
0 10 20 30 40 50
0 10 20 30 40 50 =0.7
0 10 20 30 40 50
0 10 20 30 40 50 =0.9
0
10
20
30
40
50
0
10
20
30
40
50
=0
0
10
20
30
40
50
0
10
20
30
40
50
=0.1
0
10
20
30
40
50
0
10
20
30
40
50
=0.3
0
10
20
30
40
50
0
10
20
30
40
50
=0.5
0
10
20
30
40
50
0
10
20
30
40
50
=0.7
[image:23.540.13.510.167.529.2](a)
(b)
Figure 5. statistics of the angle of the particles at
different shrinkage in terms of
values.
0.0 0.2 0.4 0.6 0.8 1.0 1.2 1.4 0.0
0.2 0.4 0.6 0.8 1.0
C
u
mu
la
tive
fra
ct
io
n
theta
=0.9
=0.7
=0.5
=0.3
=0.1
=0
y=(2/)atan((1-)-1
tan(q))
Figure 6. Back-scattered images of the film sintered at 1320 oC with ink containing Unitec 1
um (a) and 2 um (b) YSZ powder: (c) and (d) is the respective binarized image for calculation of porosity, pore orientation and pore size.
(a)
(b)
(d)
Figure 7. Pore size distribution (a) and cumulative fraction (b) of the constrained film from Unitec 1-um and 2-um YSZ powder.
0.1 1
0.0 0.2 0.4 0.6 0.8 1.0 1.2 1.4
Unitec 1 um Unitec 2 um
Frequ
en
cy
fr
acti
on
D / m
0.0 0.2 0.4 0.6 0.8 1.0 1.2 1.4 0.0
0.2 0.4 0.6 0.8 1.0
Unitec 1 um Unitec 2 um
C
umul
ati
ve f
racti
on
theta
(a)
Figure 8. (a) back-scattered image of the film sintered at 1100 oC with the ink containing YSZ
and graphite; (b) binarized image for measurement of porosity and (c) despeckled image for measurement of pore size and orientation. The scale bars represent 20 m.
[image:27.540.17.538.57.198.2]Figure 9. (a) Pore size distribution and (b) cumulative fraction of the pores at different angle. The line in (c) shows an image with the length profile shown in (a) using the angle distribution when ts is 0.64.
(a)
0.1 1 10 100
0.00 0.04 0.08 0.12 0.16
Frequency fra
ction
L /m
(b)
0.0 0.2 0.4 0.6 0.8 1.0 1.2 1.4 0.0
0.2 0.4 0.6 0.8 1.0
Cumulative fract
ion
theta
ts=0.64
0 20 40 60 80 100 120 140 0
20 40 60 80
y /
m
x /m
O
[image:28.540.68.486.158.556.2]Figure 10. Back-scattered images of the film sintered at 1100 oC (a) and 1300 oC (b) from the ink containing YSZ and glassy carbon. The length of scale bar
is 20 m.
Figure 11 the Ry/x values for the pores from glassy carbon after a sintering at 1100 oC and
1320 oC. The straight line in each group of data shows the average value and the rectangle
shows the standard deviation.
0.5 0.6 0.7 0.8 0.9 1.0 1.1 1.2 1.3 1.4
Sample sintered
at 1320 oC
R y/x
Sample sintered
Table 1. Recipes of the inks with and without pore forming agent (PFA)
No. ceramic PFA vehicle KD-1 vol.% of
ceramica/ Vc
vol.% of PFAb/ Vp 1 Unitec 1 um
20.0 g
- 7.80
mL
0.40 g 30.0% -
2 Unitec 2 um 20.0 g
- 7.80
mL
0.40 g 30.0% -
3 Unitec 1 um 5.0 g
graphite 1.0 g
4.18 mL
0.12 g 15.0% 9.0%
4 Unitec 1 um 5.0 g
glassy carbon 1.0 g
4.18 mL
0.12 g 14.6% 11.7%
a
: density of YSZ 6.0 g/cm3
b
Image analysis and modelling of the orientation of pores in a
constrained film on a rigid substrate
By C.S. Ni & John T.S. Irvine*
Corresponding author: email
[email protected]
Figure S1. SEM images of the as-received YSZ powders : (a) Unitec 1-um powder and (b) Unitec 2-um.
(a)
Figure S2. viscosity and shear stress of the four inks collected in the logarithmic mode with increasing shear rate.
0.1 1 10
10 20
30 Viscosity
Shear Stress
Shear rate /s-1
vi sc osit y / Pa. s 1 10 100shear s tr ess /Pa Ink No.1
0.1 1 10
7 8 9 10 11 12 13 14 Ink No.2 Viscosity Shear Stress
Shear rate /s-1
vi sc osit y / Pa. s 1 10 100shear s tr ess /Pa
0.1 1 10
6 7 8 9 10 11 12 13 14 Ink No.4 Viscosity Shear Stress
Shear rate /s-1
vi sc osit y / Pa. s 1 10 100 shear s tr ess /Pa
0.1 1 10
7 8 9 10 11 12 13 14 Viscosity Shear Stress
Shear rate /s-1
Figure S3. High-magnification images of the film sintered
at 1320
oC with ink containing Unitec 1 um (a) and 2 um
(c) YSZ powder: (b) and (d) are the respective binarized
image for calculation of porosity.
The porosity from image (b) and (d) is 26.3% and 38.3 %
respectively. Five images like this is used for the porosity
as stated in the text. The scale bar is 1
m
m.
(a) (b)