STABILITY INDICATING METHOD DEVELOPMENT AND
VALIDATION FOR SIMULTANEOUS ESTIMATION OF LOPINAVIR
AND RITONAVIR BY USING RP-HPLC
P. S. Raghu*
University College of Pharmaceutical Sciences, Sri Krishnadevaraya University, A.P-515003.
ABSTRACT
A simple, Accurate, precise method was developed for the
simultaneous estimation of the Lopinavir and Ritonavir in
Pharmaceutical dosage form. Chromatogram was run through Inertsil
C18 (250mm 4.6mm, 5µ). Mobile phase containing Orthophosphoric
acid buffer and Acetonitrile in the ratio of 44:6 was pumped through
column at a flow rate of 1.0 ml/min. Temperature was maintained at
30°C. Optimized wavelength for Lopinavir and Ritonavir was 310nm.
Retention time of Lopinavir and Ritonavir were found to be 2.214min
and 3.163min. %RSD of the Lopinavir and Ritonavir were and found
to be 0.6 and 0.3 respectively. %Recover was Obtained as 99.64% and
99.56% for Lopinavir and Ritonavir. LOD, LOQ values were obtained from regression
equations of Lopinavir and Ritonavir were 0.20ppm, 0.61ppm and 0.08ppm, 0.24ppm
respectively. Regression equation of Lopinavir y = 7745x+22310, and of Ritonavir is y =
11440x + 7469. Retention times were decreased and that run time was also decreased so the
method developed was simple and economical that can be adopted in regular Quality control
test in Industries.
KEYWORDS: Lopinavir, Ritonavir, RP-HPLC.
INTRODUCTION
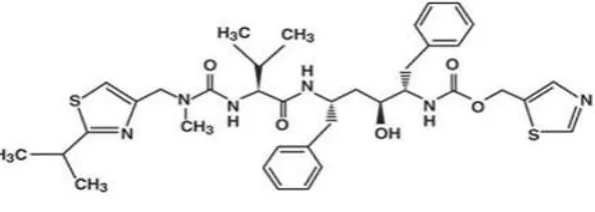
Lopinavir1, is chemically known as (2H) – pyrimidine acetamide N‐ [[4‐(2,6‐ methyl phenoxy) acetyl]amino]‐3‐hydroxy 5‐ phenyl‐ 1‐ (phenyl methyl) pentyl, tetrahydro‐α‐ (1‐ methyl ethyl)‐ 2‐ oxo and its empirical formula is C37H48N4O5, having a molecular weight
of 628.80.
Volume 7, Issue 3, 1750-1757. Research Article ISSN 2277–7105
Article Received on 18 Dec. 2017,
Revised on 09 Jan. 2018, Accepted on 01 Feb. 2018
DOI: 10.20959/wjpr20183-11106
*Corresponding Author
P. S. Raghu
University College of
Pharmaceutical Sciences, Sri
Krishnadevaraya University,
Figure. 1: structure of lopinavir.
Ritonavir2, is chemically known as 2,4,7,12‐ tetra azatridecan‐ 13oic acid, 10 hydroxy‐ 2‐ methyl‐ 5‐ (1‐ methyl ethyl)‐ 1‐ [2‐ (1‐ methyl ethyl)‐ 4‐ thiazolyl]‐ 3,6‐ dioxo‐ 8,11‐ bis(phenyl methyl)‐ 5‐ thiazol methyl ester and its empirical formula is C37H48N6O5S2 with
a molecular weight of 720.9.Both the drugs were used as antiretroviral agents.
Figure. 2: structure of Ritonavir.
Various analytical methods have been reported for the assay of lopinavir and ritonavir
individually or combination with other drugs in biological samples/formulations. They
include HPLC3‐6, high performance thin layer chromatography 7, derivative UV
spectrophotometry8. Literature survey reveals that no analytical method for determination of
lopinavir and ritonavir in combine dosage forms is reported. So it is felt worthwhile to
develop a simple, rapid, accurate, precise and more economical high performance liquid
chromatographic method for simultaneous estimation of lopinavir and ritonavir in bulk and
its combined dosage form.
2. Experimental work
MATERIALS AND INSTRUMENTS
Reference standards of lopinavir and ritonavir were obtained as gift samples from Tenna labs,
Hyderabad. Market formulation of this combination Emletra and Ritocom were procured
from the local market. HPLC grade acetonitrile and methanol were obtained from Merck
[image:2.595.147.445.316.422.2]were purchased from SD Fine chemicals, India. Water obtained from Millipore with milli Q system, filtered through 0.45 μ nylon‐66membrane was used for the HPLC work. The LC
system consisted ofisocratic pump, auto sampler and UV detector. The output signal was
monitored and integrated using LC solutions chromatography Manager Software
(Prominence HPLC, Shimadzu, Japan).
Mobile phase
A mixture of ortho phosphoric acid phosphate buffer, acetonitrile in the ratio (48:52 v/v) was
used as mobile phase which was filtered through a 0.45µ nylon membrane filter.
Preparation of mixed standard solution of Lopinavir and Ritonavir
About 100 mg of lopinavir and 25 mg of ritonavir were weighed accurately and transferred
to 100 ml standard volumetric flask. It was dissolved in mobile phase then the solution was
sonicated for about 10 min and the volume was made up to the mark with mobile phase to
give a stock solution containing 1mg/ml of lopinavir and 0.25 mg/ml of ritonavir.
Preparation of sample solution of Lopinavir and Ritonavir
To determine the content of the drugs in pharmaceutical formulations, twenty tablets were
weighed and pulverized using a mortar and pestle. An amount equivalent to 100 mg of
lopinavir and 25 mg of ritonavir, was transferred to a 100ml standard volumetric flask, about
60ml of mobile phase was added and sonicated for about 10minutes. Then volume was made
up to the mark with mobile phase and filtered through a 0.45 μ nylon membrane filter. An
aliquot portion of the filtrate was further diluted to get final concentration of 500 μg/ml of lopinavir and 125 μg/ml of ritonavir. All the determinations were conducted six times to
ensure repeatability of the method. The mean peak area of the each drug was calculated.
RESULTS AND DISCUSSION
The purpose of the present study was to develop a rapid and sensitive RP‐HPLC method for
the simultaneous estimation of lopinavir and ritonavir in combined dosage form using
InertsilC18 analytical column with UV detection 310 nm.
Method optimization
To optimize the operating conditions for isocratic RP‐LC detection of analytes, a number of
parameters such as the mobile phase composition, pH and flow rate were varied. Various
syste m suitability study. The variation in the mobile phase led to considerable changes in the
chromtographic parameters like symmetry, capacity factor and retention time. The pH effect
showed that optimized conditions are reached when the pH value was 6.0, producing well
resolved and sharp peaks for lopinavir and ritonavir. Henceforth, in the present method the
ratio of (48:52v/v) potassium hydrogen phosphate buffer: acetonitrile pH adjusted to 6.0 ±0.1
with 10% sodium hydroxide as a mobile phase, at a flow rate of 1.0 mLmin‐1 was chosen as
optimal conditions. The appropriate wavelength inUV region (310nm) was selected for the
measurement of active ingredients in the proposed method. For quantitative determination of
lopinavir and ritonavir in formulations, initially mixed standard solution was injected into the
column five times and the retention time of lopinavir and ritonavir was found to be 2.24 and
[image:4.595.158.440.313.472.2]3.163min, respectively (Fig.1).
Figure. 3: chromatogram for lopinavir and ritonavir.
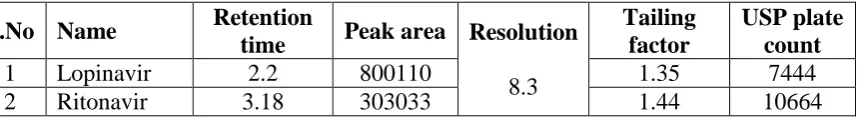
System Suitability
Table. 1: system suitability parameters.
S.No Name Retention
time Peak area Resolution
8.3
Tailing factor
USP plate count
1 Lopinavir 2.2 800110 1.35 7444
2 Ritonavir 3.18 303033 1.44 10664
Validation[8] The described method has been validated for the simultaneous estimation of
lopinavir and ritonavir using following parameters.
Accuracy
Accuracy of the method was demonstrated at three different concentration levels (80‐120%)
by spiking a known quantity of standard drugs into a analyzed sample in triplicate. The
[image:4.595.90.521.559.619.2]Precision For the precision of the method, three replicate were injected into the system on
two different non consecutive days, in each case %RSD was calculated. Results of precision
[image:5.595.143.454.471.655.2]are given in Table 3, which indicated that the method is precise.
Table. 2: Recovery study of Lopinavir and Ritonavir using the proposed HPLC method.
Sample Amount added (µg/ml) Recovery (%) %RSD
Lopinavir
50 99.59 0.4
100 100.34 0.9
150 99.00 0.5
Ritonavir
12.5 99.54 0.3
25 99.30 0.3
37.5 99.85 0.4
Table. 3: Method precision for Lopinavir and Ritonavir in combined dosage form.
S. No Drug name Lablled amount Amount found in mg
Inter day Intra day
1 Lopinavir 100 mg 99.8±0.02 99.6±0.03 2 Ritonavir 25 mg 24.90±0.03 24.75±0.08
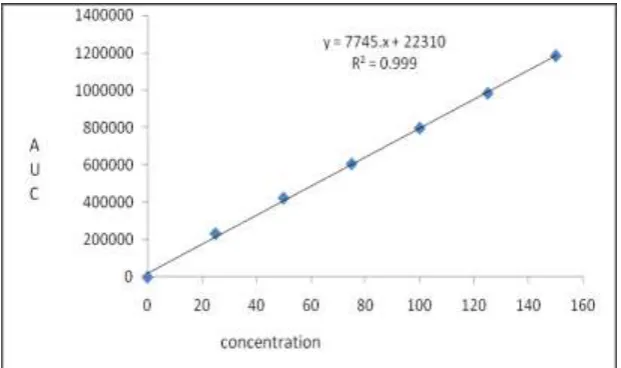
Linearity To establish linearity of the proposed method, five different sets of drug solution
was prepared and analyzed. Standard curves were constructed in the concentration range of 25-150µg mL‐1 of lopinavir and 12.5 - 7.5 µg mL‐1 of ritonavir (Fig.2). Slope, intercept and
the correlation coefficient were determined and the regression statistics are shown in Table 3.
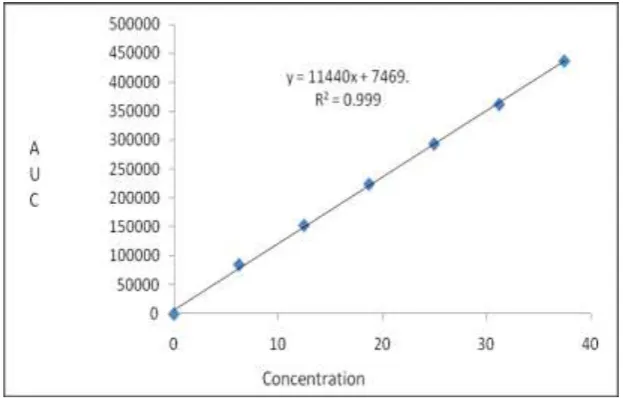
Figure. 5: linearity curve of Ritonavir.
Table. 4: Analytical Performance Parameters for Lopinavir and Ritonavir.
Parameters Lopinavir Ritonavir
Linearity Range 25ppm-150ppm 12.5ppm-75ppm Regression equation y = 7745.x + 22310 y = 11440.x + 7469 Correlation coefficient 0.999 0.999
Slope 7745 11440
Intercept 22310 7469
Limit of detection (LOD) and limit of quantization (LOQ) The limit of detection and limit
of quantification for lopinavir and ritonavir were calculated from the linearity data using
relative standard deviation of the response and slope of the calibrationcurve. The limit of
detection of a compound is defined as the lowest concentration of analyte that can be
detected. The results were tabulated below in table- Specificity No interference of peaks were
found in the chromatogram indicating that excipients used in the tablet formulation did not
interfere with the estimation of the drugs by the proposed method for the simultaneous
determination of lopinavir and ritonavir in the combined dosage form, hence the method is
specific.
Table. 5: LOD and LOQ.
Drug Name LOD LOQ
Lopinavir 0.20 0.61
Ritonavir 0.08 0.24
Robustness In order to demonstrate the robustness of the method, system suitability
change in the ratio of mobile phase (±2% absolute). The method was demonstrated to be
[image:7.595.64.536.145.291.2]robust over an acceptable working range of its HPLC operational parameters.
Table. 6: Robustness.
S. No Degradation
Condition Lopinavir Ritonavir
% Drug Degraded Purity Angle Purity Threshold % Drug Degraded Purity Angle Purity Threshold 1 Acid 4.52 0.206 0.415 4.89 0.427 0.612 2 Alkali 2.99 0.739 0.896 2.94 0.402 0.589 3 Peroxide 1.18 0.214 0.321 1.67 0.492 0.717 4 Thermal 0.91 0.820 1.850 0.75 0.253 0.448
5 UV 0.68 0.766 1.555 0.98 0.372 0.715
6 Water 0.59 0.764 1.548 0.51 0.345 0.687
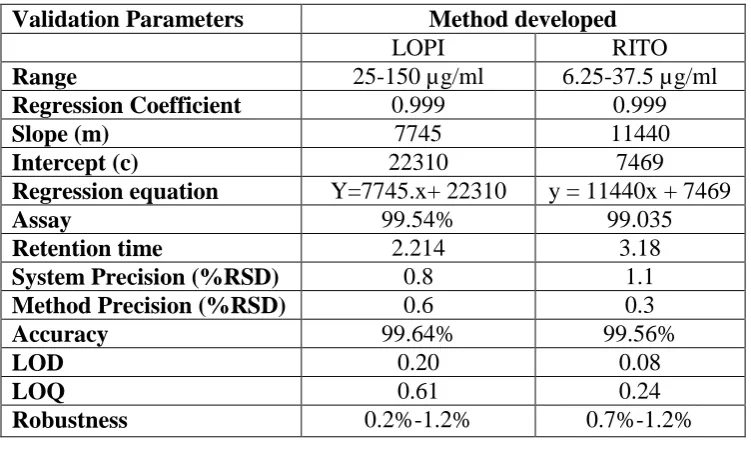
Table. 7: Summary table for validation parameters.
Validation Parameters Method developed
LOPI RITO
Range 25-150 µg/ml 6.25-37.5 µg/ml
Regression Coefficient 0.999 0.999
Slope (m) 7745 11440
Intercept (c) 22310 7469
Regression equation Y=7745.x+ 22310 y = 11440x + 7469
Assay 99.54% 99.035
Retention time 2.214 3.18
System Precision (%RSD) 0.8 1.1
Method Precision (%RSD) 0.6 0.3
Accuracy 99.64% 99.56%
LOD 0.20 0.08
LOQ 0.61 0.24
Robustness 0.2%-1.2% 0.7%-1.2%
CONCLUSION
The new stability indicating RP-HPLC method was developed and validated as per guidelines
for the simultaneous determination of Lopinavir and Ritonavir in combined pharmaceutical
dosage form. The proposed method was found to be accurate, precise, simple, economic,
rapid and having good specificity. The developed method can be applied for the assay of
commercial tablets containing Lopinavir and Ritonavir in routine quality control analysis.
ACKNOWLEDGEMENT
The author Dr P.S .Raghu gratefully thankful to the Sri Krishnadevaraya University
[image:7.595.111.487.323.552.2]and the Registrar Prof.Sudhakar Babu for providing constant encouragement and support
during the performance of the research work and preparation of the manuscript.
REFERENCES
1. Hing L. Sham, David A. Betebenner , Xiaoqichen, Ayda saldirar, Sudthida Vasavanonda,
Dale J. Kempf, Jacob J.Plattner and Daniel W. “Synthesis and structure activity relationship of a novel series of HIV‐1 protease inhibitors encompassing ABT‐378 (Lopinavir)”, Bio organic and Medicinal Chemistry Letters, 2002; 12(8): 1185‐1187.
2. The Merck Index, An Encyclopedia of Chemicals, Drugs and Biologicals, Merck & Co.,
Inc., NJ; 2001.
3. Faux. J. Venisse. N, Olivier. J. Bouquet. S. “Rapid high‐performance liquid
chromatography determination of lopinavir, a novel HIV‐1 protease inhibitor, in human plasma”, Chromatographia, 2001; 54: 469‐473.
4. Ray John, Pang Edna, Carey Dianne. “Simultaneous determination of indinavir, ritonavir and lopinavir (ABT378) in human plasma by high‐performance liquid chromatography”, J.Chromatogr.B. Biomed Sci Appl., 2002; 775: 225‐230.
5. S. Frappier, D. Brelih, E. Diarte, B. Ba, D. Ducint; J. L. Pellegrin and M. C. Saux.
“Simultaneous determination of ritonavir and saquinavir, two human immunodeficiency virus protease inhibitors, in human serum by high performance liquid chromatography”, J.Chromatogr.B. Biomed Sci Appl., 1998; 714: 384‐389.
6. Richard M. W. Hoetelmans, Marjolijn van Essenberg, Monique Profijt, Pieter L.
Meenhorst, Jan W. Mulder and Jos H. Beijnen. “High performance liquid
chromatographic determination of ritonavir in saliva, cerebro spinal fluid and human plasma”, J.Chromatogr.B. Biomed Sci Appl., 1998; 705(1): 119‐126.
7. K.V. Mangoankar, N.D. Prabhu Navelkar, A.V. Sulebhavikar and U.D.Pawar. “HPTLC
method for simultaneous determination of lopinavir and ritonavir in capsule dosage form”, E‐Journal of Chemistry, 2008; 5(4): 706‐712.
8. Carolina Lupi Dias, Ana Maria Bergold, Pedro Edurado Froehlich. “UV‐Derivative
Spectrophotometric determination of Ritonavir Capsules and Comparison with LC”,