OPTIMIZED DEVELOPMENT AND EVALUATION OF MICROBIALLY
TRIGGERED BASED ORNIDAZOLE MICROSPHERES FOR COLON
TARGETING
Verma Surender*, Bhalla Gaurav and Goyal Gourav
Institute of Pharmaceutical Sciences, Kurukshetra University Kurukshetra.
ABSTRACT
The objective of the present study is to formulate and evaluate microbially triggered based colon targeted microspheres using two carriers tragacanth gum and inulin individually which would protect the release of the drug in the physiological environment of the stomach and small intestine and release the drug in the colon providing local action for the treatment of the amoebiasis. Ornidazole is a 5-nitroimidazole derivative and is used in the treatment of susceptible protozoal infections and also in anaerobic bacterial infections mainly for amoebiasis, giardiasis, vaginitis and duodenal ulcers. It is more effective against amoebiasis than metronidazole. The research involves the formulation, optimization and evaluation of colon targeting microspheres. The colon targeting microspheres were successfully developed by Ionotropic gelation technique, using tragacanth gum and inulin polymers in various proportions. Further, the prepared microspheres were characterized for particle size, morphology, entrapment efficiency, in vitro drug release, release kinetics, compatibility studies (DSC) and stability studies, Best formulations were selected from both type of microspheres as ORT4 and ORI4 based on amount of tragacanth
gum or inulin, sodium alginate and glutaraldehyde affecting % CDR and % EE. Drug release kinetics of ORT4 as well as ORI4 system best corresponds to koresmeyer peppas kinetics in
absence of rat caecal content while in presence of rat caecal contents, ORT4 followed zero
order kinetics and ORI4 still followed koresmeyer peppas kinetics and the mechanism of drug
release of all batches obtained from koresmeyer peppas kinetics corresponding to non Fickian diffusion showing Super Case II Transport mechanism.
KEYWORDS: Amoebiasis, Colon targeted microspheres, Ornidazole, Koresmeyer peppas kinetics.
Volume 5, Issue 6, 1489-1508. Research Article ISSN 2277– 7105
*Corresponding Author
Dr. Verma Surender
Institute of Pharmaceutical
Sciences, Kurukshetra
University Kurukshetra. Article Received on 05 April 2016,
Revised on 25 April 2016, Accepted on 15 May 2016
INTRODUCTION
Drug targeting into the colon is highly desirable for local treatment of a variety of bowel disease such as ulcerative colitis, crohn’s disease, amoebiasis, colonic cancer, local treatment of colonic pathologies, systemic delivery of proteins & peptide drug.[1] Rectal administration offers the shortest route for targeting drugs to the colon. However, reaching the proximal part of colon via rectal administration is difficult. Rectal administration can also be uncomfortable for patients and compliance may be less than optimal.[2] The colon is rich in lymphoid tissue uptake of antigens into mast cells of the colonic mucosa produces rapid local production of antibodies and this helps in efficient vaccine delivery. The colon in attraction interest as a site where poorly absorbed drug molecule may have an improved bioavailability .This reason of colon is pioneer of having a somewhat less hostile environment with less diversity and intensity of activity then the stomach and small intestine. Additionally, the colon has a longer retention time and appears highly responsive to agents that enhance the absorption of poorly absorbed drug apart from retarding of targeting dosage forms, a reliable colonic drug delivery could also be important starting position for the colonic absorption of per orally applied, undigested, unchanged and fully active peptide drugs.[3] The human colon has over 400 distinct species of bacteria as resident flora, a possible population of up to 1010 bacteria per gram of colonic contents. Among the reactions carried out by these gut flora are azoreduction and enzymatic cleavage i.e. glycosides. These metabolic processes may be responsible for the metabolism of many drugs and may also be applied to colon- targeted drug delivery of peptide based macromolecules such as insulin by oral administration.[2]
MATERIALS AND METHOD Material
Ornidazole was obtained as a gift sample from K. Pharma Chem, Ambala, Haryana and Sodium alginate, Inulin, Calcium Carbonate AR, Glutaraldehyde, Acetone, Isopropyl alcohol was purchased from Loba Chemie Mumbai and Tragacanth Gum were purchased from S.D. Fine Chem Limited Mumbai and Eudragit S 100 was purchased from Degussa Pvt. Ltd. Mumbai.
Method
Calcium chloride was used for hardening of microspheres. Glutaraldehyde was used as cross linking agent. Tragacanth gum and Inulin, individually, of different concentration were dissolved in distilled water and allow to swell for few hours. (I) Sodium alginate dissolved in distilled water and drug dispersed into this solution (II). I and II solution were mixed kept on magnetic stirrer at room temperature with constant speed. Added few ml of glutaraldehyde into mixture and allowed to crosslink for 1 hour. The bubble free dispersion was dropped into calcium chloride solution with a needle of 21 gauze. The microspheres allowed to harden in solution for 15 minutes. Then microspheres were filtered and dried primarily at room temperature and after it, in hot air oven at 35°C for about 30 min. Microspheres were then stored in glass bottles, capped tightly.
EVALUATION PARAMETERS OF MICROSPHERES[4, 5, 6] Flow properties of microspheres
Bulk Density
The bulk density was calculated using the formula.
δb = M/V0
Where, δb = Bulk density
M = Mass of sample in gm
V0 = Bulk volume of microspheres in cc
Tapped Density
The tapped density was calculated using the formula
δ1 = M/Va
Where, δ1 = Tapped density
M = Mass of sample
Va = Tapped density of microspheres in cc
Angle of Repose
The angle of repose, θ, was calculated using the formula.
θ = tan-1
h/r
Where, θ = angle of repose h= height of cone
Table 1: Angle of repose as an indication of powder flow properties S.No. Angle of repose (θ) Type of flow
1. <20 Excellent 2. 20-30 Good 3. 30-40 Passable 4. >40 Very poor
Compressibility Index or Carr’s index
Compressibility index is calculated using the formula.
% Compressibility = (δt – δ0/δt) x 100
Where, δt= Tapped density
δ0 = Bulk density
Table 2: Relationshipbetween % compressibility and flowability S.No. Compressibility Index Flow character
1. <10 Excellent 2. 11-15 Good 3. 16-20 Fair 4. 21-25 Passable 5. 26-31 Poor 6. >31 Very poor
Hausner’s ratio
Hausner’s ratio is calculated using the formula.
Hausner’s ratio = δt / δ0
Where, δt = Tapped density
δ0 = Bulk density
Lower Hausner’s ratio (<1.25) indicates better flow properties than higher ones (>1.25).
CHARACTERIZATION OF MICROSPHERES[7, 8, 9]
Characterization of microspheres was done by visual observation, optical microscopy, entrapment efficiency, drug loading, % yield of microspheres and In-vitro release studies.
Visual observation
Optical Microscopy
Particle size analysis of drug loaded microspheres was performed by optical microscopy using compound microscope calibrated with eyepiece and stage micrometre.
Encapsulation efficiency
Practical or actual drug content was determined by accurately weighed amount (10 mg) of the formulation of microspheres in 20 ml phosphate buffer pH 6.8. It was left to equilibrate for 24 hrs at room temperature. The suspension was then centrifuged at 3000 rpm for 15 minutes. The supernatant was diluted appropriately with phosphate buffer and analyzed for concentration of drug using UV spectrophotometrically (318.6nm) at suitable wavelength (USP, NF 2005).
Drug release study[10]
In Vitro Drug release study in pH 1.2 (Acidic buffer) and pH 7.4 (Phosphate buffer)
The ability of the formulated microspheres to prevent the drug release in the physiological environment of the stomach and retard drug release in small intestine was assessed by conducting drug release studies in simulated stomach and simulated intestinal pH respectively. In vitro dissolution studies or drug release studies were performed for microspheres of ornidazole using USP dissolution apparatus II (Paddle type, Electrolab tablet dissolution apparatus) at 50 rpm and temperature was maintained upto 37 ± 0.5oC, with dissolution medium of 250 ml. The microspheres were enclosed in empty teabags to prevent slippage of microspheres from basket. Using 250 ml of 0.1 N HCl for first 2 hr and phosphate buffer of pH 7.4 for next 3 hrs. An aliquot (5 ml) of the sample solution was withdrawn at predetermined time intervals, filtered through whatman filter paper and analyzed spectrophotometrically at 277.4 for 0.1N HCl buffer and at 307.6 for phosphate buffer of pH 7.4. An equal amount of fresh dissolution medium was replaced immediately after withdrawal of the test sample.
In Vitro Drug Release Study in Phosphate Buffer Saline pH 6.8
After performing the in vitro drug release studies in the stimulated dissolution medium of pH 1.2 and 7.4, same formulation were tested in the dissolution medium having phosphate saline buffer of pH 6.8 for stimulation of the colonic medium. All the conditions were same used for
CHARACTERIZATION OF BEST BATCH OF MICROSPHERES Swelling behaviour of microspheres[11]
The swelling properties of optimized batches of microspheres were investigated in phosphate buffer 7.4 and phosphate buffer 6.8. Sample of microspheres equivalent to 10 mg were placed in petri plates containing 20 ml of swelling solution (6.8 or 7.4 buffer). After 2 hours, swollen microspheres were removed and reweighed. The wet weight of swollen microspheres was determined by blotting them filter paper to remove moisture, followed by weighing them on electronic balance. The percentage of swelling of microspheres was calculated from equation.
Percentage of swelling = [(Ws – Wi)/Wi)] x 100
Where, Ws = weight of microsphere in swollen state Wi = initial weight of the microspheres.
Ex-vivo drug release studies in presence of Rat Caecal Content[10, 12]
As the tragacanth & inulin, which was used as a polymer to make formulations were susceptible to microbes present in the colon. Therefore, dissolution rate studies were also performed using rat caecal content because of similarity with human colonic microflora to simulate microbial environment of colon.
The experimental protocol was under strict compliance of the CPCSEA guidelines as IPS/AH/278. Albino rats which were maintained on normal diet were used and to simulate enzymes which specifically hydrolyze tragacanth gum, enzyme induction was done. For enzyme induction, tragacanth gum aqueous dispersion (1 ml of 2% w/v dispersion) was administered to the rats daily for 6-7 days. Thirty minutes before the commencement of study, four rats were killed, their abdomen were opened, caecai were isolated, ligated from both ends, cut loose and transferred immediately into phosphate saline buffer pH 6.8 bubbled with CO2 gas. Afterwards, caecal bags were opened and their contents were weighed and
transferred to phosphate saline buffer to obtain 4% w/v rat caecal content. Due to the anaerobic nature of the bacterial content, all the operations were performed under the environment of CO2 gas.
studies were carried out in 0.1 N HCl (pH 1.2) for 2 hrs followed by phosphate saline buffer at pH 7.4 for 3 hrs. Afterwards, drug release studies were performed using 250 ml of pH 6.8 phosphate saline buffer having 4% w/v of rat caecal content prepared by adding 10 gm of caecal content to the dissolution medium of pH 6.8. The experiment was performed for 7 hrs in pH 6.8 completing an overall time period of 12 hrs with continuous supply of CO2 to
provide environment.
At different time intervals, samples were withdrawn without a prefilter and was replaced with the same dissolution medium freshly bubbled with CO2 gas to maintain the sink condition.
Afterwards, each withdrawn samples were diluted with phosphate saline buffer pH 6.8. Then samples were centrifuged and supernatant was removed using bacteria proof filters (G5) and the filtrates were analyzed for drug concentration by UV spectroscopy.
In vivo studies[13, 14]
The polymers used in the formulation are based on microbially triggered release mechanism Tragacanth and inulin individually used in the formulations is capable of microbial growth in the colon. Therefore in-vivo studies were also performed using mice stools to test the efficacy of polymers to increase the quantity of enzymes present in the colonic microflora.
The experimental protocol was under strict compliance of the CPCSEA guidelines as IPS/AH/278. Enterococci stool colonization method is followed for in vivo studies.
Male mice weighing 25±5gm were housed in individual cages and fed rodent chow and water. 1ml of coated microspheres dispersion was orally fed to mice (in a group of six) using an oral feeding canula. The stools were collected periodically at 8 hrs intervals for 50 hrs and subjected for Enterococci colonization density study.
Quantification of stool organisms
For quantification of microorganisms, stool samples in normal saline were heated to 80°C for 20 min in order to limit growth of other organisms. These samples were serially diluted in saline, poured on agar plates and incubated at 37°C for 48 h. Bacillus colonies were identified by their unique morphology.
FTIR studies
The samples were prepared by using potassium bromide and scanned for the absorbance at 4000-400/cm-1.
SEM analysis[15]
The optimized batches were analyzed by SEM for surface morphology before and after dissolution. SEM studies were carried out with scanning electron microscope. Samples were sticked on double sided carbon tape on electron microscope brass tab and coated with gold in ion sputter. Picture of microspheres were taken by random scanning of stub.
RESULT AND DISCUSSION
In the present study an attempt was made to formulate ornidazole as multiparticulate drug delivery system for colon targeting using Tragacanth and inulin as biodegradable natural polymer.
Morphological Study
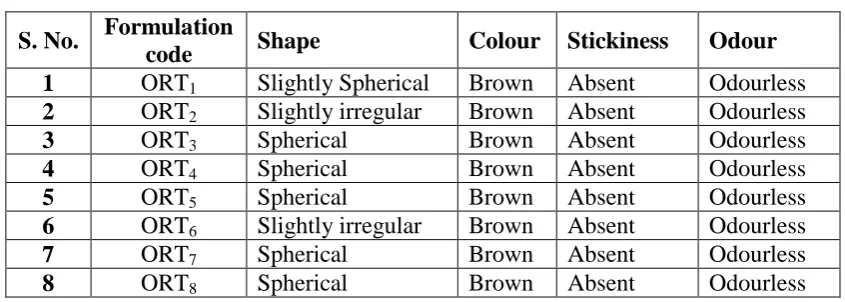
[image:8.595.86.509.432.583.2]All the prototype batches of tragacanth gum microspheres were evaluated on basis of morphological characteristics like shape, colour, stickiness odour and mentioned in Table: 3.
Table 3: Morphological characters of ornidazole microspheres with tragacanth gum S. No. Formulation
code Shape Colour Stickiness Odour
1 ORT1 Slightly Spherical Brown Absent Odourless
2 ORT2 Slightly irregular Brown Absent Odourless
3 ORT3 Spherical Brown Absent Odourless
4 ORT4 Spherical Brown Absent Odourless
5 ORT5 Spherical Brown Absent Odourless
6 ORT6 Slightly irregular Brown Absent Odourless
7 ORT7 Spherical Brown Absent Odourless
8 ORT8 Spherical Brown Absent Odourless
All the prototype batches of inulin microspheres were evaluated on basis of morphological characteristics like shape, colour, stickiness odour and mentioned in Table: 4.
Table 4: Morphological characters of ornidazole microspheres with inulin S. No. Formulation
code Shape Colour Stickiness Odour
1 ORI1 Spherical Brown Absent Odourless
2 ORI2 Spherical Brown Absent Odourless
3 ORI3 Spherical Brown Absent Odourless
[image:8.595.77.520.666.757.2]5 ORI5 Spherical Brown Absent Odourless
6 ORI6 Spherical Brown Absent Odourless
7 ORI7 Slightly irregular Brown Absent Odourless
8 ORI8 Spherical Brown Absent Odourless
Determination of particle size.
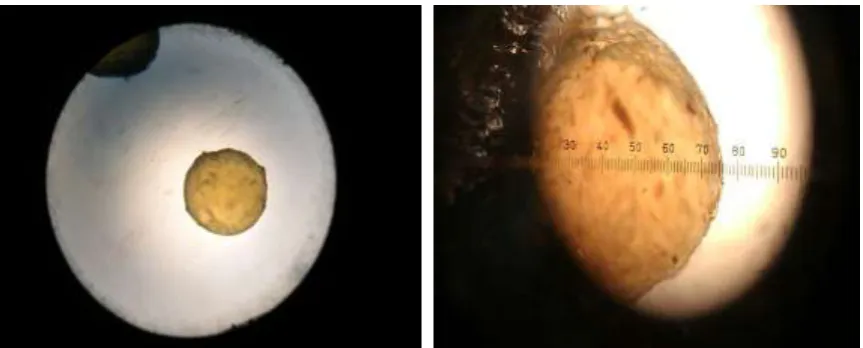
Determination of particle size is determined by optical microscopy. Photographic images are shown in “Fig”: 1.
[image:9.595.79.520.72.131.2]
Figure 1: Optical photograph of microsphere with & without eyepiece micrometer
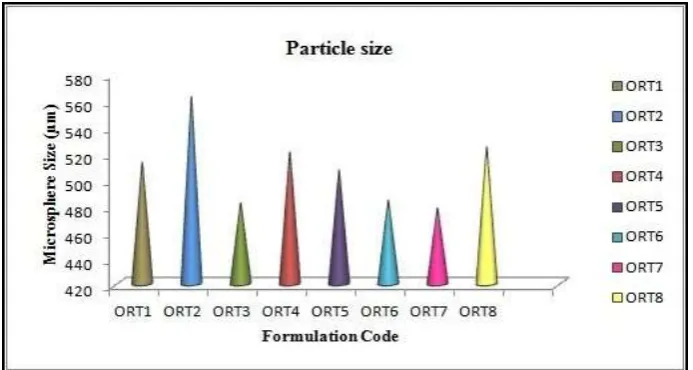
The mean particle size of microspheres (in µm) of both the batches are depicted in Table: 5.
Table 5: Mean particle size of ornidazole microspheres with tragacanth gum and Inulin Formulation
code
Microspheres with tragacanth gum (µm)
Formulation code
Microspheres with inulin (µm) ORT1 512.0 ORI1 473.5
ORT2 562.1 ORI2 458.1
ORT3 481.2 ORI3 442.7
ORT4 519.7 ORI4 454.3
ORT5 506.3 ORI5 423.5
ORT6 483.2 ORI6 450.4
ORT7 477.4 ORI7 435.0
ORT8 523.6 ORI8 462.0
[image:9.595.77.509.203.377.2]Figure 2: Particle size of microspheres prepared with tragacanth gum
The graph plotted in “Fig”: 3 shows the comparison of microspheres size prepared with inulin.
Figure 3: Particle size of microspheres prepared with inulin
[image:10.595.123.472.352.540.2]Evaluation of flow properties of all formulation batches
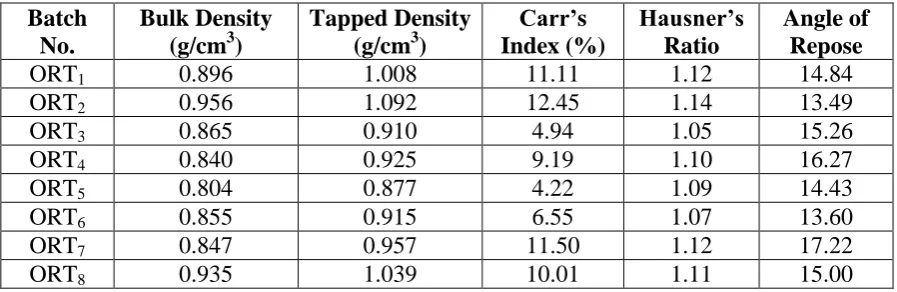
The microspheres of all the formulation batches with tragacanth gum and inulin were evaluated for the flow properties. In Table 6 and 7 all the flow properties determinant parameters of microspheres are given with value.
Table 6: Evaluation of flow properties of all formulation batches with tragacanth gum Batch
No.
Bulk Density (g/cm3)
Tapped Density (g/cm3)
Carr’s Index (%) Hausner’s Ratio Angle of Repose
ORT1 0.896 1.008 11.11 1.12 14.84
ORT2 0.956 1.092 12.45 1.14 13.49
ORT3 0.865 0.910 4.94 1.05 15.26
ORT4 0.840 0.925 9.19 1.10 16.27
ORT5 0.804 0.877 4.22 1.09 14.43
ORT6 0.855 0.915 6.55 1.07 13.60
ORT7 0.847 0.957 11.50 1.12 17.22
[image:11.595.74.523.188.334.2]ORT8 0.935 1.039 10.01 1.11 15.00
Table 7: Evaluation of flow properties of all formulation batches with inulin Batch
No.
Bulk Density (g/cm3)
Tapped Density (g/cm3)
Carr’s Index (%) Hausner’s Ratio Angle of Repose
ORI1 0.910 1.058 13.98 1.16 10.75
ORI2 0.933 0.997 6.41 1.06 13.22
ORI3 0.875 0.942 7.11 1.07 16.06
ORI4 0.910 0.976 6.76 1.07 13.00
ORI5 0.933 0.989 5.66 1.06 12.57
ORI6 0.886 0.972 8.84 1.09 11.87
ORI7 0.898 1.000 10.20 1.11 12.18
ORI8 0.910 0.992 8.26 1.09 12.57
Bulk density values of both batches of microspheres were found to be in the range of 0.804-0.956 g/cm3 while the corresponding tapped density values were in the range of 0.877-1.092 g/cm3. The values of Carr’s index for all the batches were found out to be less than 15, values of Hausner’s ratio was also found to be less than 1.25 and values of angle of repose is less than 20 indicating that formulations of all the batches were excellent flow properties. Hence, it concluded that microspheres are easily filled in hard gelation capsules.
Determination of entrapment efficiency
Table 8: Entrapment efficiency of alginate microspheres Formulation
code
Entrapment efficiency (%)
Formulation code
Entrapment efficiency (%) ORT1 91.62±0.28 ORI1 84.60±0.26
ORT2 88.87±0.30 ORI2 89.44±0.41
ORT3 92.80±0.08 ORI3 83.02±0.15
ORT4 94.99±0.21 ORI4 86.47±0.25
ORT5 85.82±0.18 ORI5 81.60±0.18
ORT6 75.07±0.31 ORI6 78.10±0.13
ORT7 77.13±0.21 ORI7 74.18±0.09
ORT8 87.83±0.47 ORI8 82.58±0.33
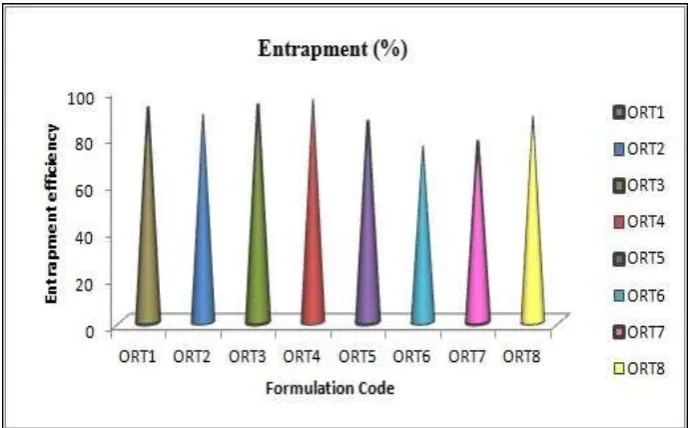
Entrapment efficiency of ornidazole microspheres prepared with tragacanth gum and inulin was found to be 83.02% to 94.99% (ORT1-ORT4, ORI1-ORI4). Reduced entrapment
efficiency was observed in microspheres prepared with increased amount of glutaraldehyde (ORT5-ORT8, ORI5-ORI8) ranging from 74.18% to 87.83%.
The entrapment efficiency of ornidazole microsphere for all the batches prepared with tragacanth gum are shown in “Fig”: 4.
Figure 4: Entrapment efficiency of ornidazole microspheres prepared with tragacanth gum.
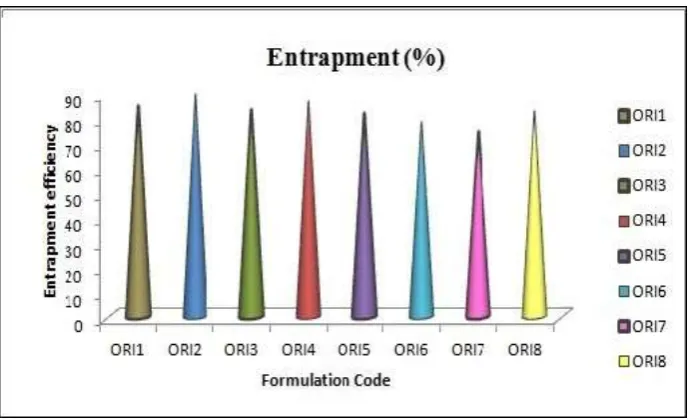
[image:12.595.125.470.400.614.2]Figure 5: Entrapment efficiency of ornidazole microspheres with inulin
Entrapment efficiency decreased as concentration of crosslinker (glutaraldehyde) increased. Such decreasing trend is due to increasing cross link density. The microspheres became rigid thereby free volume space within polymer matrix reduced which resulted a reduction in encapsulation efficiency.
In-vitro dissolution study
In vitro dissolution studies were performed to predict the dissolution profile during transit of
dosage form from stomach through small intestine and finally reaching to colon environment. The dissolution studies were performed using USP II (basket type) dissolution apparatus in 250 mL of dissolution fluid. Use of small volume of buffer solution in this study help in better detection of drug concentration. Microspheres was encapsulated in hard gelatin capsule coated by double layer of Eudragit S100 which help in preventing leaching out of microspheres. The stirring speed was set 50 rpm and temperature was maintained 37±0.5°C throughout dissolution study. The pH of medium was kept as 1.2 pH for initial 2nd hr, 7.4 for next 3rd hr and pH 6.8 upto 12th hr. Samples were withdrawn every hr and analyzed for absorbance at UV spectrophotometer.
ORT batches (ornidazole-tragacanth gum microspheres)
Table 9: In Vitro % Cumulative drug release from microspheres of batches ORT1 to
ORT8
Time
(hr) ORT1 ORT2 ORT3 ORT4 ORT5 ORT6 ORT7 ORT8
0 0 0 0 0 0 0 0 0 1 0.69 0.69 1.38 0.69 0.69 0.69 0.69 0.69 2 1.38 2.07 2.77 1.38 1.38 2.76 2.07 1.38 3 4.23 4.23 6.12 8.46 4.23 6.59 7.53 5.66 4 5.2 8.02 8.51 15.09 7.08 10.39 11.79 9.921 5 12.74 13.23 12.78 24.1 11.34 14.67 16.56 15.14 6 19.68 19.26 19.28 30.25 17.94 20.61 21.49 21.04 7 27.18 30.24 25.91 40.41 23.26 23.76 26.39 27.24 8 35.59 42.58 34.31 51.07 36.43 26.94 32.62 33.48 9 42.92 44.55 46.67 68.74 44.89 39.26 37.15 35.84 10 52.56 47.41 57.8 75.21 46.01 47.73 43.44 37.34 11 58.06 56.36 63.33 76.49 48.87 48.43 49.76 52.76 12 67.15 63.19 71.07 78.64 54.35 50.43 54.38 64.34
The graphical representation of dissolution profile of different batches prepared with tragacanth gum are shown in “Fig”: 6.
[image:14.595.84.493.101.330.2] [image:14.595.74.522.394.731.2]
The dissolution profiles of ornidazole microspheres with polymer tragacanth gum in stimulated gastrointestinal fluids showed in different patterns and release in pH 7.4 and phosphate buffer 6.8 without enzyme.
Only 0.69% to 2.76% release in upper gastrointestinal tract environment at the end of 2 h. 4.23% to 24.10 % drug release was observed at pH 7.4 at the end of 5 h. In phosphate buffer 6.8 without enzyme the drug release was found to be 19.26% to 78.64 %. The increase in release pattern of drug from microspheres occurred due to high swelling of microspheres as they passes from pH 1.2 to pH 7.4. The dissolution profile showed that by increasing the concentration of glutaraldehyde (cross linker) in formulation gradually decrease in cumulative drug release.
Data obtained from in- vitro drug release analysis were represented in table-25 and figure-29, a comparison can be conducted between formulation codes ORT1 and ORT5, ORT2 and
ORT6, ORT3 and ORT7, ORT4 and ORT8 on the basis of immediate release profile and
sustained release drug profile. ORT1, ORT2, ORT3 and ORT4 shows %CDR of 67.15%,
63.19%, 71.07% and 78.64% respectively with fast release pattern while ORT5, ORT6, ORT7
and ORT8 microspheres were found with %CDR as 54.35%, 50.43%, 54.38% and 64.34%
respectively.
Although latter one have lesser % CDR with respect to their compared one but all follows drug release pattern with sustained profile. This effect is due to increased amount of glutaraldehyde in later one batches. There was not a very big difference in drug retention pattern due to increased glutaraldehyde amount but release pattern was significantly affected leading to sustained release profile from immediate one.
ORI batches (ornidazole-inulin microspheres)
Table 10: In Vitro % Cumulative drug release from microspheres of batches ORI1 to
ORI8
Time
(hr) ORI1 ORI2 ORI3 ORI4 ORI5 ORI6 ORI7 ORI8
0 0 0 0 0 0 0 0 0
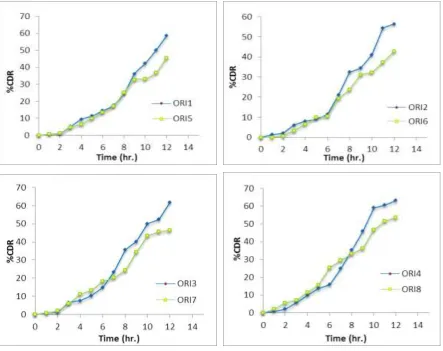
1 0.69 1.38 0.69 0.69 0.69 0 0.69 2.07 2 1.38 2.08 1.38 2.08 1.38 0.69 2.08 5.55 3 5.17 6.12 6.58 5.65 4.70 3.29 6.12 7.07 4 9.43 8.03 7.56 9.91 6.61 6.6 11.32 11.34 5 11.36 9.02 10.4 13.72 9.93 9.92 13.26 15.63 6 14.48 11.43 14.91 15.81 13.59 10.53 18.42 25.41 7 17.61 21.06 23.25 25.02 17.14 19.29 20.26 29.47 8 24.66 32.48 35.56 35.16 25.06 23.74 24.29 33.11 9 36.1 34.4 40.1 45.79 32.59 31.26 34.42 36.33 10 42.38 41.11 49.88 59.08 33.21 32.3 43.3 46.53 11 50.01 54.37 52.33 60.71 36.86 37.26 45.71 51.57 12 58.54 56.41 61.75 63.22 45.33 42.68 46.4 53.58 The graphical representation of dissolution profile of different batches prepared with inulin are shown in “Fig” 7.
[image:16.595.73.528.112.329.2] [image:16.595.74.518.382.733.2]
The in vitro dissolution profiles of ornidazole microspheres with polymer inulin in stimulated gastrointestinal fluids showed in different patterns and release in pH 7.4 and phosphate buffer 6.8 without enzyme. Only 0.01% to 5.55% release in upper gastrointestinal tract environment at the end of 2 h. 3.29% to 15.63 % drug release was observed at pH 7.4 at the end of 5 h. In phosphate buffer 6.8 without enzyme the drug release was found to be 10.53% to 63.22 %. The increase in release pattern of drug from microspheres occurred due to high swelling of microspheres as they passes from pH 1.2 followed to pH 7.4. The dissolution profile showed that by increasing the concentration of glutaraldehyde (cross linker) in formulation gradually decrease in cumulative drug release.
Data obtained from in- vitro drug release analysis were represented in table-26 and figure-30, a comparison can be conducted between formulation codes ORI1 and ORI5, ORI2 and ORI6,
ORI3 and ORI7, ORI4 and ORI8 on the basis of immediate release profile and sustained
release drug profile. ORI1, ORI2, ORI3 and ORI4 shows %CDR of 58.54%, 56.41%, 61.75%
and 63.55% respectively with fast release pattern while ORI5, ORI6, ORI7 and ORI8
microspheres were found with %CDR as 45.33%, 42.68%, 46.40% and 53.58% respectively. Although latter one have lesser % CDR with respect to their compared one but all follows drug release pattern with sustained profile. This effect is due to increased amount of glutaraldehyde in later one batches. There was not a very big difference in drug retention pattern due to increased glutaraldehyde amount but release pattern was significantly affected leading to sustained release profile from immediate one.
The % CDR was overall less in microspheres prepared with inulin compared to microspheres prepared with tragacanth gum. This effect is credited to formation of a complex between the two polysaccharides might at a neutral Ph due to the hydrogen bonding, hydrophobic forces and formation of an interjunction zone with conformational changes of polysaccharides.
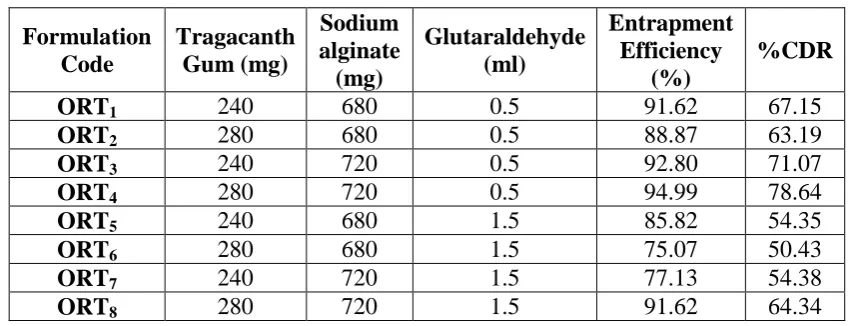
Selection of best batch from different Prototype formulations
Table 11: Prototype formula for microspheres of ornidazole with tragacanth gum Formulation Code Tragacanth Gum (mg) Sodium alginate (mg) Glutaraldehyde (ml) Entrapment Efficiency (%) %CDR ORT1 240 680 0.5 91.62 67.15
ORT2 280 680 0.5 88.87 63.19
ORT3 240 720 0.5 92.80 71.07
ORT4 280 720 0.5 94.99 78.64
ORT5 240 680 1.5 85.82 54.35
ORT6 280 680 1.5 75.07 50.43
ORT7 240 720 1.5 77.13 54.38
ORT8 280 720 1.5 91.62 64.34
The results concluded from Table: 11 that ORT3 and ORT4 showed max % CDR & maximum
% EE but the batch ORT4 showed max % cumulative drug release (78.64%) and %
entrapment (94.99%).
Table 12: Prototype formula for microspheres of ornidazole with inulin Formulation Code Tragacanth Gum (mg) Sodium alginate (mg) Glutaraldehyde (ml) Entrapment Efficiency (%) %CDR ORI1 240 680 0.5 84.60 58.54
ORI2 280 680 0.5 89.44 56.41
ORI3 240 720 0.5 83.02 61.75
ORI4 280 720 0.5 86.47 63.22
ORI5 240 680 1.5 81.60 45.33
ORI6 280 680 1.5 78.10 42.68
ORI7 240 720 1.5 74.18 46.40
ORI8 280 720 1.5 82.58 53.58
In the next formulation batch shown in Table: 12, the results concluded that the batch ORI4
showed maximum % cumulative drug release (63.22%) and ORI2 showed maximum %
entrapment efficiency (94.99%).
On the basis of above observations, ORT4 and ORI4 are concluded to be the best prototype
formulation.
Characterization of best batches ORT4 and ORI4
Swelling studies
temperature of 37°C, means in terms of percentage weight gained by microspheres. It was found that swelling of microspheres was occurred in stomach and it was gradually increasing when microspheres were transferred to intestine. As microspheres are prevented from acidic 1.2 pH, the swelling studies are also performed by escaping this medium. This study was mentioned in table form and it is given below. As microspheres are prevented from 0.1N HCl medium in final dosage form, swelling studies are also performed by escaping this medium as shown in Table: 13 given below. Chosen formulation ORT4 and ORI4 for swelling studies
because the release rate is better as compare to other formulations.
Table 13: % Swelling Index of microspheres at different physiological pH. Formulation
Code
% Swelling Index
at 1.2 pH At 7.4 pH at 6.8 pH ORT4 13.5 16.8 19.2
- 11.4 15.3
ORI4 9.7 12.1 16.4
- 10.4 12.8
CONCLUSION
From the conclusions of the results, the research study showed that the microspheres of ORT4
batch was selected as colon targeted drug delivery as it shows no release of drug in stomach and upper git and shows the sustained release effect in the colon. This is due to swelling nature of the tragacanth gum. Microspheres prepared with inulin polymer, which is hydrophilic polymer, and shows the instant release of drug when reaches in the colon as compared to the tragacanth gum microspheres.
REFERENCES
1. Sowmya C, Reddy CS, Neelabonia VP, Reddipalli S, Komaragiri K. Colon specific drug delivery systems: a review on pharmaceutical approaches with current trends. Int Res J Pharm., 2012; 3(7): 45-55.
2. Choudhury PK. Novel approaches and development in colon specific drug delivery systems- a review. Webmed Central., 2012; 1-20.
3. Challa T, Vynala V, Allam KV. Colon specific drug delivery systems: a review on primary and novel approaches. Int J Pharma Sci Rev Res., 2011; 7(2): 171-181.
5. Lachman L, Leiberman HA. The theory and practice of industrial pharmacy. Special Indian ed., India: CBS Publisheres and Distributors Pvt. Ltd., 2009; 183-184.
6. Carter SJ. Cooper and Gunn’s Tutorial Pharmacy. 6th ed., New Delhi: CBS Publishers and Distributors., 1986; 211-233.
7. Choudhury PK, Murthy PN, Tripathy NK. Development of Acrycoat- L100 coated calcium alginate microspheres for colon specific delivery of ornidazole. Int J Adv Pharma Res., 2012; 5: 914-921.
8. Keshavayya J, Bhat SK, Kulkarni VH, Reddy VKR, Kulkarni AR, Kulkarni PV. Preparation, characterization and in-vitro release studies of enteric coated gelatin capsules containing guar gum microspheres for targeted delivery of 5-fluorouracil to colon. Der Pharma Chem., 2013; 5(3): 221-231.
9. Dahiya S, Tyagi L. Preparation and evaluation of oxytetracycline hydrochloride microbeads for delayed release. Pak J Pharm Sci., 2008; 103-108.
10.Soad AY, Ahmed HE, Ibrahim S, Ahmed HS. Optimization of budesonide compression-coated tablets for colonic delivery. AAPS Pharm Sci Tech., 2009; 10(1): 147-157.
11.Shukla RK, Trivedi P, Ramteke S, Tiwari A. Preparation and characterization of cross- linked guar gum microspheres: optimization using factorial design. Chem Pharm Bull. 2011; 59(2): 185-190.
12.Gouda MM, Shabaraya AK, Kumar SMS. Formulation and evaluation of colon specific microbial degradable matrix tablet using sterculia gum as carrier. Int Curr Pharma J., 2012; 1(11): 376-383.
13.Alli SMA. Formulation and evaluation of Bacillus coagulans- loaded hypromellose mucoadhesive microspheres. Int J Nanomed., 2011; 6: 619-629.
14.Donskey CJ, Hoyen CK, Das SM, Farmer S, Dery M, Bonomo RA. Effect of oral Bacillus coagulans administration on the density of vancomycin-resistant Enterococci in the stool of colonised mice. Lett App Microb., 2001; 33: 84-88.