FORMULATION AND EVALUATION OF MONOLITHIC OSMOTIC
TABLET OF VALSARTAN
Aher Smita S.1*, Gawai Mamata N.2, Saudagar Ravindra B.3 1
Department of Analytical Chemistry, R. G. Sapkal College of Pharmacy, Anjaneri,
Nashik- 422 213, Maharashtra.
2
Department of Quality Assurance Techniques, R. G. Sapkal College of Pharmacy, Anjaneri,
Nashik- 422 213, Maharashtra.
3
Department of Pharmaceutical Chemistry, R. G. Sapkal College of Pharmacy, Anjaneri,
Nashik- 422 213, Maharashtra.
ABSTRACT
Valsartan is an orally active and specific angiotensin II antagonist
acting on the AT1 receptor subtype and belongs to the class of
antihypertensive agents. Monolithic Osmotic Tablet of Valsartan were
developed using Sodium chloride as a key ingredient which gives
osmogent property which provides driving force inside the core tablet
and which leads to release of drug. Microcrystalline cellulose used as a
release retardant material in the present work. Different formulations
were prepared by varying the concentrations using 32 factorial design.
It was applied to see the effect of variables Sodium chloride and
MCCon the response percentage drug release as a dependent variable.
These formulations were evaluated for, Hardness, Flow property,
Thickness, Friability, Drug content and In-vitro drug release. Tablets were coated with a
semipermeable membrane using 5% w/v cellulose acetate in acetone and PEG 400(15%)
used as Plasticizer. Coated Monolithic osmotic tablets were drilled for delivery orifice using
standard micro drill of diameter size 0.6 mm on both side of tablet. Drug release rate was
increased as the increase in the concentration of sodium chloride and release rate decreased
on increasing the concentration of MCC. SEM Study carried out for detection of diameter
size of delivery orifices. The FTIR studies demonstrate that there was no interaction between
polymer and drug. The optimized formulation was stable for 6 months of accelerated stability
study.
Volume 5, Issue 7, 2022-2037. Research Article ISSN 2277– 7105
*Corresponding Author Aher Smita S.
Department of Analytical
Chemistry, R. G. Sapkal
College of Pharmacy,
Anjaneri, Nashik- 422
213, Maharashtra. Article Received on 22 May 2016,
Revised on 13 June 2016, Accepted on 03 July 2016
KEYWORDS: Valsartan, MCC, NaCl, Monolithic Osmotic Tablet.
INTRODUCTION
The development of improved method of drug delivery has received a lot of attention in the
last two decades. The basic rational for controlled drug delivery is to alter the
pharmacokinetics and pharmacodynamics of pharmacologically active moieties by using
novel drug delivery systems and pharmacological parameters inherent in the selected route of
administration. Rate controlled dosage form and less or not at all, a property of the drug
molecules inherent kinetic properties. It has been employed as pharmaceutically active agent
for the treatment of hypertension. It shows high solubility in gastric pH and falls rapidly in
intestinal pH .The biological half-life is 7.5 hours. Hypertension is an abnormal condition of
heart in which level of blood pressure is determine by the amount of blood heart pumps and
the amount of resistance to blood flow in the arteries. Treatment of hypertension may require
continuous supply of drug to the heart Single dose from that provides particular plasma
profile of Valsartan is desirable. Conventional formulations may require high dosing
frequency to maintain the drug within the therapeutic concentration hence it is necessary to
formulate Osmotically tablet of Valsartan.
In Monolithic Osmotic Tablet the delivery of a drug is in the form of a solution that release
the active material at sustained rates. These systems work with the principle of osmosis;
osmotic pressure is produced by active material in .itself and/or an accompanying osmotic
agent. Preparation consists of the core that contains the active material and a semipermeable
membrane that coats the core, having an orifice size 0.5 to 0.9 mm. valsartan is gastric irritant
in nature. To overcome this problem cellulose acetate coating is applied to the core tablet.
The aim of this study was to develop Monolithic Osmotic Tablet of Valsartan by using 32 full
factorial design. Sodium chloride is a key ingredient which gives osmagent property which
provides driving force inside the core tablet which leads to release of drug and
microcrystalline cellulose used as a release retardant material. Core tablet was coated by
cellulose acetate 10% and PEG400 5% used as a plasticizer. Tablets were drilled 0.5mm on
both side using mechanical driller.
MATERIAL AND METHODS
Valsartan was obtained as a gift sample from Aarti drugs, Mumbai. Cellulose acetate, Sodium
Drug-Excipients Interactions
The physicochemical compatibilities of the drug and excipients were tested by FT-IR
[image:3.595.114.485.146.328.2]spectrometry. FT-IR spectra of the drug alone and drug-excipients physical mixtures.
Fig 1: FT-IR Spectra of Valsartan.
The FTIR spectra of pure Valsartan showed the peaks at wave numbers (cm-1) which
correspond to the functional groups present in the structure of the drug.
Infra-red spectra of drug and polymer mixture showed matching peaks with the drug spectra.
The characteristic peak of drug was also seen in the spectra of physical Mixture.
Fig 2: FT-IR Spectra of Physical Mixture. Factorial Design
The application of mathematical optimization in the pharmaceutical field was first reported
[image:3.595.111.487.480.665.2]A factorial design is used to evaluate two or more factors simultaneously. The treatments are
the combinations of levels of the factors. The advantages of factorial design over one factor at
a time experiment are that they are more efficient and they allow interactions to be detected.
Intervention studies with 2 or more categorical explanatory variables leading to a numerical
outcome variable are called as” Factorial design “. A factor is simply a categorical variable
with 2 or more values referred to as levels. A study in which there are 2 factors with 3 levels
is called as 32 Factorial designs. For present work 32 Factorial designs was selected.
In this design, 2s factors were evaluated each at 3 levels and experimental trials were
performed at all 9 possible combinations as reflected.
Table No. 1 Composition of Monolithic Osmotic Pump Tablet as per Factorial Design (All values are expressed in mg)
Ingredients Formulation code
Quantity(mg) F1 F2 F3 F4 F5 F6 F7 F8 F9
Valsartan 40 40 40 40 40 40 40 40 40
Sodium chloride 5 7 9 5 7 9 5 7 9
Microcrystalline cellulose 125 125 125 150 150 150 175 175 175
Starch 75 73 71 50 48 46 25 23 21
Magnesium Stearate 5 5 5 5 5 5 5 5 5
Total Weight (mg.) 250 250 250 250 250 250 250 250 250
Method of preparation of Core tablet of Valsartan:
Core tablets of Valsartan was prepared by wet granulation method. The compositions of core
tablets are given in table 1. Valsartan was mixed with Sodium chloride, starch and
Microcrystalline cellulose these powder blend was knead in the mortar and pestle for 15-20
min .The blend was granulated using starch as a binder in water. Wet mass was formed;
resulting wet mass was passed through sieve # 22. Granules were dried in oven at 50°C for 2
hrs. Dried granules were lubricated with magnesium stearate. Lubricated blend was evaluated
for powder characteristics and flow properties like bulk density, tapped density, Carr index,
Angle of repose, and Hausner’s ratio. Then desired amount of blend was compressed in to the
tablet using Rimek tablet punch machine equipped with 8 mm punch, Weight of the tablet
was kept to 250 mg.
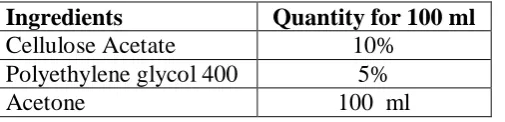
Coating of Osmotic Tablet
The core tablets of Valsartan were coated with 10% w/v Solution of Cellulose acetate in
plasticizer .The tablets were warmed to 40±2°c before applying coating solution .The
composition of coating solution used for coating of core tablets is given in (Table 2).
Dip coating technique was used for the coating of osmotic tablet. Coating was continued until
desired weight gain (10%) was obtained and tablets were dried at 50°C for 10 h. before
[image:5.595.176.429.223.284.2]further evaluation.
Table No. 2: Coating composition.
Ingredients Quantity for 100 ml
Cellulose Acetate 10%
Polyethylene glycol 400 5%
Acetone 100 ml
Drilling
For the coated tablets, a small orifice were drilled through both side of each coated tablet by
standard mechanical drilling technique using 0.5 mm needle. Orifice size was 0.5 mm.
RESULTS
1. Evaluation of Powder Bulk
Many different types of angular properties have been employed to assess flow ability, of
these; angle of repose is the most relevant. Repose angle of the powder was investigated. The
value of Angle of repose (°θ) decreased after the addition of lubricant. Angle of repose (°θ) is
an indicative parameter of powder flow ability from hopper to die cavity. The angles of
repose of all the formulations were within the range of 40°–53° indicative of excellent and
good flow ability. Bulk density may influence compressibility, tablet porosity, dissolution
and other properties and depends on the particle size, shape and tendency of particles to
adhere together. The bulk density of powder was found to be between 0.37-0.39 gm/cm3. The
value indicates good packing capacity of granules. The tap density of the granules of factorial
design batches were found in the range of 0.42-0.48gm/cm3. The bulk density and tap density
was used to calculate the percent compressibility of the powder.
The compressibility index of the Powder was observed in range of 11 to 22, indicating good
compressibility of the granules. The values of the Hausner’s ratio were found to be in the
range of 1.12 to 1.27 indicating good and fair flow ability. Data is summarized in (Table No.
Table No. 3: Evaluation of Powder. Formulati on code Angle of repose(θ) Mean± S.D Bulk density (gm/cm3) Mean± S.D
Tapped density (gm/cm3) Mean± S.D
Compressibili ty index (%) Mean± S.D
Hausner’s ratio Mean± S.D F1 42.03 ± 0.04 0.391± 0.0045 0.48± 0.0068 18.78±2.122 1.23±0.031
F2 40.55 ± 0.52 0.386± 0.0034 0.43± 0.0438 10.81±1.469 1.12±0.018
F3 45.37 ± 0.88 0.388± 0.0034 0.44± 0.0045 11.91 ±1.674 1.13±0.021
F4 48.90 ± 0.71 0.375± 0.0032 0.42± 0.0040 11.00±0.010 1.12±0.018
F5 47.68 ± 1.06 0.376± 0.0032 0.43± 0.0043 13.55 ±1.412 1.15±0.011
F6 52.74 ± 0.37 0.380± 0.0033 0.45± 0.0046 15.72 ±0.813 1.18±0.786
F7 48.55 ± 0.69 0.371± 0.0031 0.47±0.0052 21.79 ±0.012 1.27±0.786
F8 46.39 ± 1.39 0.382± 0.0033 0.46± 0.0049 16.83± 1.405 1.20±0.020
F9 46.77 ± 1.17 0.388± 0.0034 0.46± 0.0149 15.54± 1.439 1.18±0.020
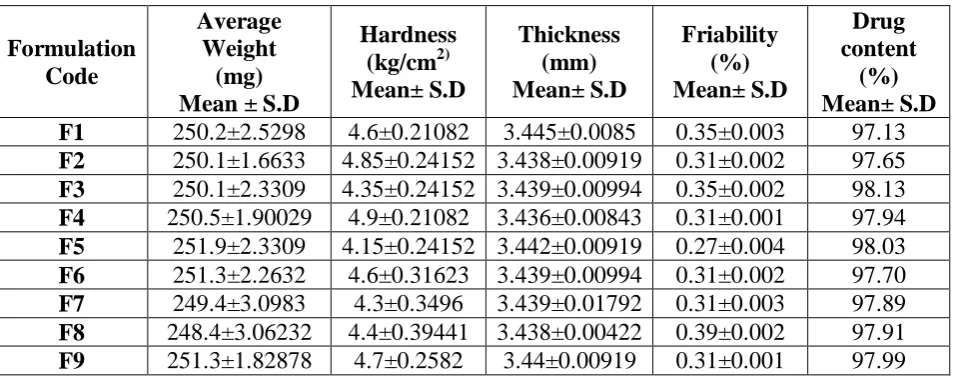
2. Evaluation of Tablets A) Pre coating evaluation
All formulated coated osmotic tablet batches were evaluated for weight variation, hardness,
thickness, friability and drug content. Weight variation, hardness, thickness, friability and
drug content of uncoated tablet were found within the range.
All f9ormulated osmotic core tablet batches were shiny white with smooth surface, with good
texture. The Average weight of the tablets was found to be 250 mg. Thickness of the tablet
was found to be 3.4 mm, Hardness of the tablet was found 4.15-4.9 kg/cm2, Friability of the
tablets was found to be 0.27-0.39% and Drug content of the tablet was found to be 97-98%.
Due to constant tablet press setting across all batches irrespective of weight variation. This
[image:6.595.61.541.551.742.2]ensured good mechanical strength (Table 4).
Table No. 4: Pre coating evaluation parameters of osmotic tablet. Formulation
Code
Average Weight
(mg) Mean ± S.D
Hardness (kg/cm2) Mean± S.D Thickness (mm) Mean± S.D Friability (%) Mean± S.D Drug content (%) Mean± S.D F1 250.2±2.5298 4.6±0.21082 3.445±0.0085 0.35±0.003 97.13
F2 250.1±1.6633 4.85±0.24152 3.438±0.00919 0.31±0.002 97.65
F3 250.1±2.3309 4.35±0.24152 3.439±0.00994 0.35±0.002 98.13
F4 250.5±1.90029 4.9±0.21082 3.436±0.00843 0.31±0.001 97.94
F5 251.9±2.3309 4.15±0.24152 3.442±0.00919 0.27±0.004 98.03
F6 251.3±2.2632 4.6±0.31623 3.439±0.00994 0.31±0.002 97.70
F7 249.4±3.0983 4.3±0.3496 3.439±0.01792 0.31±0.003 97.89
F8 248.4±3.06232 4.4±0.39441 3.438±0.00422 0.39±0.002 97.91
B) Post coating evaluation
All formulated coated osmotic tablet batches were evaluated for Weight variation, thickness
and Film thickness. After coating of the tablets average weight of tablets was found to be
256.2 mg., thickness of coated tablet was found to be 3.78-3.80 mm and thickness of film
was found to be 0.36 mm. Due to uniform coating weight variation and thickness of coated
tablet was found within the range. Evaluated data is shown in (Table 5).
Table No. 5: Post coating evaluation parameters of Osmotic Tablet. Formulation
Code.
Average Weight (mg)
Mean
Thickness of coated tablet
Mean
Thickness of film(mm)
Mean
F1 254.4 3.805 0.358
F2 255.4 3.803 0.365
F3 256.1 3.796 0.356
F4 255.2 3.788 0.352
F5 253.7 3.799 0.357
F6 256.4 3.801 0.362
F7 255.8 3.789 0.355
F8 256.6 3.785 0.344
F9 256.7 3.785 0.350
From above evaluated data of coated osmotic tablet it was confirmed that weight variation
and thickness of film was found within the range.
C) Diameter of delivery orifice
Evaluation of diameter size of delivery orifices were measured by Scanning Electron
Microscope and were found to be 528um (Upper) and 583um (Lower) SEM data give in fig
3.
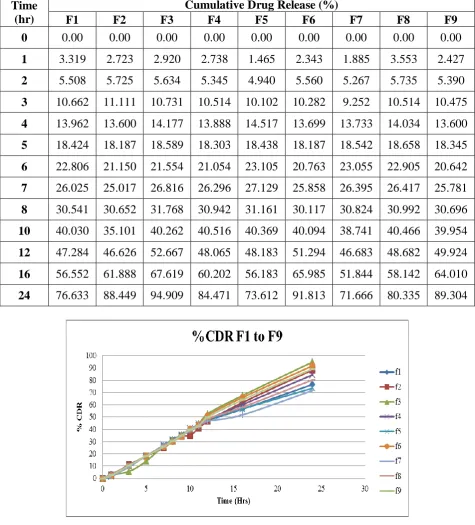
3. In Vitro Dissolution study of Formulations (F1-F9)
Osmotic tablets were subjected to In-vitro drug release studies in simulated gastric and
intestinal fluid. Dissolution study was performed in 0.1 N HCl for 2 hrs and for remaining 22
hrs. in Phosphate buffer pH 6.8, obtained result summarized in (Table No. 6).
Table No.6: Cumulative Drug Release of Formulations (F1-F9) Time
(hr)
Cumulative Drug Release (%)
F1 F2 F3 F4 F5 F6 F7 F8 F9
0 0.00 0.00 0.00 0.00 0.00 0.00 0.00 0.00 0.00
1 3.319 2.723 2.920 2.738 1.465 2.343 1.885 3.553 2.427
2 5.508 5.725 5.634 5.345 4.940 5.560 5.267 5.735 5.390
3 10.662 11.111 10.731 10.514 10.102 10.282 9.252 10.514 10.475
4 13.962 13.600 14.177 13.888 14.517 13.699 13.733 14.034 13.600
5 18.424 18.187 18.589 18.303 18.438 18.187 18.542 18.658 18.345
6 22.806 21.150 21.554 21.054 23.105 20.763 23.055 22.905 20.642
7 26.025 25.017 26.816 26.296 27.129 25.858 26.395 26.417 25.781
8 30.541 30.652 31.768 30.942 31.161 30.117 30.824 30.992 30.696
10 40.030 35.101 40.262 40.516 40.369 40.094 38.741 40.466 39.954
12 47.284 46.626 52.667 48.065 48.183 51.294 46.683 48.682 49.924
16 56.552 61.888 67.619 60.202 56.183 65.985 51.844 58.142 64.010
[image:8.595.60.536.193.718.2]24 76.633 88.449 94.909 84.471 73.612 91.813 71.666 80.335 89.304
4. Optimization
Statistics are apply to the results obtained from General Factorial Design in which Two
independent Variables varied namely Sodium chloride (NaCl) (X1) and Microcrystalline
cellulose MCC (X2) and their effect is recorded on dependent Variable namely % drug
release (Y1).
Evaluation and interpretation of research findings are almost important and the p-value serves
a valuable purpose in these findings. (Table No. 7) shows ANOVA for the dependent variable
% drug release. The values of X1 and X2 were found to be significant at p < 0.05, hence
confirmed the significant effect of both the variables on the selected responses. Decreasing
the concentration of the Sodium chloride (NaCl) and microcrystalline cellulo se (MCC)
resulted in the decrease in the release of quetiapine. Variable caused significant change in the
responses. From this data optimum concentration of NaCl 09 mg and MCC 125 mg was
found.
A) Drug release
Table No. 7: ANOVA for % drug release (Y1) Source Sum of
Squares
Degree of Freedom
Mean
Square F value P-value Inference
Model 504.075 2 252.37 10.94 0.0100 Significant
A-NaCl 387.53 1 387.53 16.80 0.0064
B-MCC 117.22 1 117.22 5.08 0.0651
Standard deviation = 4.80
R-Squared = 0.7848
The Model F-value of 10.94 implies the model is significant. There is only a 0.01% chance
that a "Model F-Value" this large could occur due to noise. Values of "Prob > P" less than
0.0500 indicate model terms are significant. In this case A, B are significant model terms.
The Variance Inflation Factor (VIF) measured how much the variance of that model
coefficient was inflated by the lack of orthogonality in the design and was calculated for %
drug release. It was found to be near one indicating good estimation of the coefficient.
Similarly Ri-squared was near to zero which led to good model. The values of Prob > F were
less than 0.05, which indicated model terms were significant.
The quadratic model obtained from the regression analysis used to build a 3-D graph’s in
variables. The relationship between the response and independent variables can be directly
visualized from the response surface plots.
The response surface plot was generated using Design Expert 8.0.4 software presented in (Fig
5). To observe the effects of independent variables on the response studied % drug release.
From response surface 3 level factorial design was choosen using quadratic design mode.
Fig 5: Surface response plot showing effect of Sodium Chloride and Microcrystalline Cellulose on release.
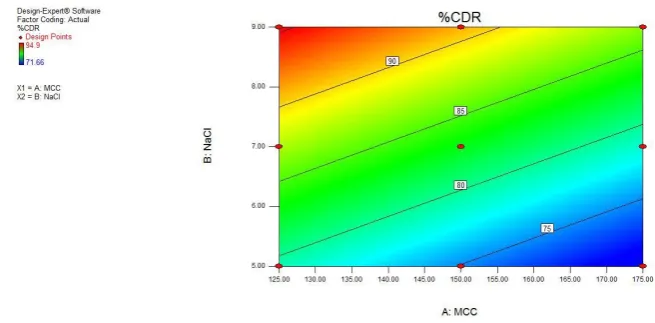
B) Contour plot
The contourplot showing effect of Sodium chloride and Microcrystalline cellulose on release
[image:10.595.131.443.213.400.2]is shown in (Fig 6).
[image:10.595.123.451.553.714.2]C) Design summary and Response summary
[image:11.595.225.449.225.430.2]Design summary is shown in (Table No. 8).
Table No. 8: Design Summary.
D) Perturbation plot
[image:11.595.90.503.577.755.2]The perturbation plot is shown in (Fig 7).
Fig 7: Perturbation. 5. Dissolution Kinetics
In present study dissolution were analyzed by PCP Disso Version 3 software to study the
dissolution kinetics is given in (Table 9).
Table No. 9: Kinetic treatment of prepared Valsartan osmotic tablet formulations. Formulation
code
Coefficient of determination (R2) Zero
order
First order
Higuchi square root
Hixon crowell
Korsemeyer plot
F1 0.9888 0.9845 0.9194 0.9957 0.9951
F2 0.9960 0.9229 0.8926 0.9650 0.9880
F3 0.9972 0.8844 0.8881 0.9499 0.9976
F4 0.9954 0.9582 0.9039 0.9849 0.9955
F5 0.9863 0.9898 0.9213 0.9969 0.9891
F6 0.9962 0.9146 0.8822 0.9986 0.9614
F7 0.9813 0.9921 0.9244 0.9963 0.9880
F8 0.9906 0.9756 0.9168 0.9928 0.9956
F9 0.9966 0.9251 0.8850 0.9666 0.9965
Factor Name Units Type Minimum Maximum -1 Actual +1 Actual Mean
A NaCl Mg Numeric 05.00 09.00 05 09 07
Different kinetic treatments (zero order, first order, Higuchi’s square root equation and
Korsmeyer treatment) were applied to interpret the release of Valsartan from different
matrices The best formulation i.e. optimized formulation F3 follow Zero order kinetics r2 =
0.9972 and n < 0.5 for all batches. So the drug release is of fickian releas.
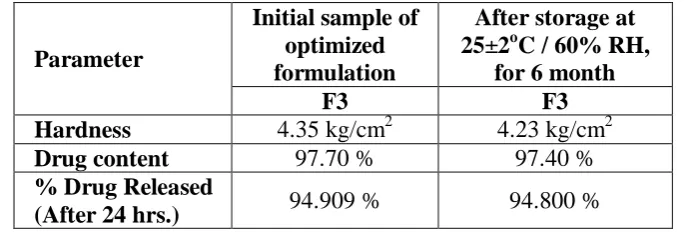
[image:12.595.126.474.209.325.2]6. Stability Studies
Table No. 10: Characteristics of optimized formulation F3 after 6 months storage.
Parameter
Initial sample of optimized formulation
After storage at 25±2oC / 60% RH,
for 6 month
F3 F3
Hardness 4.35 kg/cm2 4.23 kg/cm2
Drug content 97.70 % 97.40 %
% Drug Released
(After 24 hrs.) 94.909 % 94.800 %
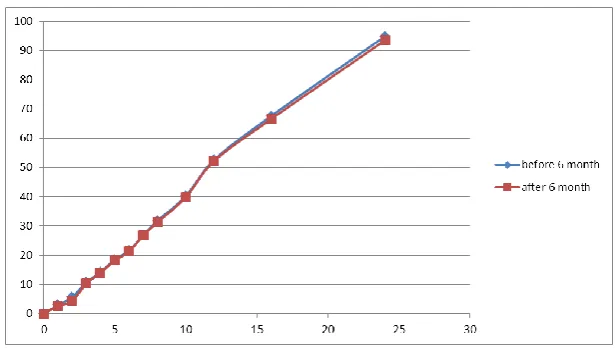
Table No. 11: In vitro drug release study of formulation F3 stored at 25ºC / 60% RH for 6 months.
Time (Hrs.)
Cumulative Drug Release (%) F3 Batch (Mean± S.D)
Cumulative Drug Release (%) F3 Batch (Mean± S.D)
Before 6 month After 6 month
0 0.00 0.00
1 2.920 2.620
2 5.634 4.356
3 10.731 10.258
4 14.177 13.985
5 18.589 18.198
6 21.554 21.256
7 26.816 26.783
8 31.768 31.245
10 40.262 39.875
12 52.667 52.265
16 67.619 66.588
Fig 8 : Dissolution profile of optimize F3 formulation before and after 6 month.
The selected formulation were wrapped in aluminium foil and stored at 25±2ºC temperature
for 6 months. After 6 months the formulation F3 were evaluated for the hardness, dug content
and in vitro % drug release. It was observed that there was no significant variation in the
physical appearance, average weight, hardness and loss of drying after placing the tablets at
various temperature and humidity conditions for a period of 6 months. Also the cumulative %
drug release data showed that each of the formulation released a drug amount, within the
limits laid down as per the ICH guidelines for stability studies.
CONCLUSION
The results of experimental studies of Valsartan osmotic tablets proved that the granules of
Valsartan showed good flow properties, tablet evaluation tests are within the acceptable
limits, IR spectral analysis proved that there was no drug-excipients interaction, the kinetic
studies revealed that optimized formulation followed zero order drug release kinetics and
stability studies revealed that all the formulations were found to be stable after storing at
temperature of 45o ± 2o, 75% ± 5% relative humidity for 6 months. Thus the results of the
above study clearly indicated that Developed osmotically sustained release tablet of Valsartan
provide release of drug at a predetermined rate and for a predetermined time in sustained
manner.
REFERENCES
1. Lachman. L, Libermann HA, Kaing JL. The theory and practice of industrial pharmacy;
CBS Publisher; Indian edition., 2009; 430.
2. Remington. The science and practice of pharmacy 21st ed. volume 1; Lippincott Williams
3. Yie WC. Novel drug delivery system. 2nd ed. Madison Avenue: Marcel Dekker, Inc.,
1992; 1-2.
4. Jain NK. Advance in Novel and controlled delivery. 1st edition, CBS publication Delhi.,
2005; 19-35.
5. Chien YW. Novel Drug Delivery System. Informa healthcare. Special edition; Second
edition; Revised and expanded., 50: 213.
6. Parmar N, Vyas S, Vaya N. Advances in controlled and novel drug delivery. 1st edition
CBS Publishers and distributors, 2005; 18-39.
7. Liu. X, Chen D, Zhang R. Evaluation of monolithic osmotic tablet system for nifedipine
delivery in vitro and in vivo. Drug Delivery and Industrial pharmacy., 2003; 27(7):
813-819.
8. Xian E, Lul Z, Qiang J. A water insoluble drug monolithic osmotic system utilizing gum
Arabic as an osmotic, suspending and expanding agent. Journal of controlled release.,
2003; 92: 375-382.
9. Gupta R, Gupta P. Osmotically controlled drug delivery system-a Review. International
Journal Pharmaceutical Science., 2009; 1(2): 269-275.
10.Singal D, Kumar H. Osmotic pump delivery novel approach. International journal of
research in pharmacy and chemistry., 2012; 2: 661-663.
11.Theeuwes F. Elementary Osmotic pump. Journal of Pharmaceutical Science., 1975; 64:
1887-1891.
12.Patha S, Dara P, Yamsani SK, Thadakapally R, Aukunural J. Development and
evaluation of oral elementary osmotic pump tablet for Ropinirole Hydrochloride. Indian
Drugs., 2012; 49(06): 23-30.
13.Pramod K, Sanjaysingh M B. Development and evaluation of elementary osmotic of
highly water soluble drug Tramadol Hydrochloride. Current Drug Delivery., 2009;
35(12): 130- 139.
14.Parmar N, Vyas S, Vaya N. Advances in controlled and novel drug delivery. 1st edition
CBS Publishers and distributors, 2005; 18-39.
15.Lachman L, Libermann H. The theory and practice of industrial pharmacy. CBS
Publisher, Indian edition., 2009; 455.
16.Xua L, Sanming L, Hisakaz S. Preparation and evaluation in vitro and in vivo of
Captropril elementary osmotic pump tablets. Asian Journal of Pharmaceutical Sciences.,
17.Vincent M, Nicoletta. L, Robert G. Approach to design push–pull osmotic pumps.
International Journal of Pharmaceutics., 2009; 376: 56–62.
18.Prabakaran D, Singh P, Kanaujia P, Vyas S. Modified push–pull osmotic system for
simultaneous delivery of Theophylline and Salbutamol: development and in vitro
characterization. International Journal of Pharmaceutics., 2004; 284: 95-108.
19.Longxiao L, Jeong K, Gilson K, Bong L, John M. Nifedipine controlled delivery by
sandwiched osmotic tablet system. Journal of Controlled Release., 2000; 68: 145-156
20.Zentner N, Gerald S, Kenneth J. The Controlled Porosity Osmotic Pump. Journal of
Controlled Release., 1985; 1: 269-282.
21.Hui L, Xing-Gang Y, Shu-Fang N, Lan-Lan W, Wei-San P. Chitosan-based controlled
porosity osmotic pump for colon-specific delivery system: Screening of formulation
variables and in vitro investigation. International Journal of Pharmaceutics., 2007; 332:
115-124.
22.Kumar P, Singh S. Colon Targeted Delivery Systems of Metronidazole Based on Osmotic
Technology, Development and Evaluation. Chem. Pharm. Bull., 2008; 56: 1234-1242.
23.Herbig S, Cardinal J, Korsmeyer R, Smith L. Asymmetric-membrane tablet coatings for
osmotic drug delivery. Journal of Controlled Release., 1995; 35: 127-136.
24.Philip A, Pathak K, Shakya P. Asymmetric membrane in membrane capsules a means for
achieving delayed and osmotic flow of cefadroxil. European Journal of Pharmaceutics
and Biopharmaceutics., 2008; 69: 658-666.
25.Philip A, Pathak K. Wet Process-Induced Phase-Transited Drug Delivery System: A
Means for Achieving Osmotic, Controlled, and Level AN IVIVC for Poorly
Water-Soluble Drug. Drug Development and Industrial Pharmacy., 2008; 34: 735-743.
26.Xiao-dong L, Wei-san P, Shu-fang N. Studies on controlled release effervescent osmotic
pump tablets from Traditional Chinese Medicine Compound Recipe. Journal of
Controlled Release., 2004; 96: 359-367.
27.Tang B, Gang C, Jian-Chun G, Cai-Hong X. Development of solid self-emulsifying drug
delivery systems: preparation techniques and dosage forms. Drug Discovery Today.,
2008; 13: 6-612.
28.Lanlan W, Jie L, Liangran G, Shufang N, Weisan P. Investigations of a Novel
Self-Emulsifying Osmotic Pump Tablet Containing Carvedilol. Drug Development and
Industrial Pharmacy., 2007; 33: 990–998.
29.Sutthilug S, Haslam P, Rao V, Valentino S. Release Mechanisms of a Sparingly
Sulfobutylether-b-Cyclodextrin as Both a Solubilizing and Osmotic Agent. Journal of pharmaceutical
sciences., 2009; 98: 1992-2000.
30.Guthmann. C, Lipp R, Wagner T, Kranz H. Development of a novel osmotically driven
drug delivery system for weakly basic drugs. European Journal of Pharmaceutics and
Biopharmaceutics., 2008; 69: 667-674.
31.Aulton, M. E. Eds. Pharmaceutics: The Science Of Dosage Form Design, Churchill
Livingstone: Edinburgh, 2005; 133.
32.Rabiu Y, Kok KP, Yvanne TF. Design of a 24 hours controlled porosity osmotic pump
system containing PVP formulation variables. Drug Development and Industrial
Pharmacy., 2009; 35(12): 1430-1438.
33.Paulo C, Jose MS. Modeling and comparison of dissolution profiles. European Journal of
Pharmaceutical Sciences., 2001; 13: 123-133.
34.Dash S, Murthy PN, Nath L, Choudhary P. Kinetic Modeling on drug release from
controlled drug delivery systems. Acto Poloniae pharmaceutica-drug research., 2010;
67(3): 217-223.
35.Shoaeb Mohammad Syed, Farooqui Z., Osmotic Drug Delivery System an Overview;
International Journal of Pharmaceutical Research and Allied Sciences., 2015; 4(3): 10-20.
36.Jerzewski RL, Chien YW. Osmotic drug delivery. In: A. Kydonieus (Ed.), Treatise on
Controlled Drug Delivery: Fundamentals, Optimization, Application, Marcel Dekker,
New York., 1992; 225–253.
37.Cortese R, Theeuwes F. Osmotic device with hydrogel driving member. US patent
4,327,725, May 4, 1982.
38.Wong PSL, Bardy B, Deters JC, Theeuwes F. Osmotic device with dual thermodynatic
activity. U. S. Patent 4,612,008. 16: 1986.
39.Longxiao L, Binjie C. Preparation of monolithic osmotic pump system by coating the
indented core tablet. European Journal of Pharmaceutics and Biopharmaceutics., 2006;
64: 180-184.
40.Theeuwes F, Swanson DR, Guittard G. Osmotic delivery system for the
beta-adrenoceptor antagonists metoprolol and Oxprenolol: design and evaluation of systems