STABILITY INDICATING RP-HPLC METHOD FOR THE
SIMULTANEOUS ESTIMATION OF ATOVAQUONE AND
PROGUANIL IN BULK AND TABLET DOSAGE FORM
S. Naazneen*1 and A. Sridevi2
1
Assistant Professor, St Mary’s College of Pharmacy, Secunderabad, Andhra Pradesh, India.
2
Professor, IPT, Sri Padmawathi Mahila VishwaVidyalayam, Tirupathi, Andhra Pradesh,
India.
ABSTRACT
The present work aimed to develop a stability indicating high
Performance Liquid Chromatographic (HPLC) validated method for
the cestimation of combined tablet formulation of Atovaquone and
Proguanil Hydrochloride. Chromatographic separation was optimized
by gradient HPLC on a C18 column [Inertsil Silica, 250 x 4.6 mm, 5µ]
utilizing a mobile phase consisting a mixture of 10mM ammonium
formate, pH 3.5 and 90:10 v/v acetonitrile - methanol in the ratio of
30:70 v/v at a flow rate of 0.9ml/min with UV detection at 254nm. The
retention time of Atovaquone and Proguanil Hydrochloride was 7.3
min and 3.8 min respectively. The developed method was validated as
per ICH guidelines. Linearity of the method was good over the concentration range 2.5μg/ml
to 20μg/ml for proguanil and 6.25-50 µg/ml for atovaquone. Correlation coefficient was
found to be 0.999&0.999 for proguanil & Atovaquone respectively. The % mean recovery of
proguanil (98.38-101.09.%) & atovaquone (98.62-100.99%) at each level was within the
limits of 98% and 102%.The results obtained for accuracy, precision, LOD, LOQ and
Ruggedness were within the limits. Thus the validated economical method was applied for
forced degradation study of Atovaquone and Proguanil Hydrochloride tablet.
KEYWORDS: Atovaquone and proguanil, stress study, HPLC method.
INTRODUCTION
Proguanil anti malarial drug chemically known as
1-(4-chlorophenyl)-2-(N'-propan-2-Volume 6, Issue 13, 338-349. Research Article ISSN 2277– 7105
*Corresponding Author
S. Naazneen
Assistant Professor, St
Mary’s College of
Pharmacy, Secunderabad,
Andhra Pradesh, India. Article Received on 27 August 2017,
Revised on 17 Sept. 2017, Accepted on 08 Oct. 2017
DOI: 10.20959/wjpr201713-9533
Chemically known as trans-2-[4-(4-chlorophenyl) cyclohexyl]-3-hydroxy-1,
4-naphthalenedione, used for the Pneumocystis Carinii pneumonia in acquired
immunodeficiency syndrome (AIDS).[1] After profound search from data and literature
available, it was revealed that many methods have been reported including LC-MS,[2]
ultraviolet spectrophotometry,[3] high performance liquid chromatography,[4-6] TLC method[3]
for the analysis of Proguanil alone. Limited analytical methods were reported including
UV,[7] HPLC,[8-9] capillary zone electrophoresis[10] and LC-MS[11] for the analysis of
atovaquone alone. Few analytical techniques including mass spectrometric[12] and HPLC[13-14]
methods have been reported for the simultaneous determination of Atovaquone and Proguanil
hydrochloride from bulk drug and Pharmaceutical dosage forms. Whereas there is no stability
indicating analytical methods were reported for simultaneous estimation of atovaquone and
proguanil. Hence a simple, rapid, sensitive and accurate stability indicating HPLC method
was developed for the simultaneous estimation of atovaquone and proguanil from bulk and
pharmaceutical dosage form.
MATERIALS AND METHODS
Chemicals and reagents
HPLC grade methanol, acetonitrile, formic acid and analytical grade ammonium formate
were purchased from Merck (Mumbai, India). Proguanil working standard was obtained as a
gift sample from Alkem Laboratories, Ltd., (Mumbai, India) and Atovaquone working
standard from Zhejiang Kangyo Pharmaceuticals Co., Ltd., Mumbai, India.
Instrumentation
Shimadzu gradient HPLC (JAPAN) ,HPLC column Inertsil (250 x 4.6mm, 5μm), Mobile
phase filtration unit (Pall Life sciences, Mumbai, India), LAB-INDIA U.V with UV Win
software, Sonicator, PH meter (LAB-INDIA), digital balance (Denver).
Preparation of standard solutions
Stock solutions (1mg/ml) of atovaquone and proguanil were prepared in methanol. Further
dilutions were carried out using Methanol: Acetonitrile 50:50 v/v as diluent. Working
standards of different concentrations ranging from 2.5-20µg/ml for poguanil and 6.25-50
µg/ml for atovaquone were prepared by diluting several aliquots of standard solution s of
Preparation of sample solution
Twenty tablets each containing 100 mg of proguanil and 200 mg of atovaquone were
weighed and powdered equivalent to dose, transferred to a 100 mL volumetric flask, and
extracted with mixture of methanol and water (80:20). The mixture was sonicated for 20 min
in an ultrasonic bath. The volume was adjusted to 100 mL with the same solvent mixture,
filtered and from this solution 1.0 mL was pipetted and the volume was made up to 100mL
with diluents to get the concentration 10 μg/mL of proguanil and 20 μg/mL of Atovaquone.
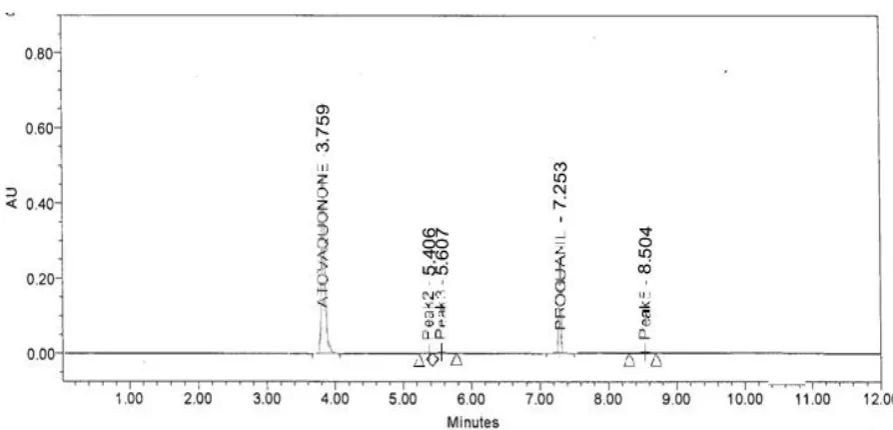
Chromatographic Conditions
Chromatographic Conditions The HPLC system consisted of Shimadzu gradient HPLC
(JAPAN) with dual λ Absorbance UV detector. The wavelength of detection as set at 254nm.
Separation was carried out in gradient mode on inertsil C18 column (4.6x250mmx5µm) and
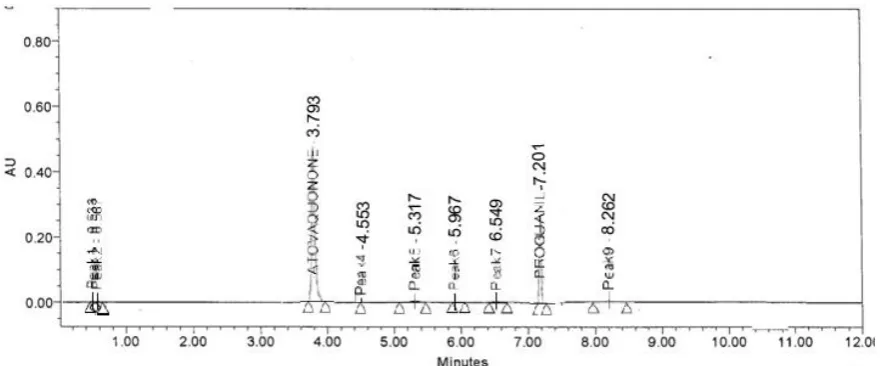
the retention time of atovaquone and proguanil was found to be 7.3 and 3.8 respectively
(figure 1), using mobile phase consisting a mixture of 10mM ammonium formate, pH 3.5 and
90:10 v/v acetonitrile - methanol in the ratio of 30:70 v/v at a flow rate of 0.9ml/min. The
mobile phase filtered through nylon milli pore (0.2µm) membrane filter, purchased from pall
life sciences, Mumbai and degassed with Ultra sonicator prior to use. Chromatography was
[image:3.595.74.517.452.647.2]carried out at room temperature 25oC and maintains the column temperature at 32 oC.
Figure 1: Chromatogram of Atovaquone and Proguanil
METHOD VALIDATION
Method validation was performed as per the ICH guidelines Q2 (R1) Validation of Analytical
Linearity
Linear concentrations of both drugs were prepared and the best fit line was calculated. Wide
range calibration was determined by solutions containing 2.5μg/ml to 20μg/ml (Table 1) for
Proguanil and 6.25-50 µg/ml for Atovaquone. Correlation coefficient was found to be
[image:4.595.113.482.183.744.2]0.999&0.999 for proguanil & atovaquone respectively (Fig 2&3).
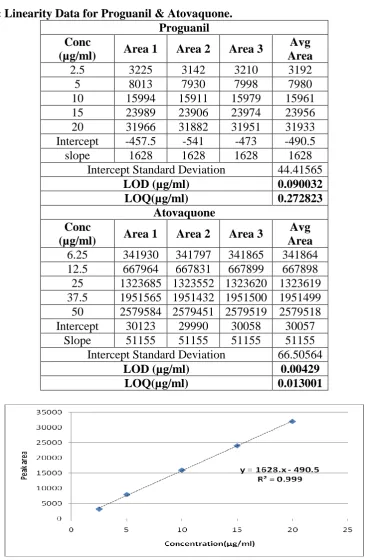
Table 1: Linearity Data for Proguanil & Atovaquone. Proguanil Conc
(µg/ml) Area 1 Area 2 Area 3
Avg Area
2.5 3225 3142 3210 3192
5 8013 7930 7998 7980
10 15994 15911 15979 15961 15 23989 23906 23974 23956 20 31966 31882 31951 31933 Intercept -457.5 -541 -473 -490.5 slope 1628 1628 1628 1628
Intercept Standard Deviation 44.41565
LOD (µg/ml) 0.090032
LOQ(µg/ml) 0.272823
Atovaquone Conc
(µg/ml) Area 1 Area 2 Area 3
Avg Area 6.25 341930 341797 341865 341864 12.5 667964 667831 667899 667898 25 1323685 1323552 1323620 1323619 37.5 1951565 1951432 1951500 1951499 50 2579584 2579451 2579519 2579518 Intercept 30123 29990 30058 30057
Slope 51155 51155 51155 51155 Intercept Standard Deviation 66.50564
LOD (µg/ml) 0.00429
LOQ(µg/ml) 0.013001
Figure 3: Calibration Curve of Atovaquone.
Limit of Detection (LOD) and Limit of Quantification (LOQ)
The LOD is calculated using the formula 3.3 times σ/s where “σ” is standard deviation of the
intercept obtained for calibration curve and “s” is the slope of the calibration curve. Similarly LOQ is calculated using the formula 10 times σ/s. The calculated LOD and LOQ are shown
in Table 1.
Precision
The intraday precision was demonstrated by injecting six test solutions of proguanil and
atovaquone with 5µg/ml and 12.5µg/ml respectively as per the test procedure (Table 2) &
recording the chromatograms of six test solutions. The % RSD of proguanil and atovaquone
was found to be 1.0 and 0.72 respectively.
Table 2: Method Precision data of Proguanil and Atovaquone.
Proguanil (5µg/ml ) Atovaquone (12.5µg/ml )
S.No Area Area
1 8158 658954
2 7984 657814
3 8127 648757
4 8195 658314
5 8216 649931
6 8151 658769
Mean 8138 655423
SD 82.14 4739.95
%RSD 1.00 0.72
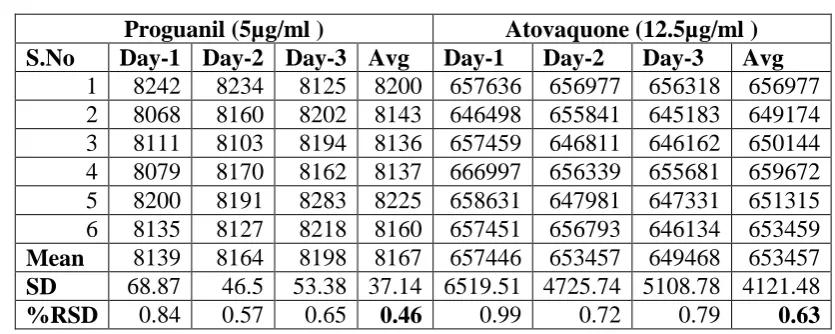
Intermediate Precision
Intermediate precision of the analytical method was determined by performing method
condition. Assay of all six replicate sample preparations was determined and the mean %
[image:6.595.86.504.141.308.2]RSD of Proguanil and Atovaquone was found to be 0.46 and 0.63 respectively (Table 3).
Table 3: Precision Data of Proguanil & Atovaquone.
Proguanil (5µg/ml ) Atovaquone (12.5µg/ml )
S.No Day-1 Day-2 Day-3 Avg Day-1 Day-2 Day-3 Avg
1 8242 8234 8125 8200 657636 656977 656318 656977 2 8068 8160 8202 8143 646498 655841 645183 649174 3 8111 8103 8194 8136 657459 646811 646162 650144 4 8079 8170 8162 8137 666997 656339 655681 659672 5 8200 8191 8283 8225 658631 647981 647331 651315 6 8135 8127 8218 8160 657451 656793 646134 653459
Mean 8139 8164 8198 8167 657446 653457 649468 653457
SD 68.87 46.5 53.38 37.14 6519.51 4725.74 5108.78 4121.48
%RSD 0.84 0.57 0.65 0.46 0.99 0.72 0.79 0.63
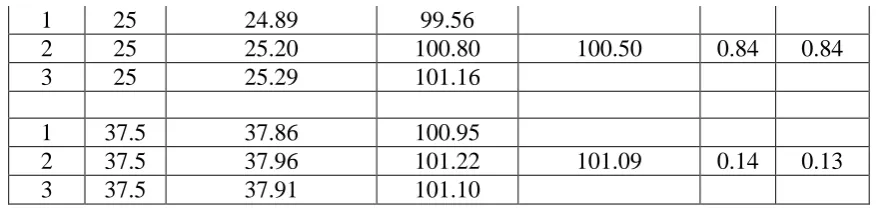
Accuracy
Accuracy of the method was established by performing recovery studies according to the ICH
guidelines. Spiked samples were prepared by spiking pre-analyzed sample solutions with
pure drug at three different concentration levels each in triplicate. Mean percentage recovery
values at three different concentrations of the two drugs was calculated. The % mean
recovery of proguanil (98.62-100.99%) & atovaquone (98.38-101.09.%) at each level was
within the limits of 98% and 102% (Table 4).
Table 4: Accuracy data of Proguanil and Atovaquone.
Accuracy of Proguanil
S.N0. Conc. Calculated Concn. %Recovery Mean Recovery SD %RSD
1 5 4.95 98.93
2 5 4.90 98.06 98.62 0.49 0.50
3 5 4.94 98.88
1 10 10.0 99.99
2 10 10.25 102.46 100.99 1.297 1.28
3 10 10.05 100.52
1 15 15.20 101.33
2 15 15.08 100.52 100.90 0.405 0.40
3 15 15.13 100.86
Accuracy of Atovaquone
S.N0. Conc. Calculated concn. %Recovery Mean Recovery SD %RSD
1 12.5 12.47 99.78
2 12.5 12.18 97.43 98.38 1.24 1.26
1 25 24.89 99.56
2 25 25.20 100.80 100.50 0.84 0.84
3 25 25.29 101.16
1 37.5 37.86 100.95
2 37.5 37.96 101.22 101.09 0.14 0.13
3 37.5 37.91 101.10
Ruggedness
The ruggedness of method was calculated with six injections of 10μg/ml proguanil and 25
μg/ml of atovaquone in two batches using two different columns. The % CV of ruggedness
for proguanil was 1.56 with column-1 and 1.36 with column-2 and the % CV of ruggedness
for atovaquone was 1.32 with column-1 and 0.93 with column-2 (Table-5), which is within
[image:7.595.78.518.69.174.2]acceptance limits.
Table 5: Results of Ruggedness.
Proguanil 10μg/ml Atovaquone 25μg/ml
S.NO Column 1 Column 2 Column 1 Column 2
1 10.02 10.08 25.04 25.08
2 9.76 10.02 25.02 24.88
3 9.74 9.89 24.34 24.62
4 9.84 9.82 24.72 24.96
5 9.79 9.71 24.55 24.59
6 9.55 9.94 24.29 24.51
Mean 9.78 9.91 24.66 24.78
± SD 0.15 0.13 0.33 0.23
% CV 1.56 1.36 1.32 0.93
% Accuracy 97.83 99.10 98.64 99.09
STRESS DEGRADATION STUDIES
Stress degradation studies were performed as per the ICH guidelinesQ1A (R2) Stability
Testing of New Drug Substances and Products, using the proposed validated analytical
method. (Table 6&7).
Acid degradation studies
To 1ml of stock solution atovaquone and proguanil, 1ml of 2N HCl was added and refluxed
for 30min at 600c. From the above solution10 µl was injected into the system and the
Figure 4: Chromatogram of Acid Hydrolysis.
Alkali Degradation Studies
To 1ml of stock solution of of standard drug and sample atovaquone and proguanil, 1ml of
2N NaOH was added and refluxed for 30min at 600c. From the above solution10 µl was
injected into the system and the chromatograms were recorded to detect the stability of
sample.
Figure 5: Chromatogram of Base Degradation.
Oxidation
To 1ml of stock solution of standard drug and sample of atovaquone and proguanil, 1ml of
[image:8.595.80.511.443.640.2]injected into the system and the chromatograms were recorded to detect the stability of
[image:9.595.75.517.128.308.2]sample.
Figure 6: Chromatogram of Oxidative Degradation.
Photo Stability Studies
The photochemical stability of the drug was also studied by exposing the 25 µg/ml
solution to UV Light by keeping the beaker in UV Chamber for 7days or 200 Watt hours/m2 in
photo stability chamber. . For HPLC study, from the above solution10 µl was injected into the
system and the chromatograms were recorded to detect the stability of sample. (Figure 7).
Figure 7: Chromatogram of Photo Degradation Study.
Thermal degradation studies
The 1ml of stock solution of standard drug and sample of atovaquone and proguanil was
[image:9.595.74.518.466.669.2]injected into the system and the chromatograms were recorded to detect the stability of
[image:10.595.77.521.125.308.2]sample.(figure: 8).
Figure 8: Chromatogram of Thermal Degradation Study.
Table 10: Results of stress degradation studies of Proguanil.
Sno Stress conditions Time % Assay % Degradation Purity angle Purity threshold
1 Acid Degradation 30 min 91.59 8.41 0.26 0.29
2 Base Degradation 30 min 86.13 13.87 0.19 0.22
3 Peroxide Degradation 30 min 97.10 2.9 0.24 0.26
4 UV Degradation 7 days 97.30 2.7 0.17 0.21
[image:10.595.43.557.366.456.2]5 Thermal Degradation 24hrs 96.3 3.7 0.20 0.23
Table 11: Results of stress degradation studies of Atazanavir.
Sno Stress conditions Time % Assay % Degradation Purity angle Purity threshold
1 Acid Degradation 30 min 93.713 6.28 0.13 0.16
2 Base Degradation 30 min 94.985 5.02 0.16 0.21
3 Peroxide Degradation 30 min 92.798 7.20 0.20 0.23
4 UV Degradation 7 days 93.502 6.49 0.18 0.21
5 Thermal degradation 24hrs 94.8 5.2 0.14 0.19
Atovaquone and proguanil undergoes significant degradation in acidic, oxidation, alkaline,
and UV. Comparatively More degradation was found with base for proguanil and with
peroxide for atovaquone. As per ICH guidelines peak purity angle should be less than peak
purity threshold. Hence, method of the analysis of atovaquone and proguanil in tablet dosage
form shows that the degradation product doesn’t interfere with the analytical determination.
hence the proposed analytical method is also useful for the determination of atovaquone and
CONCLUSION
The developed stability indicating HPLC-UV method for simultaneous estimation of
Proguanil and Atazanavir was novel, simple, precise, accurate, robust & cost-effective
method. There are no HPLC method reported till now on selected combination drugs. Hence
the developed method suitable for the routine analysis and quality control and percentage
degradation of pharmaceutical preparations containing these drugs either individually or in
combination.
ACKNOWLEDGEMENT
The author is acknowledged to Chairmen St Mary’s College of Pharmacy, Secunderabad,
Telangana, India, for the immense support & providing laboratory facilities for success full
completion of work.
REFERENCES
1. http://www.rxlist.com/malarone-drug.htm (Cited on 12-04-2016).
2. Hommerson P. New Approaches for Capillary Electrophoresis-mass Spectrometry in
Drug Analysis: Utrecht University, 2009.
3. Blessborn Daniel. Development of Analytical Methods for the Determination of
Antimalarials in Biological Fluids: Uppsala University, 2009.
4. Taylor R B, Moody R R, Ochekpe N A. Determination of Proguanil and its Metabolites,
Cycloguanil and 4-chlorophenylbiguanide in Plasma, Whole Blood and Urine by High
Pressure Liquid Chromatography, J. Chromatogr. Amsterdam, 1987; 416: 394-399.
5. Pingale S G, Nerurkar K K, Padgaonkar A M, Pawar U D, Mangaonkar K V. Alternative
LC–MS–MS Method for Simultaneous Determination of Proguanil, Its Active Metabolite
in Human Plasma and Application to a Bioequivalence Study, Chromatographia, 2009;
1095-1102.
6. Lindegardh N, Blessborn D, Berqvist Y. Simulataneous Quantitation of the Highly
Lipophillic Atovaquone and Hydrophillic Strong Basic Proguanil and its Metabolites
using a New Mixed-mode SPE Approach and Steep-gradient LC, J. Chromatographic Sci,
2005; 43: 259-266.
7. Kalpesh N Patel, Jayvadhan K Patel, Manish P Patel, Ganesh C Rajput. A validated
method for development of Atovaquone as API and tablet dosage forms by UV
8. Lindegardh N, Bergqvist Y. Automated solid phase extraction method for determination
of Atovaquone in plasma and whole blood by rapid High- performance liquid
chromatography, Journal of chromatography B Biomedical sciences and application,
2000; 744(1): 9-17.
9. Suraj Sahoo, Prasanna Kumar P, Sagar Kumar M, Sabuj S. HPLC method development
for simultaneous estimation of Atovaquone and Proguanil in tablet dosage form,
International Journal of pharmacy and Pharmaceutical Sciences, 2012; 823-831.
10.Chou CC, Brown M P, Merritt K A. Capillary zone electrophoresis for the determination
of Atovaquone in serum, Journal of chromatography B Biomedical sciences and
application, 2000; 441-445.
11.Satish Gangaram P, Nerukar KK, Ajit MP, Uttam DP, Kiran VM. Determination of
Atovaquone in Human plasma by LC-MS-MS and its application to a Bioequivalence
study, Chromatographia, 2009; 947-951.
12.Lindegardh N, Blessborn D, Berqvist Y. Simulataneous Quantitation of the Highly
Lipophillic Atovaquone and Hydrophillic strong Basic proguanil and its metabolites using
a new mixed-mode SPE approach and steep-gradient LC, Journal of chromatographic
sciences, 2005; 46: 402-413.
13.Vijay S V, Badgujar MV, Kiran VM. Simultaneous Determination of Atovaquone and
Proguanil Hydrochloride in Tablet Dosage Form by High Performance Liquid
Chromatography. Research Journal of Pharmaceutical, Biological and Chemical Sciences,
2012; 3(4): 377-383.
14.Bhavyasri1 KV, Murali Balaram R, Nageswarao D, Rambabu, Ajitha M. RP-UPLC
method development and validation for the simultaneous estimation of proguanil and
atovaquone in pharmaceutical dosage form. Journal of Chemical and Pharmaceutical
Research, 2013; 5(12): 1222-1229.
15.ICH guidelines for validation of analytical procedures: text and methodology. Q2(R1)