DEVELOPMENT AND VALIDATION OF A RP-HPLC METHOD FOR
THE SIMULTANEOUS DETERMINATION OF VITEXIN-2
″
-O-RHAMNOSIDE AND HYPEROSIDE IN LEAVES AND
FLOWERS OF HAWTHORN
Andriy Gudzenko*
State Laboratory for Quality Control of Medicines, State Institution “Institute of
Pharmacology and Toxicology of National Medical Academy of Science of Ukraine”, Kiyv,
Ukraine. 14, Eugene Potie str., 03680, Kyiv, Ukraine.
ABSTRACT
A method for separation and quantification of two flavonoids by
reverse-phase high performance liquid chromatography (HPLC) was
developed and validated. Flavonoids present in extract of the leaves
with flowers of hawthorn (Crataegus pentagyna Waldst. et Kit) were
analyzed. Vitexin-2″-O-rhamnoside and hyperoside were used as
calibration standards.In this study, an excellent linearity was obtained
with r higher than 0.99. Besides, the chromatographic peaks showed
good resolution. With other validation data, including precision,
specificity, accuracy and robustness, this method demonstrated good
reliability and sensitivity, and can be conveniently used for the
quantification of vitexin-2″-O-rhamnoside and hyperoside of the
extract of the leaves with flowers of hawthorn. In summary, the
method above can be considered specific, exact, precise, linear, robust
and easy to perform. Further this method can be applied to a
standardization of multicomponent herbal remedies, that incorporate
leaves with flowers of hawthorn.
KEYWORDS: leaves with flowers of hawthorn (Crataegus pentagyna Waldst. et Kit), HPLC, hyperoside, vitexin-2″-O-rhamnoside, validation.
Volume 2, Issue 5, 1270-1282. Research Article ISSN 2277 – 7105
Article Received on 17 June 2013,
Revised on 22 July 2013, Accepted on 25 August 2013
*Correspondence for
Author:
Dr. Andriy Gudzenko
State Laboratory for Quality
Control of Medicines, State
Institution “Institute of
Pharmacology and Toxicology
of National Medical Academy
of Science of Ukraine.
1. INTRODUCTION
Hawthorn is the common name for Crataegus species in Rosaceae family. There are over
1000 species of Crataegus distributed primarily in Asia, Europe and North America. It has
been used as a medicinal material and food for hundreds of years both in Europe and in
China[1]. Clinical investigations and other research suggest that extracts of hawthorn have
multiple health effects including anti-atherosclerotic, hypotensive, cardioprotective,
antidiabetic, antioxidant and radical scavenging activities[2-5].
The diversity and complexity of the phytochemical composition of Crataegus species may
explain their polyvalent pharmacological activity. The raw material of hawthorn contains
triterpene acids, procyanidins, lignans, phenolic acids, sugars, sugar alcohols and
flavonoids[1, 6-10].
Flavonoids constitute one of the most important groups of pharmacologically active
principles in hawthorn. It is suggested that anti-inflammatory, free-radical-scavenging, and
antiviral activities of hawthorn are mainly attributed to the flavonoid complex[11-13].
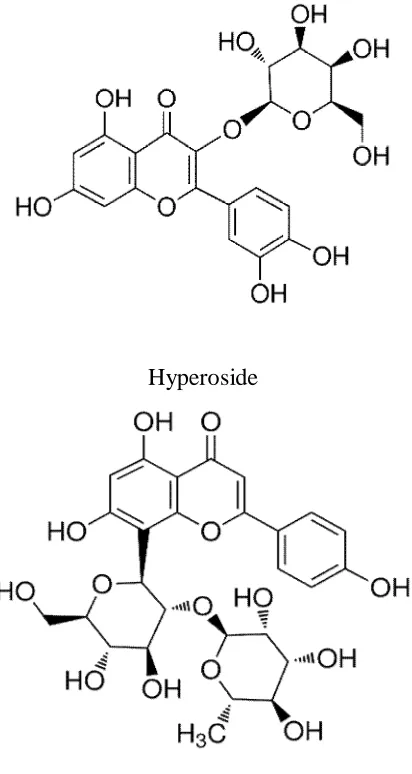
The main components of the flavonoid fraction of leaves and flowers of Crataegus pentagyna
Waldst. et Kit - hawthorn species, which is widespread in Ukraine[14], are hyperoside and
vitexin-2″-O-rhamnoside[15, 16]. Structure of these flavonoids shown in the Fig.1. These
flavonoids have a wide spectrum of biological activity.
Hyperoside has a variety of pharmacological effects including viral, oxidative,
anti-apoptotic and anti-inflammatory activities[17-18]. Vitexine-2″-O-rhamnoside has
antithrombotic, anti-inflammatory and antioxidant activities[11-13, 19].The choice of these two
flavonoids was based on other studies, which reported the presence of these compounds in
other species of flowers and leaves of Crataegus[1, 16, 20-22]. Thus, the objective of this study
was to develop and validate a method for the separation and simultaneous quantitative
analysis of hyperoside and vitexin-2″-O-rhamnoside by HPLC, obtained from an extract of
leaves and flowers of Crataegus pentagyna Waldst. et Kit. The method was validated
according to ICH Harmonised Tripartite Guidelines “Validation of analytical procedures:
Text and Methodology Q2(R1)”[23].
The following validation characteristics were assessed: specificity, linearity, limit of
Hyperoside
[image:3.595.196.402.87.474.2]Vitexin-2″-O-rhamnoside
Figure 1: Chemical structure of hyperoside and vitexin-2″-O-rhamnoside.
2. MATERIALS AND METHODS 2.1 Plant material
The leaves and flowers of Crataegus pentagyna Waldst. et Kit was collected in the region of
Borispol (Kyiv region, Ukraine) in may 2011. Identification of the species was confirmed in
State Laboratory for Quality Control of Medicines, State Institution "Institute of
pharmacology and toxicology National Academy of Medical Sciences of Ukraine" (Ukraine).
A voucher specimen (CF011-15) was deposited at the herbarium in this laboratory.
2.2 Chemicals and reagents
All reagents and solvents were analytical and HPLC grades (Fluka, USA). Ultra-pure water
was used in all experiments. Hyperoside and vitexin-2″-O-rhamnoside (Roth, Germany) of
the highest grade (purity>98.0%) were used as the external standards.
2.3 Instrumentation and chromatographic conditions
The analyses were carried out using an HPLC system (Shimadzu, Japan) consisting of a
solvent delivery pump (Model LC-20 AD), a diode array detector (Model SPD-20A), an
auto-injector (Model SIL-20A) and system controller (Model CBM-20A). Data collection
and analyses were performed using LCsolution (ver. 1.22SP1). A gradient elution was
performed on a Phenomenex Luna C18(2) (250 x 4.6 mm i.d., 5 µm particle size)
(Phenomenex, USA). The mobile phase consisted of two different solutions, solution A and
solution B. Solution A: 0.1% trifluoroacetic acid solution in acetonitrile. Solution B: 0.1%
trifluoroacetic acid in water. All solutions were degassed and filtered through a 0.45 µm pore
size filter (Millipore, USA). Separations were effected by a gradient elution program as
follows: from 0 to 5 min, B was isocratic at 95%; from 5 to 35 min, solution B followed a
linear change from 95% to 75%; from 35 to 40 min, B was isocratic at 75%; from 40 to 60
min, B linearly changed from 75% to 50%, from 60 to 65 min, B linearly changed from 50%
to 20%, from 65 to 70 min, B was isocratic at 20%; and from 70 to 85 min, B was isocratic at
95%. The mobile phase flow rate was 1 mL/min and the injection volume was 5 µL. UV
detection was performed at 338 nm.
Using these chromatographic conditions, it was possible to confirm the retention time of
hyperoside and vitexin-2″-O-rhamnoside by injection of each standard separately.
2.4 Sample preparation
Plant samples (1.0 g) were extracted two times, each time for 45 min at 100°C, with a 50 %
ethanol, by use of a hot reflux equipment, and the extracts were combined in a 100 ml flask
with 50 % ethanol.
Samples were purified by solid phase extraction as described in[24].
2.5 Preparation of standard solution
Accurately weighed appropriate amounts of the reference compounds (hyperoside HYP;
vitexin-2″-O-rhamnoside VIT) were mixed and dissolved in methanol in a 100-mL
volumetric flask, to obtain a stock solution. The concentration of the two compounds in this
solution was 308.0 µg/mL (HYP), and 199.6 µg/mL (VIT). Besides, external standards were
according to the level estimated in the plant sample. Working solutions were prepared by
stepwise dilution of the stock solution with methanol.
2.6 Method validation
In the validation of the analytical method used for the quantification of hyperoside and
vitexin-2″-O-rhamnoside in leaves and flowers of hawthorn, the following parameters were
determined: specificity, linearity, sensitivity, accuracy, precision and robustness.
2.7 Specificity
Specificity is the ability of a method to discriminate between the study analyte(s) and other
components in the sample. The specificity was demonstrated by running a procedural blank.
In addition, the resolution between the peaks of the main flavonoids that could be found in
extracts of leaves and flowers of hawthorn was determined by analysis of chromatograms of
the standard solution and the sample solution.
2.8 Linearity
The linearity between peak area and concentration was analyzed using two calibration curves
obtained with standard solutions at seven different concentrations of each standard HYP, and
VIT. The concentrations of the two compounds in the solution that was considered 100% was
154.0 µg/mL (HYP), and 99.8 µg/mL (VIT). The other concentration levels used to construct
calibration curves were 10%, 50%, 75%, 100%, 125%, 150 % and 200% of the concentration
mentioned above. The data for peak area versus drug concentration were treated by linear
regression analysis.
2.9 Sensitivity
The limit of detection (LOD) and the limit of quantification (LOQ) were determined from the
calibration curves of the HYP and VIT standards. LOD was calculated according to the
expression DPx3/IC, where DP is the standard deviation of the response and IC is the slope
of the calibration curve. LOQ was established by using the expression DP x10/IC[23].
2.10 Accuracy
The accuracy was evaluated by means of recovery assays carried out by adding known
amounts of the HYP and VIT standard to the sample, at three different levels (5%, 10% and
Average recoveries were calibrated by the formula recovery (%) = {(amount found - original
amount)/amount spiked} x 100.
2.11 Precision
The precision of the method was investigated with respect to repeatability, intermediate
precision (inter-day variation) and reproducibility by determination of standard solution at
100% of the test concentration. To assess the intra-day precision (repeatability) of the
method, the sample was injected six times within a day. The inter-day precision was
determined with the sample assayed on different days and by another analyst. Precision was
expressed as the relative standard deviations (% RSD) of the concentrations of each
compound, HYP and VIT.
2.12 Robustness
Three sample solutions were prepared and analyzed under the conditions established and by
changing the wavelength parameter from 336 nm to 370 nm, by using columns from different
suppliers and by changing the mobile phase composition (±5% change organic solvent) and
(±5% change trifluoroacetic acid concentration)[23].
2.13 Statistical analysis
The data were submitted to statistical analysis using Excel® software.
3. RESULTS AND DISCUSSION
The HPLC method carried out in this study was aimed at developing a chromatographic
system, capable of eluting and resolving flavonoid compounds in leaves and flowers of
hawthorn. In the development of the HPLC method for determination of hyperoside and
vitexin-2″-O-rhamnoside in leaves and flowers of hawthorn, several solvent systems
(methanol-water-trifluoroacetic acid, acetonitrile-water-trifluoroacetic acid,
tetrahydrofuran-water-trifluoroacetic acid) and separation columns Phenomenex Luna C18(2) (250 x 4.6 mm
i.d., 5 µm particle size), WatersX-Terra C18 column (250 x 4.6 mm i.d., 5 µm particle size),
Macherey-Nagel Nucleosil 100-5 C18 (250 x 4.6 mm i.d., 5 µm particle size) were evaluated
and compared. The Phenomenex Luna C18 column provided better separation of the plant
extract than with other specifications or brands of columns.
The choice of detection wavelength was determined by performing a screening with 10 ppm
were recorded from 220 to 380 nm and exhibited maximum wavelengths at 268 nm and 338
nm. It was carried out an analysis on HPLC with the two wavelengths and which provided
better response even for the others compounds (vitexin-2″-O-rhamnoside) was at a
wavelength of 338 nm.
The results for quantification of the flavonoids in the sample were 153,37 µg/mL of
hyperoside and 96,91 µg/mL of vitexin-2″-O-rhamnoside, which means, 0.839% and 0.526%
of each compound contained in the leaves and flowers of Crataegus pentagyna Waldst. et
Kit, based on the dried raw, respectively.
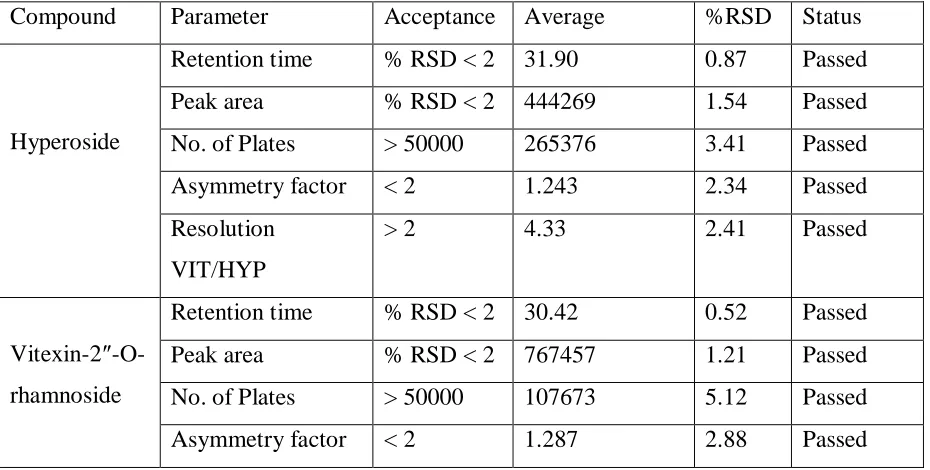
System suitability test showed that critical parameters such as retention time, area, number of
theoretical plates and resolution between HYP and VIT met the acceptance criteria on all the
[image:7.595.67.532.375.610.2]experimental days (Table 1).
Table 1: System suitability test.
Compound Parameter Acceptance Average %RSD Status
Hyperoside
Retention time % RSD < 2 31.90 0.87 Passed
Peak area % RSD < 2 444269 1.54 Passed
No. of Plates > 50000 265376 3.41 Passed
Asymmetry factor < 2 1.243 2.34 Passed
Resolution
VIT/HYP
> 2 4.33 2.41 Passed
Vitexin-2″
-O-rhamnoside
Retention time % RSD < 2 30.42 0.52 Passed
Peak area % RSD < 2 767457 1.21 Passed
No. of Plates > 50000 107673 5.12 Passed
Asymmetry factor < 2 1.287 2.88 Passed
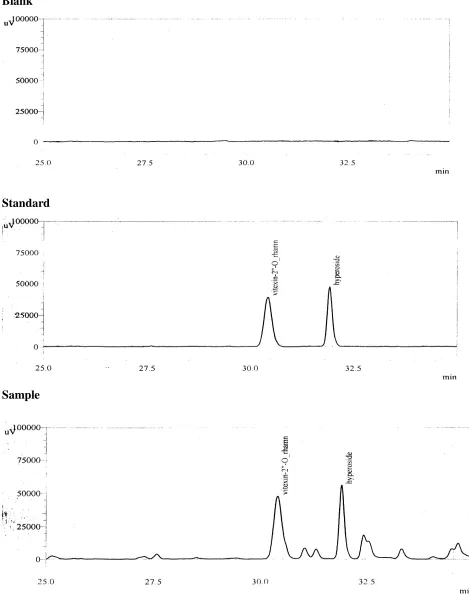
The specificity of the method was evaluated by analysis of blank, standard and sample
solution chromatograms (Figure 2). Good separation between the peaks of VIT and HYP was
achieved, with the retention times, 30,42 min for vitexin-2″-O-rhamnoside and 31.90 min for
hyperoside. Furthermore, the chromatographic peaks showed good resolution (around 4.33
between VIT and HYP). In relation to asymetry, the peaks showed values 1.287 for VIT and
Blank
Standard
[image:8.595.70.539.92.698.2]Sample
Linearity was evaluated by the correlation coefficient r, and all values for the two compounds
were greater than 0.999, showing that responses for the standard in the concentration ranges
examined (from 10 to 200%) were linear. Besides, according to[23], the minimum acceptable
correlation coefficient is 0.990.
As shown in Table 2, the LOD values were 0.02 µg/mL for the compounds VIT and HYP,
while the LOQ values were 0.07 µg/mL.
Table 2: Calibration curve parameters, limit of detection (LOD), limit of quantification (LOQ) for hyperoside and vitexin-2”-O-rhamnoside.
Compound Calibration curve equation
Correlation coefficient (r)
Linear range (µg/mL)
LOD(µg/mL) LOQ(µg/mL)
Hyperoside y = 2838782x
+ 383
0.99943 15.4-308.0 0.02 0.08
Vitexin-2″
-
O-rhamnoside
y = 3748733x
- 4380
0.99925
9.98-199.60
0.02 0.08
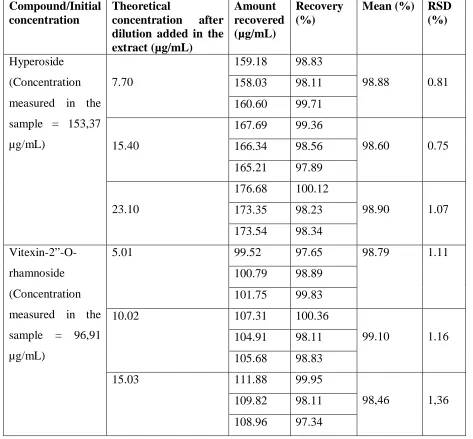
The recovery of the compounds HYP and VIT was determined by spiking the extracts of
leaves and flowers of hawthorn with known amounts of HYP and VIT standards. Recovery of
each substance was obtained from the calculated amount found and original amount. The
results are presented in Table 3 and conform with the recommendations of[23].
The data of the precision are shown in Tables 4, 5. The results display a coefficient of
variation less than that recommended by [23] whose limit is 5%.
Also, there were no significant differences between assay results, indicating that the precision
of the proposed method was satisfactory.
Robustness was evaluated to ensure that the HPLC method is insensitive to small changes in
the experimental conditions. In this study, the wavelength, column supplier and pH of the
mobile phase were changed. None of the modifications caused any significant change in the
resolution or response of the HYP and VIT peaks.
All results were displayed according to the ICH Harmonised Tripartite Guidelines
Table 3: Results of accuracy determination by analyzing of the hyperoside and vitexin-2”-O-rhamnoside of known concentrations.
Compound/Initial concentration
Theoretical
concentration after dilution added in the extract (µg/mL) Amount recovered (µg/mL) Recovery (%)
Mean (%) RSD (%)
Hyperoside
(Concentration
measured in the
sample = 153,37
µg/mL)
7.70
159.18 98.83
98.88 0.81 158.03 98.11
160.60 99.71
15.40
167.69 99.36
98.60 0.75 166.34 98.56
165.21 97.89
23.10
176.68 100.12
98.90 1.07 173.35 98.23
173.54 98.34
Vitexin-2”-O-rhamnoside
(Concentration
measured in the
sample = 96,91
µg/mL)
5.01 99.52 97.65 98.79 1.11
100.79 98.89
101.75 99.83
10.02 107.31 100.36
99.10 1.16 104.91 98.11
105.68 98.83
15.03 111.88 99.95
98,46 1,36 109.82 98.11
108.96 97.34
Table 4: Results of the repeatability.
Compound Mean (µg/mL)±standard deviation (n=6) RSD (%)
Hyperoside 153,37±3.87 1.12
Vitexin-2”-O-rhamnoside
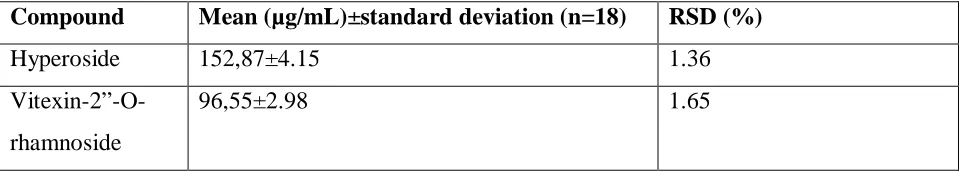
[image:10.595.65.542.619.705.2]Table 5: Results of the intermediate precision.
Compound Mean (µg/mL)±standard deviation (n=18) RSD (%)
Hyperoside 152,87±4.15 1.36
Vitexin-2”-O-rhamnoside
96,55±2.98 1.65
4. CONCLUSION
The quantitative method developed here was successfully applied in the simultaneous
analysis of two different compounds in extracts of f leaves and flowers of hawthorn. Taking
into account the results obtained in this study, the proposed method can be conveniently used
for the analysis of hyperoside and vitexin-2”-O-rhamnoside in extracts of leaves and flowers
of hawthorn.
The proposed method demonstrated high specificity at 338 nm detection for the extracts of
leaves and flowers of hawthorn showing reliability in the quantification of HYP and VIT.
Further, this method can be applied to a standardization of multicomponent herbal remedies,
that incorporate leaves and flowers of hawthorn. In summary, the method above can be
considered specific, exact, precise, linear, robust and easy to perform.
5. REFERENCES
1. Edwards JE, Brown PN, Talent N, Dickinson TA, Shipley PR: A review of the chemistry
of the genus Crataegus. Phytochemistry, 2012; 79: 5-26.
2. Ljubuncic P, Portnaya I, Cogan U, Azaizeh H, Bomzon A: Antioxidant activity of
Crataegus aronia aqueous extract used in traditional Arab medicine in Israel. J
Ethnopharmacol,2005; 101: 153-161.
3. Furey A, Tassell M: Towards a systematic scientific approach in the assessment of efficacy
of an herbal preparation: Hawthorn (Crataegus spp.). Europ J Heart Fail, 2008; 10(12):
1153–1157.
4. Garjani A, Nazemiyeh H, Maleki N, Valizadeh H: Effects of extracts from flowering tops
of Crataegus meyeri A. Pojark. on ischaemic arrhythmias in anaesthetized rats. Phytother
Res, 2000; 14(6): 428–431.
5. Bahri-Sahloul R, Ammar S, Fredj RB, Saguem S, Grec S, Trotin F et al.: Polyphenol
contents and antioxidant activities of extracts from flowers of two Crataegus azarolus L.
6. Svedström U, Vuorela H, Kostiainen R, Laakso I, Hiltunen, R: Fractionation of
polyphenols in hawthorn into polymeric procyanidins, phenolic acids and flavonoids prior
to high-performance liquid chromatographic analysis. J Chrom A, 2006; 1112(1–2): 103–
111.
7. Peschel W, Bohr C, Plescher A: Variability of total flavonoids in Crataegus--factor
evaluation for the monitored production of industrial starting material. Fitoterapia,
(2008); 79(1): 6–20.
8. Ringl A, Prinz S, Huefner A, Kurzmann M, Kopp B: Chemosystematic value of flavonoids
from Crataegus x macrocarpa (Rosaceae) with special emphasis on (R)- and
(S)-eriodictyol-7-O-glucuronide and luteolin-7- O-glucuronide. Chem Biodivers, 2007; 4(2):
154–162.
9. Froehlicher T, Hennebelle T, Martin-Nizard F, Cleenewerck P, Hilbert, J., Trotin F et al.:.
Phenolic profiles and antioxidative effects of hawthorn cell suspensions, fresh fruits, and
medicinal dried parts. Food Chemistry, 2009; 115(3): 897–903.
10. Maharik N, Elgengaihi S, Taha H: Anthocyanin production in callus cultures of
Crataegus sinaica boiss. Int J Acad Res,2009; 1: 30-34.
11. Tadić VM, Dobrić S, Marković GM, Dordević SM, Arsić IA, Menković NR et al.:
Anti-inflammatory, gastroprotective, free-radical-scavenging, and antimicrobial activities of
hawthorn berries ethanol extract. J Agric Food Chem, 2008; 56(17):7700-7709.
12. Kao ES, Wang CJ, Lin WL, Yin YF, Wang CP, Tseng TH: Anti-inflammatory potential
of flavonoid contents from dried fruit of Crataegus pinnatifida in vitro and in vivo. J
Agric Food Chem, 2005; 53(2):430-436.
13. Shahat AA, Cos P, De Bruyne T, Apers S, Hammouda FM, Ismail SI et al.: Antiviral and
antioxidant activity of flavonoids and proanthocyanidins from Crataegus sinaica. Planta
Med, 2002; 68(6):539-541.
14. Serzhuk ОP: Temporary dynamics of the hawthorn regeneration ability. Sci Bull NLTU
Ukraine, 2009; 19(13): 30-34.
15. Petereit F, Nahstedt A. Crataegus from the analytical viewpoint: official contents of
hawthorn drugs. Pharmazie in Unserer Zeit,2005; 34(1): 22–26.
16. Sokolov PD. Plant Resources of the USSR: Flowering plants, their chemical composition
and use, Leningrad; Nauka: 1987, pp. 39-40.
17. Kim SJ, Um JY, Hong SH, Ju-Young Lee JY: Anti-Inflammatory Activity of Hyperoside
18. Wu LL, Yang XB, Huang ZM, Liu HZ, Wu GX. In vivo and in vitro antiviral activity of
hyperoside extracted from Abelmoschus manihot (L) medik. Acta Pharmacol Sin, 2007;
28 (3): 404–409.
19. Song SJ, Li LZ, Gao PY, Yuan YQ, Wang RP, Liu KC, Peng Y: Isolation of
antithrombotic phenolic compounds from the leaves of Crataegus pinnatifida. Planta Med,
2012; 78(18):1967-71.
20. Liu P, Yang B, Kallio H: Characterization of phenolic compounds in Chinese hawthorn
(Crataegus pinnatifida Bge. var. major) fruit by high performance liquid
chromatography–electrospray ionization mass spectrometry. Food Chemistry, 2010;
121(4): 1188–1197.
21. Liu P, Yang B, Kallio H. Phenolic Compounds in hawthorn (Crataegus grayana) fruits
and leaves and changes during fruit ripening. Journal of Agricultural and Food Chemistry,
2011; 59 (20): 11141–11149.
22. Jurikova T, Sochor J, Rop O, Mlcek J, Balla S, Szekeres L, et al.: Polyphenolic Profile
and Biological Activity of Chinese Hawthorn (Crataegus pinnatifida BUNGE) Fruits.
Molecules, 2012; 17: 14490-14509.
23. ICH Harmonised Tripartite Guidelines “Validation of analytical procedures: Text and
Methodology Q2(R1)”, 2005.
24. Gudzenko AV: Developing approaches to qualitative and quantitative determination
Components of herbа Achillea Millefolium L. for multicomponent plant composition.