DEVELOPMENT AND VALIDATION OF STABILITY INDICATING
REVERSE PHASE HPLC METHOD FOR THE QUANTIFICATION OF
VALSARTAN IN BULK AND PHARMACEUTICAL DOSAGE FORM
Himani Tiwari* and Goyal Pradeep1
*Research Scholar, Pacific University, Udaipur (Raj.). 1
Associate Professor, B.N. University, Udaipur (Raj.).
ABSTRACT
Valsartan is an angiotensin-receptor blocker (ARB) that may be used
to treat a variety of cardiac conditions including hypertension, diabetic
nephropathy and heart failure. A simple, accurate and précised reverse
phase high performance liquid chromatographic method was
developed for the estimation of Valsartan in bulk and tablet dosage
form. An Inertsil ODS-4, 50 mm×4.6mm, 3μm column was used as a
stationary phase with a mobile phase A having 1000 ml Water: 1.0 ml
TFA and Mobile Phase B having 400 ml water: 600 ml Acetonitrile:
1.5 ml TFA. The flow rate was 1.0 mL/min. The effluent was
monitored at 270 nm and eluted at 11.890 min. Calibration curve was plotted with a range
from 0.5-3 μg/ml for Valsartan and the correlation was found to be 0.9958. The accuracy
range was found between 98-102%. The % RSD values for precision were less than 2.0%.
The developed method was validated for the parameters like system suitability, precision,
accuracy, and robustness parameters as per ICH guidelines. The proposed method can be
useful for the routine analysis of Valsartan in Bulk and pharmaceutical dosage form.
KEYWORDS: Anti-hypertensives, Valsartan, RP-HPLC, Columns, ICH, Validation, Mobile
Phase etc.
INTRODUCTION
Elevated arterial pressure brings pathological changes in the vasculature and hypertrophy of
the left ventricle. As a result, hypertension is the principal cause of stroke and also leads to
disease of the coronary arteries with myocardial infarction and sudden cardiac death. It is a
major contributor to cardiac failure, renal insufficiency, and dissecting aneurysm of the
Volume 7, Issue 16, 1258-1268. Research Article ISSN 2277– 7105
Article Received on 12 July 2018,
Revised on 01 August 2018, Accepted on 22 August 2018
DOI: 10.20959/wjpr201816-13228
*Corresponding Author
Himani Tiwari
Research Scholar, Pacific
aorta.[1] The antihypertensive drugs are categorised into different classes based on their
mechanism of action.[2-3] Valsartan is an angiotensin-receptor blocker (ARB) that may be
used to treat a variety of cardiac conditions including hypertension, diabetic nephropathy and
heart failure. Valsartan lowers blood pressure by antagonizing the
renin-angiotensin-aldosterone system (RAAS); it competes with angiotensin II for binding to the type-1
angiotensin II receptor (AT1) subtype and prevents the blood pressure increasing effects of
angiotensin II.[4-5] In recent years development of the analytical methods for estimation,
purity evaluation and qualification of drugs has received a great deal of attention in the field
of pharmaceutical sciences. The rational of present work is to develop and validate HPLC
method for estimation of Valsartan in bulk and pharmaceutical dosage form and also conduct
forced degradation studies for stability testing in different stress conditions.[6] This method
was successfully applied to the estimation studies of Valsartan in marketed products. An
attempt has been made to develop new simple, reliable, and reproducible, RP-HPLC methods
to estimate the Valsartan in bulk and pharmaceutical formulation with good precision,
accuracy, linearity and reproducibility respectively.[7] Hence in present work, we developed a
simple, rapid and inexpensive liquid chromatographic method for the analysis of Valsartan in
pure and pharmaceutical dosage form. The proposed HPLC method is validated using
standard ICH guidelines.[8]
Figure I: Structure of Valsartan.
MATERIALS AND METHODS
The pure drug of Valsartan was procured as gift sample from Lupin Pharmaceuticals,
Ankleshwar, Gujrat. All the chemicals used were of analytical grade and solvents used were
of HPLC grade. Diovan (80mg) of Novartis and Valent (80mg) of Lupin were procured from
local shops. Membrane filters 0.22 μm were procured from Millipore Pvt. Ltd. Bangalore,
INSTRUMENTATION
Agilent Technologies 1200 series RRLC equipped with UV-Visible detector & Diode array
detector, with Chem-station software was used in the analysis.
CHROMATOGRAPHIC CONDITIONS
Chromatographic separation was performed at 35°C temperature on a reverse phase Inertsil
ODS-4, 50 mm×4.6mm, 3μm column with use of a filtered and degassed mobile phase
consisting of Mobile Phase A: Buffer 0.2ml TFA in 1000ml Water) and Mobile Phase B: 400
ml water: 600 ml Acetonitrile: 1.5 ml TFA. The flow rate of mobile phase was adjusted to 1.0
ml/min. The UV detector wavelength was set at 270 nm.
PREPARATION OF THE MOBILE PHASE
Mobile phase-A
1 ml of Trifluoro acetic acid was added to 1000 ml of water, mixed well and filtered through
0.22µ filtered and degassed.
Mobile Phase - B
Mixture of water and Acetonitrile (400:600), add 1.5 ml of Trifluoro acetic acid was
prepared, mixed well, filtered through 0.22µ filtered and degassed.
Water: Acetonitrile (50:50) was used as diluent.
PREPARATION OF SOLUTIONS
Standard Stock Solution and Working Standard Solution
A stock solution of valsartan was prepared by accurately weighing 32 mg of drug,
transferring to 100 ml volumetric flask, dissolving in 70ml of diluent water: acetonitrile
(50:50) and was sonicated to dissolve. Volume was made upto the mark with diluent. Diluted
5.0 ml of this solution to 100ml with diluent and again 5ml of this resulting solution was
diluted to 50ml to obtain final standard solution of 1.6 µg/ml of valsartan.
Sample Solution
Weighed accurately and transferred 10 intact tablets into a specified volume (A) of
volumetric flask, add specified volume (B) of water and sonicated for 10 minutes with
intermittent shaking to disperse the tablets. Then added specified volume (C) of diluent and
sonicated for 30 minutes with intermittent shaking, allowed to cool to room temperature and
ml of this solution to 25 ml volumetric flask and diluted to volume with diluent and mixed. It
was filtered through 0.22μ PVDF filter, discarding first 3 ml of the filtrate.
Sample Preparation
Strength First dilution
Valsartan Volumetric flask (A) Volume of Water (B) Volume of Diluent (C)
80 mg 250 ml 12.5 ml 175 ml
METHOD VALIDATION
The method was validated for the parameters like specificity, range and linearity, limit of
detection (LOD), limit of quantification (LOQ), accuracy, precision and robustness.
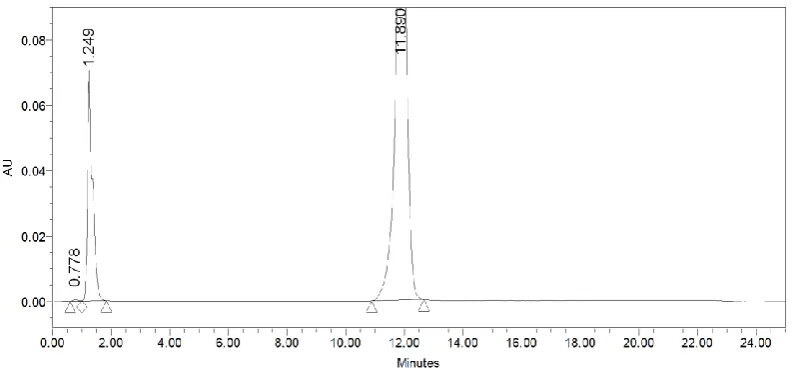
a. Specificity
Specificity is a procedure to detect quantitatively the analyte in the presence of component
that are expected to be present in the sample matrix. The peak purity index for the main peak
in standard preparation and sample preparation was determined and record in table- 1
[image:4.595.101.503.399.583.2]suggested that there was no interference from blank and placebo.
Figure II: Chromatogram of standard solution of Valsartan.
Table I: Interference from blank and placebo.
Sample Peak Purity Index
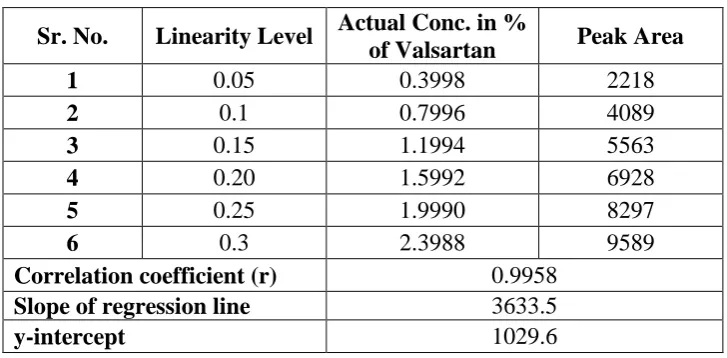
b. Linearity and Range
To evaluate the linearity, serial dilution of analyte were prepared from the stock solution in
the concentration range of 0.5µg/ml to 3µg/ml. The calibration curve was made between peak
[image:5.595.133.463.168.344.2]area and concentrations at in the range. The results of Linearity study are shown in table 2.
Figure 3: Calibration curve Valsartan.
Table II: Linearity data of Valsartan.
Sr. No. Linearity Level Actual Conc. in %
of Valsartan Peak Area
1 0.05 0.3998 2218
2 0.1 0.7996 4089
3 0.15 1.1994 5563
4 0.20 1.5992 6928
5 0.25 1.9990 8297
6 0.3 2.3988 9589
Correlation coefficient (r) 0.9958
Slope of regression line 3633.5
y-intercept 1029.6
c. LOD and LOQ
Limit of detection and limit of quantification was calculated by the proposed method which
was based on the standard deviation (s) of the response and the slope (S) of the calibration
curve at levels approximating the LOD and LOQ, LOD= 3.3 (s/S) and LOQ= 10 (s/S). The
results are given in table 3.
Table III: Results for LOD and LOQ determination
Sr. No. Samples LOD LOQ
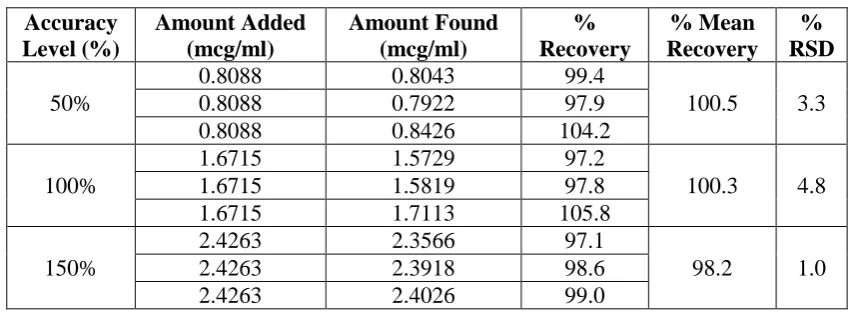
[image:5.595.116.480.401.580.2]d. Accuracy
Accuracy was determined over the range 50% to 150% of the sample concentration.
Calculated amount of Valsartan from standard stock solution was added in placebo to attain
50%, 100% and 150% of sample concentration. Each sample was prepared in triplicate at
each level. Blank and standard preparations were injected and the chromatograms were
[image:6.595.84.511.227.383.2]recorded. The reported value from recovery studies is shown in table 4.
Table IV: Results of Recovery Studies of Valsartan (n=3).
Accuracy Level (%) Amount Added (mcg/ml) Amount Found (mcg/ml) % Recovery % Mean Recovery % RSD 50%
0.8088 0.8043 99.4
100.5 3.3
0.8088 0.7922 97.9
0.8088 0.8426 104.2
100%
1.6715 1.5729 97.2
100.3 4.8
1.6715 1.5819 97.8
1.6715 1.7113 105.8
150%
2.4263 2.3566 97.1
98.2 1.0
2.4263 2.3918 98.6
2.4263 2.4026 99.0
e. Precision
The precision of method was investigated with respect to repeatability and ruggedness.
a. Method Precision (Repeatability): Method precision was established by determining the
area response of six replicate injections prepared under same conditions and the results are
shown in table 5.
Table V: Results for Area response of standard for Repeatability.
Sr. No. Valsartan (standard)
Retention time Area
1
11.89 min 11278.28 2 11.87 min 11286.30 3 11.85 min 11290.26 4 11.89 min 11294.24 5 11.86 min 11288.25 6 11.87 min 11268.32
Mean 11.872 min 11284.28
SD 9.44
b. Intermediate Precision (Ruggedness): Different analyst, using a different system,
repeated the procedure followed for method precision on a different day using same lot of
sample. The results obtained from Intermediate Precision study are recorded in table 6.
Table VI: Result for intermediate precision.
Sr. No. Valsartan (standard)
Area % Assay
1
11274.45 98.7 2 11282.34 99.6 3 11288.28 99.4 4 11290.26 100.0 5 11289.44 100.6 6 11287.48 99.8
Mean 99.68
St. Dev. 0.63
% RSD 0.64
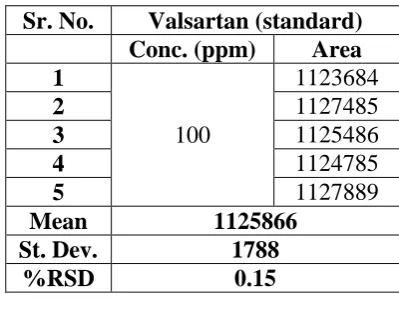
f. Robustness
The method was found to be robust, as small but deliberate changes in the method parameters
have no detrimental effect on the method performance. There was a change in flow rate of
mobile phase to 0.9 ml/min and 1.1ml/min (± 10%) and column oven temperature (± 5°C
absolute) to 35°C and 40°C. The results of Robustness study of the method are shown in table
7(a-d).
Table VIIa: Result for robustness (flow 0.9 ml/min).
Sr. No. Valsartan (standard)
Conc. (ppm) Area
1
100
1127428
2 1123248
3 1126843
4 1129021
5 1123945
Mean 1126097
St. Dev. 2430.32
Table VIIb: Result for robustness (flow 1.1 ml/min)
Sr. No. Valsartan (standard)
Conc. (ppm) Area
1
100
1123684
2 1127485
3 1125486
4 1124785
5 1127889
Mean 1125866
St. Dev. 1788
%RSD 0.15
Table VIIc: Result for robustness (temp. 30oC)
Sr. No. Valsartan (standard)
Conc. (ppm) Area
1
100
1133684
2 1129485
3 1128486
4 1129785
5 1125889
Mean 1129466
St. Dev. 2812.87
%RSD 0.25
Table VIId: Result for robustness (temp. 40oC).
Sr. No. Valsartan (standard)
Conc. (ppm) Area
1
100
1129684
2 1134485
3 1131486
4 1129785
5 1133889
Mean 1131866
St. Dev. 2246.54
%RSD 0.2
g. Forced Degradation study
The forced degradation of tablets and API was done by subjecting Valsartan to different
Stress conditions like Acidic, Alkaline, Thermal and Oxidative degradation. This study is
done for stability check of the drug in different conditions. The results were tabulated and are
Table VIII: Results for Peak Purity index and % Degradation of Valsartan.
Solution % Degradation Peak Purity Index
Acid degradation 20.55% 0.8996
Base degradation 1.14% 0.9996
Oxidation degradation 15.34% 0.8994
Thermal degradation 0.28% 0.9998
RECOVERY STUDIES OF COMMERCIAL FORMULATIONS OF VALSARTAN
Recovery studies were carried out for developed method by addition of known amount of
standard drug solution of Valsartan to pre-analyzed tablet sample solution at three different
concentration levels. Determined the concentration of drug in final dilution after addition of
known concentration of pure drug and determined the percentage recovery after deduction of
concentration of drug. Results of recovery studies were found to be satisfactory and are
reported in table 9.
Table IX: Results of analysis of commercial formulation.
Brand Name
Label claim (mg/tablet)
% Label claim estimated*
Standard deviation
Relative standard deviation
Coefficient of variance
Diovan 80 99.56 0.676 0.0067 0.678
Valent 80 99.61 0.550 0.0055 0.552
* Each value is an average of five determinations.
RESULTS AND DISCUSSION
Valsartan is an angiotensin-receptor blocker (ARB) that may be used to treat a variety of
cardiac conditions including hypertension. The optimization of the mobile phase and
selection of column for analysis was done with different trials and the one showing optimum
resolution and fulfilling the specificity conditions was chosen for the drug. The separation
was achieved on Inertsil ODS-4, 50 mm×4.6mm, 3μm by mobile phase A: having 1000 ml
Water: 1ml TFA and mobile phase B: having 400 ml water: 600 ml Acetonitrile: 1.5 ml TFA.
The linear regression analysis data for the calibration plots showed good linear relationship in
concentration range of 0.5 to 3µg/ml having linearity equation y = 3633.5x + 1029.6 and
correlation co-efficient of 0.9958. The methods were validated for specificity, accuracy,
precision, linearity, repeatability and robustness as per ICH guideline Q2 (R1). Forced
degradation studies of drug was performed for bulk and dosage form of Valsartan in acidic,
basic, peroxide and heat stress conditions where Valsartan showed instability in acidic and
the QC laboratory for routine quality check as well as for the stability studies for the
Valsartan API and tablet dosage form.
CONCLUSION
A linear, precise, accurate, robust, stability indicating RP-HPLC method has been developed
for the estimation of valsartan in active pharmaceutical ingredient and Tablet dosage form.
Simplicity of the method, economical nature and low limit of detection and quantitation
makes the method superior to the other reported HPLC methods. The developed method was
applied for the stability studies of Valsartan in bulk and Pharmaceutical dosage form. The
proposed method has the capability to separate the analyte from their degradation products
obtained during forced degradation studies. The method can be employed for the routine
analysis of Valsartan in Bulk and tablet dosage form.
ACKNOWLEDGEMENTS
The authors express their sincere gratitude to Lupin Pharmaceuticals Ankleshwar, Gujrat, for
providing the pure drug sample of Valsartan.
CONFLICT OF INTERESTS
The authors declare that there is no conflict of interest.
FINANCIAL SUPPORT AND SPONSORSHIP: Nil.
REFERENCES
1. Barar FSK. “Essentials of pharmacotherapeutics”. S. chand and company ltd; reprint,
2004; 298-301, 239-249.
2. Rang HP, Dale MM, Ritter JN and Moore PK. Pharmacology. 5th edition. Churchill
livingstone; Elsevier science ltd, 2003; 307-317.
3. Haque MA, Amrohi SH, Kumar P, Nivedita G, Kumar PT, Mohanty D, Diwan P.
Stability indicating RP-HPLC method for the estimation of Valsartan in pharmaceutical
dosage form. IOSR Journal of Pharmacy, 2012; 2(4): 12-18.
4. Vinzuda DU, Sailor GU, Sheth NR. RP-HPLC Method for Determination of Valsartan in
Tablet Dosage Form. Int. J. Chem Tech Res, 2010; 2(3): 1461-1467.
6. Bakshi M. Singh S. Development of Validated stability-indicating assay methods-Critical
review. Journal of Pharmaceutical and Biomedical Analysis, 2002; 1011–1040.
7. ICH, Q1A (R2), Stability Testing of New Drug Substances and Products, International
Conference on Harmonization, Geneva, 6th February 2003; 1-18.
8. ICH, Q2B, Validation of Analytical procedures, Methodology, International Conference