ENDOCRINE CONTROL OF OSMOREGULATION IN
THE EURYHALINE EEL, 'ANGUILLA ANGUILLA'
Mary Louise Tierney
A Thesis Submitted for the Degree of PhD
at the
University of St Andrews
1993
Full metadata for this item is available in
St Andrews Research Repository
at:
http://research-repository.st-andrews.ac.uk/
Please use this identifier to cite or link to this item:
http://hdl.handle.net/10023/14936
u
Endocrine control of osmoregulation in the
euryhaline eel,
Anguilla anguilla.
Mary Louise Tierney
Thesis submitted for the degree of
Doctor of Philosophy
in the University of St. Andrews.
April 1993
ProQuest Number: 10166201
All rights reserved
INFORMATION TO ALL USERS
The quality of this reproduction is d ep en d en t upon the quality of the copy submitted.
In the unlikely ev en t that the author did not send a co m p lete manuscript
and there are missing p a g es, these will be noted. Also, if material had to be rem oved, a n o te will indicate the deletion.
uest
ProQuest 10166201
Published by ProQuest LLO (2017). Copyright of the Dissertation is held by the Author.
All rights reserved.
This work is protected against unauthorized copying under Title 17, United States C o d e Microform Edition © ProQuest LLO.
ProQuest LLO.
789 East Eisenhower Parkway P.Q. Box 1346
Declaration
a) I, Mary Louise Tierney, hereby certify that this thesis has been composed by myself, that it is a record of my own work, and that it has not been accepted in partial or complete fulfilment of any other degree or qualification.
Signed Date
b) I was admitted to the Faculty of Science of the University of St. Andrews under Ordinace No. 12 in October 1989, and as a candidate for the degree of Ph.D in October 1989.
Signed Date
c) We hereby certify that the candidate has fulfilled the conditions of the Resolution and Regulations appropriate to the degree of Ph.D.
Unrestricted copyright
In submitting this thesis to the University of St Andrews I understand that I am giving permission for it to be made available for use in accordance with the regulations of the University Library for the time being in force, subject to any copyright vested in the work not being affected thereby. I also
Abstract
1. Groups of eels, Anguilla anguilla^ were adapted from freshwater ( FW ) to seawater. ( SW ) for periods of 90 - 300 mins. maximum ( acute
transfer ), 0 - 7 days ( chronic transfer ), or for more than 14 days ( long term seawater transfer ).
2. Acute SW transfer led to a decline in blood pressure, an elevation in plasma osmolality and chloride concentration, an immediate “reflex" drinking response and a non-significant increase in plasma
angiotensin II ( All ) concentration.
3. Administration of papaverine to FW adapted eel caused hypotension, with subsequent recovery of blood pressure, elevation in the drinking rate and plasma All concentration, and a decline in plasma osmolality. Captopril alone had no effect on blood pressure, drinking rate,
osmolality or All concentration, but was sucesssful in partially blocking the papaverine-induced blood pressure recovery and increase in AH concentration, with complete inhibition of the drinking.
5. Chronic SW transfer led to a general decline in blood pressure, increase in plasma electrolyte concentration, elevation in drinking rate after 4 - 5 days, an increase in plasma All concentration, and a rise in Na+-K+-ATPase, all leading to long term SW values.
6. Plasma arginine vasotocin concentrations were unchanged in long term-FW and SW adapted fish, with a small transitory rise after 4 days in SW.
7. Cortisol plasma concentrations were similar in both long term- FW and SW- adapted fish, with a rise observed 1 day after transfer to SW.
8. Metabolic clearance rates ( MCR ) and blood production rates ( BPR ) were significantly elevated in long term SW adapted fish and during chronic SW adaptation, compared to the FW levels.
Acknowledgements
Firstly, I would like to thank my supervisors. Dr. Neil Hazon and Dr. Gordon Cramb, for providing me with excellent guidance and support throughout the duration of this research project. Their enthusiasm and drive was a constant source of inspiration and encouragement.
I would also like to thank Professor B. Lahlou, Dr. M. Guibbolini, and the other researchers in their department, for the extremely enjoyable time I spent in their lab in the University of Nice, France while being shown how to cope with hepatocytes. Dr. R. Balment and Justin Warne carried out the arginine vasotocin assay in Manchester and Professor Nussberger (Lausanne, Switzerland) must be thanked for the provision of Angiotensin II antibody.
Everyone within the research group in St. Andrews and at the Gatty Marine Lab. must be gratefully thanked for creating such a pleasant and cooperative working environment, especially Dr. G. Luke for his sense of humour over a tube of All antibody,and also Dr. C. Cutler, Gary Anderson and Susan Carroll, The blood pressure drawings are due to the hard work of Karen Johnstone, and Ron Stuart kindly cut the tissue sections for the
autoradiography experiments.
Jane Williamson and Karen Bell are to be specially thanked for all their support during the writing up stage, Karen for the proof reading and
"taxi service" and Jane for allowing me to virtually take over her office during the last few hectic days of thesis preparation. Many others within St. Andrews deserve a mention, but especially Toni Beddow, for her friendship over the last few years.
A special word of thanks must go to Dr. Kenneth Armour for all his help, advice and sense of humour, and for his continual encouragement and belief that assays will ultimately work.
Table of Contents
page no.
TO Introduction
1.1 Osmoregulation 1
1.1.1 Terrestrial environment 1
1.1.2 Freshwater environment 1
1.1.3 Seawater environment 2
1.2 Teleost skin 3
1.3 Teleost gills 4
1.3.1 Gill structure 4
1.3.2 Chloride cell 6
1.3.3 Transport protein 9
1.3.4 Transport mechanisms 11
1.4 Teleost gut 16
1.5 Kidney and urinary bladder 20
1.5.1 Teleost kidney 22
1.5.1a Morphology 24
1.5.1b Function 25
1.5.2 Teleost urinary bladder 29
1.6 Hormones 31
1.7 Receptors 33
1.8 Pituitary gland 35
1.8.1 Structure of adenohypophysis 35
1.8.2 Adenohypophysial secretions 37
1.8.2a Prolactin 38
1.8.2ai Prolactin in fish 39
1.8.2b Growth hormone 43
1.8.2c Somatolactin 45
1.8.4 Neurohypophysial secretions 47
1.8.4a Effect on gill function 49
1.8.4b Effect on renal function 50
1.9 Adrenocortical homologue 52
1.9.1 Structure of adrenocortical homologues 52
1.9.2 Structure of steroids 54
1.9.3 Structure of corticosteroids 58
1.9.4 Cortisol and fish osmoregulation 59
1.9.5 Steroid dynamics 62
1.9.5a Determination of secretory dynamics 63
1.9.5ai Blood production rate 63
(i) Single injection 63
(ii) Constant infusion 64
1.9.5aii Urinary production 65
1.9.5b Cortisol secretory dynamics in teleosts 66
1.9.6 Catecholamines 66
1.10 The renin-angiotensin system 69
1.10.1 Introduction 69
1.10.2 Effect of the RAS on cardiovascular system 73
1.10.3 Effect of the RAS on drinking in fish 75
1.10.4 Effect of the RAS on renal action 79
1.10.5 Interaction between the RAS and other
hormones in control of water and electrolytes 82
1.10.6 Angiotensin receptor studies 84
1.11 Natriuretic peptides 85
1.11a Atrial natriuretic peptide in fish 89
1.11 ai Heterologous studies 90
l.lla ii Homologous studies 92
1.11b Interaction between atrial natriuretic peptide
1.11c Brain, C-type and ventricular natriuretic
peptides 93
1.12 Caudal neurosecretory system in fish 94
1.13 Thyroid hormones 97
1.14 Objectives 99
2.0 Material and Methods
2.1 General chemicals 101
2.2 Radioimmunoassay of angiotensin U 101
2.2.1 Standard assay procedure 101
2.2.2 Inter- and intra-assay variation 102
2.2.3 Extraction of angiotensin II 102
2.3 Radioimmunoassay of arginine vasotocin 103
2.4 Radioimmunoassay of cortisol 103
2.4.1 Standard assay procedure 104
2.4.2 Extraction of cortisol 105
2.5 Animals 105
2.6 Cannulations of blood vessels 103
2.7 Osmotic adaptation terminology 106
2.8 In vivo studies 106
2.8.1 Acute studies 106
2.8.2 Chronic studies 108
2.9 Blood pressure studies 108
2.10 Pharmacological manipulation of the RAS 109
2.11 Determination of drinking rate 109
2.12 Determination of cortisol secretory dynamics 110 2.12.1 High performance liquid chromatography 111
2.13 Na^-K^-ATPase activity assay 112
2.13.1 Membrane isolation 112
2.13.3 Determination of inorganic phosphate 113
2.14 Angiotensin II receptor studies 114
2.14.1a Isolation of hepatocytes 114
2.14.1b ^^^I-AII binding studies 116
2.14.2 Autoradiography 118
2.15 General plasma electrolyte analysis 121
2.16 Determination of protein 121
2.17 Statistical analysis 122
3.0 Results
3.1 Hormone radioimmunoassay 123
3.1.1 Radioimmunoassay of angiotensin II 123
3.1.2 Radioimmunoassay of cortisol 123
3.2 Acute studies 128
3.2.1 Blood pressure 128
3.2.2 Plasma electrolyte composition 128
3.2.3 Drinking rate 128
3.2.4 Angiotensin II concentration 134
3.3 Pharmacological manipulation of the RAS 134
3.3.1 Freshwater-adapted fish 134
3.3.1a Blood pressure 134
3.3.1b Plasma electrolyte analysis 137
3.3.1c Drinking rate 137
3.3.1d Angiotensin II concentration 140
3.3.2 Seawater-adapted fish 142
3.3.2a Blood pressure 142
3.3.2b Plasma electrolyte analysis 145
3.3.2c Drinking rate 145
3.3.2d Angiotensin II concentration 145
3.4.1 Blood pressure 150
3.4.2 Plasma electrolyte analysis 150
3.4.3 Drinking rate 154
3.4.4 Angiotensin II concentration 154
3.4.5 Arginine vasotocin concentration 154
3.4.6 Cortisol 158
3.4.6a Cortisol concentration 158
3.4.6b Cortisol dynamics 158
3.4.6c Metabolism of cortisol 158
3.4.6d Metabolic clearance rate
and blood production rate 162
3.4.7 Na'*'-K+-ATPase activity 165
3.4.8 Receptor studies 170
3.4.9 Protein determination 175
4.0 Discussion 176
5.0 References 209
List of Figures
Page
Figure 1.1 Schematic representation of gill lamella 5 Figure 1.2 Schematic representation of choride cell 7 Figure 1.3 Schematic representation of Na+-K+-ATPase enzyme 10 Figure 1.4 Possible mechanisms of ion uptake in FW fish gill 13 Figure 1.5 Route and mechanism of salt extrusion
across SW fish gill 15
Figure 1.6 Model of water and ion distribution in the
oesophageal mucus 17
Figure 1.7 Possible mechanisms of ion transport in the
teleost intestine 21
Figure 1.8 Five configurational types of marine teleostean kidneys 23 Figure 1.9 Postulated mechanisms of NaCl in SW teleost proximal
tubule 28
Figure 1.10 Phylogentic tree of vertebrate groups with
superimposed diagrams of sagittal sections of the
typical pituitary gland in each group 36
Figure 1.11 Amino acid sequences of the prolactin family 40
Figure 1.12 Basic steroid structure 55
Figure 1.13 Interrelationships and formation of the steroid
horm ones 56
Figure 1.14 The mammalian renin angiotensin system 70 Figure 1.15 Amino acid sequence of selected members of the
natriuretic peptide 86
Figure 1.16 Transcription and translation of the atrial natriuretic
Figure 1.7 Possible pathways of urotensin action on
teleost osmoregulation 98
Figure 2.1 Schematic diagram of the holding tank for
the acute transfer of eel from FW to SW 107 Figure 2.2 Diagram of closed recirculating system for the
perfusion of isolated liver 117
Figure 2.3 Method for embedding of eel tissue in wax 119 Figure 2.4 Method for rehydration and dewaxing of tissue
sections prior for use in autoradiography 119 Figure 2.5 Method for the photographic development of slides 120 Figure 2.6 Method for the histological staining of slides 120 Figure 3.1 Standard curve for radioimmunoassay of Angiotensin II 124 Figure 3.2 Standard curve for radioimmunoassay of cortisol 126 Figure 3.3 Typical blood pressure trace after acute SW adaptation 129 Figure 3.4 Effect of acute SW adaptation on mean arterial blood
pressure 130
Figure 3.5 Effect of acute SW adaptation on drinking rate 132 Figure 3.6 Effect of acute SW adaptation on All concentration 133
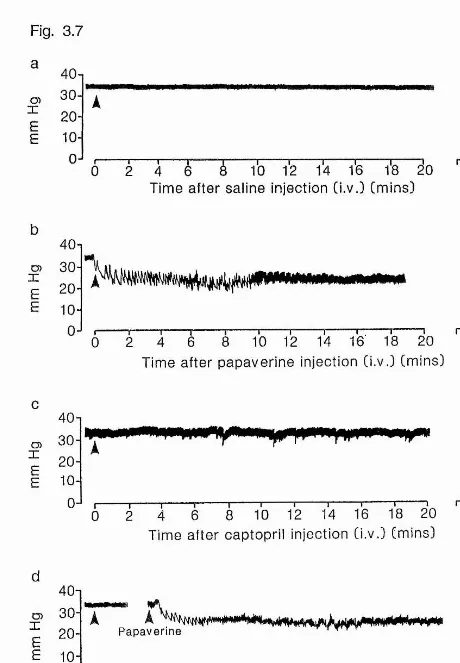
Figure 3.7 Typical blood pressure traces after administration of
papaverine and / or captopril to FW-adapted eel 135 Figure 3.8a Effect of administration of papaverine on
mean arterial blood pressure of FW eels 136 Figure 3.8b Effect of administration of papaverine after an injection
of captopril on mean arterial blood pressure of FW eels 136 Figure 3.9 Effect of administration of papaverine and/or captopril
Figure 3.10 Effect of administration of papaverine and/or captopril
on Angiotensin II concentration of FW eels 141 Figure 3.11 Typical blood pressure traces after administration of
papaverine and/or captopril to SW-adapted eel 143 Figure 3.12a Effect of administration of papaverine on mean arterial
blood pressure of SW eels. 144
Figure 3.12b Effect of administration of captopril on mean arterial
blood pressure of SW eels. 144
Figure 3.12c Effect of administration of papaverine after an injection of captoptril on mean arterial blood pressre of SW eels. 144 Figure 3.13 Effect of administration of papaverine and/or captopril on
drinking rate of SW eels. 147
Figure 3.14a Effect of administration of papaverine on Angiotensin II
concentration of SW eel. 148
Figure 3.14b Effect of administration of papaverine and/or captopril on Angiotensin II concentration of SW eels. 148 Figure 3.15 Typical blood pressure traces after chronic- and
long-term SW-adaptation 151
Figure 3.16 Effect of chronic- and long term- SW adaptation on
mean arterial blood pressure 152
Figure 3.17a Effects of chronic- and long term- SW adaptation on
plasma osmolality 153
Figure 3.17a Effects of chronic- and long term- SW adaptation on
plasma chloride concentration 153
Figure 3.17a Effects of chronic- and long term- SW adaptation on
plasma sodium concentration 153
Figure 3.18 Effects of chronic- and long term SW- adaptation on
Figure 3.19 Effects of chronic- and long term SW- adaptation on
Angiotensin II concentration 156
Figure 3.20 Effects of chronic- and long term SW- adaptation on
plasma Arginine Vasotocin concentration 157 Figure 3.21 Effects of chronic- and long term SW- adaptation on
plasma cortisol concentration 159
Figure 3.22 Constant isotopic infusion 160
Figure 3.23a HPLC profile of plasma spiked steroid standards 161 Figure 3.23b HPLC profile of plasma spiked with tritiated cortisol 161 Figure 3.23c HPLC profile of plasma from SW eel previously
infused with tritiated cortisol 161
Figure 3.24a Effect of chronic- and long term- SW adaptation on
cortisol concentration 164
Figure 3.24b Effect of chronic- and long term- SW adaptation on
Metabolic Clearance Rate (MCR) of cortisol 164 Figure 3.24c Effect of chronic- and long term- SW adaptation on
Blood Production Rate (BPR) of cortisol 164 Figure 3.25 Standard curve for the determination of inorganic
phosphate 166
Figure 3.26a Effect of temperature on Na+-K^-ATPase activity in
gill membranes from long term- SW adapted eels. 167 Figure 3.26b Effect of membrane dilution on Na^-K’^-ATPase activity
in gill membranes from long term- SW adapted eels. 167 Figure 3.27 Effect of chronic- and long term- SW adaptation on
Na'^-K'^-ATPase activity in gill membranes 168 Figure 3.28 Effect of chronic- and long term- SW adaptation on
Figure 3.29 Percentage specific binding of to tissues of eel
during FW to SW transfer 174
Figure 3.30a Transverse section of eel brain 176
Figure 3,30b Background binding of All to cerebellum of
FW adapted eel 177
Figure 3.30c Non specific binding of All to cerebellum of
FW adapted eel 177
Figure 3.30d Total binding of All to cerebellum of FW adapted eel 178 Figure 3.30e Total binding of All to cerebellum of
6 day SW transfer eel 178
Figure 3.30f Total binding of All to medulla oblongata
of FW adapted eel 179
Figure3.30g Total binding of All to medulla oblongata of
6 day SW transfer eel 179
Figure 3.30h Total binding of All to gill of FW adapted eel 180 Figure 3.30i Total binding of All to head kidney of FW adapted eel 180 Figure 3.30j Total binding of All to caudal kidney of FW adapted eel 181 Figure 3.30k Total binding of All to caudal kidney of
6 day SW transfer eel 181
Figure 3.301 Total binding of All to liver of FW adapted eel 182 Figure 3.30m Total binding of All to liver of 6 day SW transfer eel 182 Figure 3.31 Typical standard curve for the measurement of protein 183 Figure 4.1 Relationship between drinking rate and angiotensin II
plasma concentration during chronic and
long term SW adaptation 194
Figure 4.2 Relationship between cortisol BPR and angiotensin II plasma concentration during chronic and
List of tables
Table 1.1 Structure and phytogeny of vertebrate neurohypophysial
horm ones 48
Table 1.2 Major corticosteroids produced In vertebrate^^ groups, 57
Tablel.3 Angiotensin I amino acid sequence 72
Table 1.4 Vascular effects of angiotensin in
non-mammalian vertebrates 74
Table 1,5 Dipsogenic effects of angiotensin in
non-mammalian vertebrates 76
Table 1.6 Renal effects of angiotensin in
non-mammalian vertebrates 81
Table 1.7 Effects of atrial natriuretic peptide in fishes 91 Table 2.1 Modified buffers used for the isolation of hepatocytes
from long term FW- and SW-adapted eels 115 Table 3.1 Extraction of angiotensin II from eel plasma 125 Table 3.2 Extraction of cortisol from eel plasma 127
Table 3.3 Effect of acute SW adaptation on plasma composition 131 Table 3.4 Effect of administration of papaverine and/or captopril
on plasma osmolality of FW eels 138
Table 3.5 Effect of administration of papaverine and / or captopril
on plasma osmolality of SW eels 146
Table 3.6 Percentage metabolism of infused tritiated-cortisol
during constant isotopic infusion 163
Table 3,7 Variations to ^^^I-AII binding assay 171
Table 3.8 Specific grain density of ^^^I-AII binding to tissues
of eel during FW to SW transfer 172
Abbrevation
AI angiotensin I
All angiotensin II
ACE angiotensin converting enzyme
AHP adenohypophysis
ACTH adrenocorticotropin
ANP atrial natriuretic peptide
ANPir immunoreactive atrial natriuretic peptide
ATP adenosine trisphosphate
ATPase adenosine trisphosphatase
AVP arginine vasopressin
AVT arginine vasotocin
®max maximal binding capacity
BPR blood production rate
BNP brain natriuretic peptide
BSA bovine serum albumin
C concentration
C-ANP C-type natriuretic peptide
Caudal- NS caudal neurosecretory system
cAMP cyclic adenosine 3% 5'-monophosphate
CRF corticotropin releasing factor
c.p.m. counts per minute
d.p.m. disintegrations per minute
EDTA ethylenediamine tetra-acetic acid
EGM extraglomerular mesangium
FSH follicle stimulating hormone
FW freshwater
GFR glomerular filtration rate
I constant state of infusion
IT isotocin
i.v. intravenous
JGA juxtaglomerular apparatus
Kd
dissociation constantLFH lipotropin
LH leutinising hormone
MD macula densa
MCR metabolic clearance rate
MSH m elanotropin
MS222 tricaine methanosulphate
NHP neurohypophysis
OT oxytocin
PD pars distalis
PI pars intermedia
PT pars tuberalis
PRA plasma renin activity
PRL prolactin
RAS renin angiotensin system
RIA radioimmunoassay
Ri
amount of radioactivity injectedS.D. standard deviation
S.E.M. standard error of the mean
SEM scanning electron microscopy
SNGFR single nephron glomerular filtration rate
SL somatolactin
SA amount of radioactivity or unique hormone in
SW seawater
T time of urine collection
TEM transmission electron microscopy
temp temperature
TMAO trimethylamine N-oxide
TMG renal tubular maxima for glucose
TSH thyrotropin
UI urotensin I
UII urotensin II
VNP ventricular natriuretic peptide
1.1 Osmoregulation
In order to survive, vertebrates must maintain both the volume of their extracellular fluid and the concentration of the solutes within rather narrow limits. Osmoregulation is the term applied to the homeostatic mechanism involved in regulating the concentrations of body fluids. The underlying mechanisms of vertebrate osmoregulatory homeostasis are similar throughout the group. The kidney, the organ of volume regulation, is ubiquitous and, depending on the class, also works in association with extra-renal regulators such as gills, gut, urinary bladder, skin, cloaca and salt glands to maintain body fluid volume and composition. The problems of water balance encountered by organisms vary greatly and primarily depend upon the environment in which they live.
1.1.1 Terrestrial environment
The greatest physiological threat to life on the land is the risk of dehydration. Terrestrial vertebrates may lose water by evaporation across skin and respiratory surfaces, excretion in the urine and faeces and through sweating and panting. Water loss can be minimised by decreasing skin permeability and reducing respiratory evaporation by nasal exhalation.
Urinary loss is reduced in mammals by the production of urine hyperosmotic to the plasma, and in birds by the production of an almost water-free urine. Reptiles are incapable of producing a hypertonic urine.
1.1.2 Freshwater environment
( Maetz, 1971 ) and by the skin of amphibians ( Middler et al., 1968; Bentley, 1973 ).
1.1.3 Seawater environment
Marine vertebrates osmoregulate in one of two ways. They either maintain their body fluids iso- or hyper-osmotic to the environment, or regulate hyposmotically to the environment with plasma osmolality 25 - 30% that of seawater ( SW ). The latter gain solutes and lose water across
permeable membranes. In marine teleosts this is compensated for by drinking large volumes of SW and excreting excess absorbed sodium and chloride across the gills and excess magnesium via the kidneys ( Keys and Wilmer, 1932 ). Marine reptiles and birds possess cephalic salt glands for the excretion of excess sodium and chloride ( Schmidt-Nielsen, 1960 ) and marine mammals produce a hyperosmotic urine.
Marine vertebrates that maintain an iso- or hyper-osmotic plasma include some cyclostomes, elasmobranchs, holocephalans, coelacanths and a single amphibian. The cyclostomes are divided into two distinct groups; lampreys, some of which are euryhaline and apparently osmoregulate like euryhaline teleosts; and the stenohaline marine hagfish, which maintain body sodium and chloride concentrations similar ( but not identical ) to SW. Osmotically, hagfish behave like many marine invertebrates and are
considered as osmoconformers with limited but specific ionic regulation ( Stolte and Schmidt-Nielsen, 1978 ).
loss but considerable ionic regulation occurs at the gills and kidney and, in addition, in elasmobranchs, the rectal gland.
The following section's will deal with the organs involved in the osmoregulatory process of euryhaline teleosts, with particular attention to changes that occur in these organs concomitant with movement of the fish from FW to SW.
1.2 Teleost skin
The skin of fish forms the interface between the body fluids and the aqueous environment in which they live. The skin of fish is quite
impermeable to water and solutes and thereby limits exchanges with the environment, FW or SW ( Fromm, 1968 ). Studies on isolated fish skin are complicated by its adherence to the underlying muscle, and it is difficult to remove without causing damage. In marine fish, the skin is often thicker than that observed in FW species and is supplied with mucus glands and protected by scales. Mucous itself is not impermeable but it may form a layer of reduced exchange of salt and water close to the skin surface ( Parry, 1966 ). Mitochondrial-rich cells have been shown to be present in the flat opercular epithelium of teleost head regions. These cells have been identified as anatomically resembling the chloride cells found in the gill epithelium (see below) ( Karnarky and Kinter, 1977 ).
Chloride cells have been found in the skin of some fish larvae and were first reported in the skin of sardine ( Sardinops caerulea ) ( Lasker and Threadgold, 1968 ). Hwang ( 1990 ) demonstrated that, upon SW adaptation, chloride cells, present in the skin of the larvae of ayu ( Plecoglossus aUivelis ), undergo structural modifications which include the development of
hatching but after larval development there was an apparent concentration of the cells in the central region of the lateral skin ( Hwang, 1990 )
1.3 Teleost Gills 1.3.1 Gill structure
The basic teleost gill consists of four branchial arches, extending from either side of the pharynx, and which lie beneath the operculum of the fish. A double row of gill filaments, or primary lamellae, extend at right angles from the gill arch. The primary lamellae bear a row of respiratory lamellae on each side. The gill is comprised of two types of epithelial; the primary epithelium which covers the primary lamellae including the interlamellar region, and the secondary epithelium which covers the free part of the respiratory lamellae ( see Figure 1.1 ) ( Laurent and Dunel, 1980 ).
The secondary epithelium is generally composed of an outer mucosal layer of flat respiratory cells, also called pavement cells and an inner serosal layer of nondifferentiated cells ( Laurent and Dunel, 1980 ). The respiratory cells are 3 - 5 jim thick, contain relatively few mitochondria, a prominent Golgi apparatus and an abundant rough endoplasmic reticulum ( Maetz, 1971 ). These cells are linked by tight junctions and desmosomes with no gap junctions observed ( Sardet et ah, 1979 ). The structure of the respiratory cells appear to be unaffected by environmental salinity. Chloride cells ( see below ) have, however, been shown to be present in the secondary epithelium and their proliferation may be in response to a specific ion deficiency ( Keys and Willmer, 1932; Avella et al, 1987 ).
Primary lamella
Secondary lamella
Efferent arteriole
Afferent arteriole
r Central venous sinus
Two blood pathways exist in each gill arch, the arterioarterial and arteriovenous pathways, as shown in Figure 1.1. The arterioarterial pathway supplies blood to the secondary epithelium ( Laurent and Dunel, 1980 ) and consists of the afferent branchial artery, the afferent primary artery situated in each primary lamellae, the respiratory lamellae capillaries and the primary and branchial efferent arteries ( Laurent and Dunel, 1976 ). Innervated sphincters located in the primary lamellae control the arterioarterial vasculature, with perhaps a contribution from the pillar cells as a result of their contraction. The arteriovenous pathway supplies blood to the primary lamellae ( Laurent and Dunel, 1980 ). This vasculature originates from
arterioarterial anastomoses which open directly into the central venous sinus ( CVS ). In the eel and Holostei and Chondrostei groups of fish these
anastomoses are located on both the afferent and efferent parts of the
vasculature, while in the trout they are only on the efferent section. The CVS lies in the core and along the length of the primary lamellae and drains into the branchial veins ( Laurent and Dunel, 1976 ). The primary lamellae blood flow is controlled by a sphincter located around the efferent artery dose to its branchial artery junction ( Laurent and Dunel, 1980 ), Thus there is a
distinction in the irrigation of the two epithelia ( Girard and Payan, 1980 ).
1.3.2 Chloride cell
The site of ion transport across the gill epithelium is generally accepted to be the chloride cell ( Motais and Garcia-Romeu, 1972; Zadunaisky, 1984 ). Chloride cells ( Figure 1.2 ) are large, acidophilic, non-mucus, granular cells containing many mitochondria and were first described by Keys and Wilmer ( 1932 ). They are present in both euryhaline and stenohaline species of FW or SW teleosts. These cells are predominantly situated in the primary
Figure 1 . 2 Schematic representation of a chloride cell from
Apical pit ,
T ight junction i L eaky juncl.on
R e s p i r a t o r y Cell
Tubular S y s t e m
N u c l e u s
à
Vesicles
0)
u %)
c .
Ü
o> c
3 o n
r . s
z
M i t o c h o n d r i a B a s e m e n t
characterised by depressions known as apical crypts and a dense tubular
system that opens on the basolateral plasma membrane. The apex of each cell has microvilli and is firmly bound to the neighbouring pavement cells by a long and tight junctional apparatus ( Laurent and Dunel, 1980 ).
It is reported that chloride cells undergo characteristic changes in relation to the salinity of the external environment. Two types of chloride cell, a- and P-chloride cells, have been reported to be present in the gill
epithelium of the FW-adapted teleosts, such as the euryhaline guppy, Lebistes reticulatus, and the stenohaline gudgeon ( Gohio gobio ) and loach ( Cobitis taenia ) ( Pisam et al, 1987; 1990 ). Transfer from FW to SW apparently
induced the degeneration of the p-chloride cell and the transformation of the a-chloride cell to the single chloride cell type present in fully adapted SW fish ( Pisam et al, 1987 )
The number of chloride cells is reported to increase upon transfer from FW to SW ( Shirai and Utida, 1970; Utida et al, 1971; Thomson and Sargent, 1977 ) and also undergo structural reorganisation. Acclimation of euryhaline teleosts to SW is accompanied by enlargement of the chloride cell and a deepening of the apical crypt ( Olivereau, 1970; Hossler, 1980 ). In general the other epithelial cells entirely cap the distal portion of the chloride cell apart from the apical crypt ( Philpott and Copeland, 1963 ), and therefore it is the apical crypt which provides the chloride cell with direct contact with the external medium ( Maetz, 1971 ). These pits can be shared by more than one chloride cell ( Sardet et al, 1979 ). With transfer to SW, the proliferation of chloride cells leads to the formation of a complex of two or more
interdigitations of these cells, joined together by shallow gap junction, while retaining the tight junction with the pavement cells ( Sardet et al, 1979 ).
between the chloride cell and the pavement cell layers ( Laurent, 1984 ). They are linked to the chloride cells via single strand short junctions. These
junctions are thought to be leaky and, therefore, Sardet et al. ( 1979 )
hypothesised that transepithelial movement of sodium ions ( Na+ ) occurs via intercellular junctions, whereas chloride ions ( CT ) are actively
transported across the chloride cells.
1.3.3 Transport protein
The enzyme, Na'^-K'^-ATPase, is found in association with the teleost chloride cell. Autoradiographical studies have revealed that Na+-K+-ATPase is located on the serosal rather than the mucosal side of the chloride
( Karnaky et al., 1976 ). In this study tritiated ouabain, perfused via an intracardiac catheter into Fundulus heteroclitus, adapted to different
salinities, was demonstrated to bind to the entire chloride cell surface apart from the apical crypt, indicating enzyme localisation on the basolateral membrane. A further indication of the location of Na+-K^-ATPase arises from a greater inhibition in activity by ouabain administered in the blood rather than to the gill exterior ( Silva et al, 1977 ; Epstein et al, 1973 ).
Na"*"-K^-ATPase is a ubiquitous integral protein of the plasma
membrane and is responsible for the active transport of K+ into and Na"*" out of cells against their concentration gradients ( Jorgensen, 1980 ). The enzyme acts in a cyclic fashion. The basic Na**'“K‘*'-ATPase reaction leads to the
hydrolysis of ATP to ADP and inorganic phosphate, with the translocation of three Na ions to the extracellular compartment coupled to the transport of two K ions to the intracellular compartment, per molecule of ATP split ( Schuurmans Stekhoven and Bonting, 1981 ) ( Figure 1.3 ).
Figure 1.3
A,
+
Ou
§
ca
Z
c
This subunit possesses an ATP-binding site and a phosphorylation site on the cytoplasmic side, and a binding site for cardiac glycosides, such as ouabain, on the extracellular side, as shown in Figure 1.3. The cardiac glycosides inhibit the activity of the enzyme, a feature which is utilised in the determination of enzyme activity. Although to date the p-subunit has not been demonstrated to be involved in the functional aspect of the enzyme, its association with the a-subunit appears essential for the activity of the enzyme ( Sweadner, 1989 ). Both subunits span the entire membrane ( Cantley, 1981 ).
In teleosts, Na+-K^-ATPase activity has been shown to vary in proportion to the external salinity, with the highest level in stenohaline marine species and euryhaline fish adapted to SW ( Epstein et a/., 1967; Kamiya and Utida, 1968; Jampol and Epstein, 1970; Zaugg and McLain, 1970; Utida et aL, 1971; Forrest et al, 1973; Ho and Chan, 1980 ). The reported values of Na'^-K^-ATPase activity vary and are dependent partly upon the
membrane extraction procedure, subsequent purification of the preparation, and the temperature at which the biochemical assay is carried out ( Kamiya and Utida, 1968; Sargent et al, 1975; Pfeiler, 1978; Busacker and Chavin, 1981 ). An increase in the level of Na'*'-K'*'-ATPase activity was observed with
transfer of euryhaline teleosts such as the killifish ( Epstein et al, 1967), coho salmon, Oncorhynchus kisutch ( Zaugg and McLain, 1970 ), the Japanese eel ( Kamiya and Utida, 1968; Utida et al, 1971; Ho and Chan, 1980 ), American eel ( Forrest et al, 1973 ) European eel ( Bornancin and De Renzis, 1972 ) and Dormitator maculatus ( Evans and Mallery, 1975 ) from FW to SW.
1.3.4 Transport mechanisms
The precise site of ion exchange in FW teleosts is not clear, although the chloride cells and the respiratory pavement cells have both been
implicated ( Pisam et al, 1989 ). The nature of ion exchange in FW-adapted teleosts is also unclear although the active uptake of the major ions, Na*^ and
K+, have been demonstrated to be independent of each other ( Krogh, 1938 ). Ion exchange is reported to occur with HCO3" being exchanged for Cl"
( Kerstetter and Kirschner, 1972 ). Na+ uptake had been linked to both and exchange ( Wright ef a/., 1989 ). Figure 1.4 demonstrates some of the possible routes of ion uptake in FW teleosts.
The short-circuit current technique has been utilised in the study of the mechanism of SW ion transport. This technique requires sections of
epithelium, containing particular transport cells, to be laid out flat in Ussing chambers, hence the unsuitability of the complex gill tissue and the suitability of the flat opercular epithelium. The opercular skin of the killifish Fundulus heteroclitus consists of a stratified epithelium, composed of four major cell types, mucus cells, pavement cells, non-differentiated cells and chloride cells, with an underlying connective tissue layer ( Degan et al, 1977 ). The
morphology of the opercular chloride cell resembles the SW-adapted teleost gill chloride cell. The similar nature of the chloride cell of the isolated operculum to the gill chloride cell means that the opercular chloride cell can be used in the study of SW ion transport and the results extrapolated to the functions of the branchial chloride cell. In addition the opercular epithelium is not complicated by the presence of respiratory cells ( Karnaky and Kinter, 1977).
The conditions employed in the short-circuit current technique means that any net movement recorded across the membrane must occur by an active process. Using this technique it has been demonstrated that the efflux of CT is seven times greater than influx, indicating the presence of a CT secretory mechanism in the opercular membrane of the tilapia, Sarotherdon mossambicus, with similar responses observed in the killifish and the goby, Gillichthys mirabilis ( Foskett et al, 1983 ). Foskett and Scheffey ( 1982 ) using the vibrating probe technique, which permits the measurement of
extracellular ion density immediately above the epithelial surface, obtained
Figure 1.4
Figure 1.4 Possble mechanisms of ion uptake in FW fish gill CO2 degradation by carbonic anhydrase provides bicarbonate
ions for exchange v^ith CT (1). The from CO2 breakdwon
may combine with NH3 ions (2) to produce NH4'*' ions which
can be exchanged with Na*^ (3). The alternatives are Na+-H+ exchange (4) or electrogenic H"*" transport with passive flux of Na*** (not shown ). The Na"^ crosses the basolateral membrane via a Na^K^ exchange with accompanying passive CT
transport.
03 C L_
0
X
LU
C
0
E
c
o
&_ ’>
c
0
0
II
il
Ü+ X
oo
Ü ' (0z
direct evidence of the localisation of Cl" secretion in the chloride cell of the operculum and, by inference, the gill as well. The Cl" secretory mechanism of the goby was shown to be sensitive to ouabain, a response which is indicative of a dependence on the Na+-K+-ATPase ( Marshall, 1981 ), and was inhibited by the absence of Na"**, indicating the presence of a Na-Cl co-transporter
( Degan and Zadunaisky, 1980 ). The unidirectional sodium fluxes have been shown to be passive and to follow existing electrochemical gradients
( Degan and Zadunaisky, 1980 ).
In SW eels, where Na*** efflux was measured in parallel with gill Na***- K^-ATPase, the rate of efflux is closely correlated with the level of enzyme activity ( Forrest et aL, 1973 ). Ouabain administered in the circulation of SW- adapted American eels inhibited gill Na'*'-K**‘-ATPase with a corresponding reduction in both Na*** and Cl" efflux ( Silva et al, 1977 ). Active transport of chloride was also suggested by the ability of thiocyanate to inhibit chloride efflux and produce hypernatremia in SW-adapted eels ( Epstein et aL, 1973 ). The Cl" transport was inhibited in the killifish by the removal of Na+ ( Degan and Zadunaisky, 1980 ) and by the addition of bumetanide ( Foskett et aL, 1983 ), indicating the presence of a Na-Cl cotransporter. When the above results are considered in conduction with observations from studies using vibrating probes, they point to an active Cl" transport system coupled to Na***- K^-ATPase, with a neutral NaCl carrier that passively moves Na*** into the chloride cell. Na***-K^-ATPase will maintain low intracellular Na***, which would, therefore, provide the driving force for coupled Na-Cl transport into the cell. It has been proposed that Cl" leaves the cell via an apical electrogenic pump, while Na*** is recycled and eventually extruded by a paracellular
mechanism ( Foskett et aL, 1983; Karnaky, 1986 ). Figure 1.5 shows a model for salt secretion across the chloride cell in SW-adapted teleosts.
Figure 1.5
Figure 1.5 Route and mechanism of salt extrusion across SW fish gill
NaCl enters the chloride cell (1) down a concentration gradient maintained by basolateral Na'*'-K'*' exchange (2). The Na"*" is either recycled or enters the tubular system (3). From here the Na"** is extruded via a paracellular route (4). The CT is
ü
o
% 0 0
1.4 Teleost gut
In SW, teleosts drink large quantities of water in order to replace
osmotic water losses which occur primarily across the gills. Therefore, in SW the gut is an important route of water gain. In order for the ingested seawater to be taken up from the intestinal lumen, it must first undergo desalination, which is reported to occur in the oesophagus of SW-adapted teleosts ( Hirano and Mayer-Gostan, 1976; Parmelee and Renfro, 1983 ).
The oesophagus of FW-adapted teleosts is almost impermeable to both ions and water ( Kirsch et al .1975 ). The oesophagus of the FW-adapted eel, Anguilla japonica, is lined by a stratified epithelium consisting of three main cell types, numerous mucus cells occupying the middle area of the
epithelium, filament-rich cells forming the outermost and basal layers and ribosome-rich cells . The filament-rich cells, which possess many microridges arranged in a finger-like pattern, appear to serve as an effective barrier to the passive diffusion of ions and water through the FW-adapted eel oesophagus ( Yamamoto and Hirano, 1978 ).
With transfer of the eel to SW a progressive change in the
predominant cell type of the oesophagus occurs. The stratified FW-adapted epithelium is present at the beginning of the oesophagus, but is progressively replaced by a simple columnar epithelium relatively free from mucus cells, and highly vascularised beneath the mitochondrial-rich columnar cells. Important foldings increase the epithelial surface area ( Yamamoto and Hirano, 1978 ).
The oesophageal mucus plays an important role in the maintenance of mucosa-to-serosa net ion fluxes. The mucus forms a diffusion barrier and becomes more fibrous closer to the epithelial membrane ( Figure 1.6 ). Therefore, it is likely that physical resistance to longitudinal water flow
increases in the mucus layer from lumen to cell contact, and ions move down the concentration gradient towards the epithelium and are absorbed ( Kirsch
Figure 1.6
Figure 1.6 Model of water and ion distribution in the oesophageal mucus
f f i
mm
400d 520 mmot Cl: Lmucus
dense mucus
e so p h ag eal
et al, 1975; Hirano and Mayer-Gostan, 1976 ). If the thickness of the mucus layer decreases from the beginning to the end of the oesophagus, then SW could flow down the oesophagus through the mucus layer at different speeds and thus allow a progressive desalination to occur ( Kirsch et fl/,1983 ).
As already stated the oesophagus of the FW-adapted eel is almost impermeable to both Na+ and Cl” ions and to water ( Hirano and Mayer- Gostan, 1976 ). A distinctive characteristic of the SW-adapted teleost
oesophagus is its selective permeability to Na and Cl independent of water permeability. When the isolated oesophagus from the SW-adapted eel was filled with SW and incubated in Ringer solution, a large quantity of Na"*" and C r ions moved out of the lumen, with negligible water movement ( Hirano and Mayer-Gostan, 1976). The oesophageal osmoregulatory function of the sculpin was assessed by in vivo perfusion experiments ( Sleet and Weber, 1982 ) and in agreement with the in. vitro studies in the FW fish, the
oesophagus was impermeable to water and ions, and had very low serosa-to- mucosa net ion fluxes, which may be related to mucus secretions. In the SW fish as a result of changes in Na and Cl permeability there was a rapid
absorption down the electrochemical gradient between the lumen and serosa of approximately 50 - 70% of the ions ingested with SW.
The stomach has little role to play in osmoregulation, although, it was previously considered to play a part in the dilution of the lumen fluid as a result of gastric acid secretion ( Holstein, 1979a, b ). The stomach receives water that has already undergone partial desalination. In the isolated eel stomach ( Hirano and Mayer-Gostan, 1976 ) there was no movement of Na or water, whereas some secretion of Cl" ion coupled to H"*" ion secretion into the lumen occurred. No difference in this secretion was observed between the FW- and SW-adapted eel.
The intestine, which receives partially desalinated water, plays an active part in gut osmoregulation. Histological studies on the epithelial
lining structure of the SW-adapted goby, Gillichthys mirabilis, revealed numerous folds consisting of three cell types, absorptive cells, mucus cells and basal cells ( Loretz, 1983a ). The columnar cells which are rich in mitochondria appear to have greater conductance of chloride than sodium ions across the intestinal apical membrane of the goby. The number of mucosal cells in the intestine of the American eel increased with transfer from FW to SW and as a consequence the weight of intestinal mucus increased 32% during the adaptation ( MacKay and Janicki, 1979 ).
Isolated intestines from SW-adapted cultured Japanese eels showed active primary transport of sodium and passive water transport from mucosa to serosa, with the molar ratio of water to sodium lost from the intestinal sac greater than in FW-adapted eels ( Oide and Utida, 1967 ). Skadhauge ( 1969) and Hirano ( 1967 ) reported a similar augmentation in intestinal absorption of water and NaCl with transfer of the eel from FW to SW. Using phenol red as an indicator of water ingestion and intestinal absorption in the Japanese eel, Oide and Utida ( 1968 ) demonstrated that 60 - 75% of SW ingested is absorbed in the intestine. In the posterior intestine sodium and chloride are actively reabsorbed and CaCOg precipitates out of solution, thereby creating osmotically " free water ", which can be reabsorbed.
Na'^-K'^'-ATFase in the gut was seen to increase with transfer of the American eel from FW to SW ( Jampol and Epstein, 1970 ). The increased water uptake in the SW-adapted eel intestine was observed to be ouabain sensitive, indicating a link with Na+-K+-ATPase ( Huang and Chen, 1971 ). The SW eel intestine also possesses a Na+-K+-Cl cotransport system, a K"** leak system and a Cl” leak system ( Ando, 1992 ). During Na-K-Cl cotransport there is active transport of NaCl to the serosal side via Na'^'-K'^-ATPase and apical c r channels respectively while K+ is passively transported across the luminal membrane via a "K*^ leak system" ( Ando, 1981; Ando, 1985 ). This creates a local osmotic gradient for passive water reabsorpton. The flounder
intestine also appears to possess the Na'^-K^-CT cotransport system, which seems to be a characteristic feature of salt absorbing epithelia ( Musch et al, 1982 ). A coupling of Na+ transport with amino acid and sugar transport is also observed ( Collie and Hirano, 1987 ). Figure 1.7 shows the possible transport pathways in fish intestine.
1.5 Kidney and urinary bladder
Vertebrate kidneys function on the filtration-reabsorption principle, with the addition of tubular secretion. A few teleostean species are found to differ from this general pattern, in that they lack the ultrafiltration
mechanism and depend entirely upon a secretory-type of kidney.
All vertebrate kidneys consist of units, called nephrons, the number involved depending on species and size. The first section of the nephron is the Bowman's capsule where ultrafiltration of the blood plasma occurs. Each Bowman's capsule is fed by a small artery which divides into a tuft of
capillaries, the glomerulus. Together, the Bowman's capsule and glomerulus constitute a Malpighian or renal corpuscle. Fluid, termed the glomerular filtrate, is forced out through the walls of the glomerular capillaries into the tubule which leads from the Bowman's capsule. Within the tubule the fluid is modified, both by tubular reabsorption and secretion, to form the final urine. This tubule can be generally divided into two parts: the proximal tubule in which water and many solutes, e.g. salts and glucose are reabsorbed, and a distal tubule that continues the process of changing the tubular fluid into urine. The distal tubules join to form collecting ducts, and these empty the urine into the renal pelvis. From here, the urine passes through the ureters to the urinary bladder, from which, at intervals, it is discharged to the exterior ( Schmidt-Neilson, 1986 )
The mammalian nephron consists of proximal and distal segments separated by a characteristic thin loop-forming segment, known as Henle’s
Figure 1.7
Figure 1.7 Possible mechanisms of ion transport in the teleost intestine
Serosa Lumen 2+
■►Mg
► SO Na
► Cl Na
cAMP
loop. A similar structure, though not as well developed, is found in the bird kidney. This loop permits the formation of urine more concentrated than blood plasma. The loop is missing in almost all fish ( Rankin and Davenport,
1981 ), amphibians, and reptiles, which are unable to produce urine of a higher concentration than the blood plasma ( Schmidt-Neilson, 1986 ).
A key measurement of renal function is the glomerular filtration rate ( GFR ), which may be determined by the clearance of a marker moelcule, such as [^H] inulin, in the urine, after injection of the substance into the fish. Similarly the single nephron glomerular filtration rate ( SNGFR ) may be determined by micropuncture of an individual nephron.
The teleost kidney will now be discussed in greater detail.
1.5.1 Teleost kidney
The teleost kidney is usually divided into two portions, the head kidney and the caudal kidney. The head kidney generally consists of lymphoid, hematopoietic, interrenal, and chromaffin ( suprarenal ) tissue. The amount of hematopoetic and pigment cells distributed among the tubules and vascular spaces in the caudal kidney is variable. The corpuscles of Stannius are normally located on the dorsal surface from the middle to the posterior region of the kidney. Fusion of the two archinephric ducts may occur at the posterior end of the kidney or between the kidney and urinary papilla. Dilations of the archinephric duct may form a urinary bladder, where storage and modification of the urine occurs ( Hickman and Trump, 1969 ).
The teleostean kidney can be divided into five configurational classes as shown in Figure 1.8. depending on the degree of fusion between the two kidneys and the distinction between caudal and head kidney ( Hickman and Trump, 1969 ), (I) the sides of the two kidneys are totally fused with no clear distinction between body and head kidney, eg herrings; (II) only the anterior parts of the two kidneys are not fused, and there is a clear distinction between
Figure 1.8
Figure 1.8 Five configurational types of marine teleostean kidneys
II
m
N
Posi cordinol
Trunk kidney
Corpuscles of Stannius
/-'-wHeod ( S j kidney
caudal and head kidney, eg eels; (III) only the posterior parts are fused, with the anterior portion represented by two slender branches and there is a clear distinction between the caudal and head kidney, eg mullets and flounders; (IV) only the extreme posterior portion is fused and the head kidney is unrecognisable, eg pipefish and; (V) complete separation of the two kidneys, eg anglerfish.
There is a tendency for the kidney of the euryhaline fish to resemble that of stenohaline fish of the primary environment, e.g. the nephrons of the European and American eels are grouped with the typical FW teleosts
( Grafflin, 1937 ).
This section will primarily describe the morphological and functional adaptability of the teleost kidney with respect to the transfer of fish from FW to SW.
1.5.1a Morphology
The structure of a typical FW teleost nephron is a renal corpuscle, containing a well-vascularised glomerulus, linked by a ciliated neck segment to an initial proximal segment followed by a second proximal segment, both possessing a variable brush border, intermediate and distal segments and a collecting duct system. A typical marine teleost nephron consists of a glomerulus-containing renal corpuscle, a neck segment of variable length, two or three proximal segments, and a collecting tubule and collecting duct system. An intermediate segment is sometimes present between proximal segment 1 and 2 .
Using scanning electron microscopy ( SEM ) and transmission electron microscopy ( TEM ) the epithelial ultrastructure of the glomerulus of the FW- adapted rainbow trout, Onchorynchus mykiss ( = Salmo gairdneri, ) is seen to comply with the general vertebrate pattern ( Brown et ah, 1983 ). Large,
rounded podocytes with processes terminating in interdigitating pedicles and
few cytoplasmic microprojections, were present. Slit pores lay between the interdigitating pedicles. After transfer to SW for at least three weeks, the podocytes were considerably flattened and close together, and, when visible, the pedicles were usually broader with little visible interdigitation. There appeared to be a reduction in the number of pedicles and slit pores and an increase in the number of cytoplasmic microprojections.
The size of the glomerulus of the European eel, Anguilla anguilla^ decreased 10 days after transfer from FW to SW ( Olivereau and Olivereau, 1977 ). Modification of glomerular size after FW to SW ti'ansfer of the trout seemed to take longer to achieve, with little change in size of the glomeruli after nine weeks in SW compared to the FW-adapted trout, however, there was a 40% reduction in size after one year in SW ( Brown et al, 1983 ).
In the eel the brush borders of the proximal tubules became thinner after transfer to SW. The distal and collecting tubules of FW-adapted fish had a highly folded basal plasmalemma, which was less evident in SW
( Olivereau and Olivereau, 1977 ). Therefore, it is clear, that, morphological changes occur in the kidney of teleosts during adaptation from a hyposmotic to a hyperosmotic environment.
The kidneys of some teleosts are aglomerular and work on a secretory principle. The marine aglomerular nephron of the midshipman, Porichthys notatus, and the toadfish, Opsanus tau, consist of an initial segment with brush border and a terminal collecting duct system ( Bulger, 1965 ; Bulger and Trump, 1965 ).
1.5.1b Function
Utilising marker molecules, such as [^Hjmethoxy inulin and
[^^Cjpolyethylene glycol, originally designed for the measurement of GFRs in mammalian studies, SW-adapted fish are found to have lower GFR and urine flow compared to FW-adapted animals ( Brown et al., 1978 : Brown et
al., 1980 : Chester-Jones, et al., 1969; Sharratt et al, 1964 a,b ), There may be some instances where urine production rates are changed by regulation of tubular water reabsorption rather than by GFR ( Schmidt-Neilson and Renfro, 1975: Oide and Utida, 1968 ). The methods used for determining GFR may, however, result in an underestimation of the GFR as it appears the marker molecules can penetrate the bladder and possibly the ureters and renal tubules ( Beyenbach and Kirschner, 1976 ).
SNGFRs were higher in SW-adapted trout compared to FW-adapted trout ( Brown et al, 1978 ). Due to the inaccessibility of rainbow trout nephrons for micropuncture an indirect technique was used in this study. ^^C-ferrocyanide was infused into the animal as the renal clearance of this marker was found to be indicative of glomerular filtration. As previously mentioned, the GFR in the FW-adapted animal is higher than that in SW- adapted fish. Therefore, whilst SNGFR of SW animals are higher than those in FW, it may be that filtration is distributed to nephron populations selected to meet the homeostatic demands of the fish.
Three population types of nephron have been identified based on perfusion patterns; filtering ( F ), non-filtering but perfused ( NF ), and non perfused ( NP ) ( Henderson and Brown, 1980; Brown et al, 1980 ). The
proportion of each type of nephron in FW-adapted and SW-adapted rainbow trout ( Brown et al, 1980 ) was as follows:
F =FW 45% - SW 5% NF = FW 42% - SW 44% NP = FW 1 2% - SW 50%
The higher SNGFRs in the filtering glomeruli of SW trout ( Brown et al,
1978 ) may result from blood flow being directed towards certain populations of nephrons.
The renal tubular transport maxima for glucose (TMG), i.e. the glucose reabsorptive capacity, decreased with transfer from FW to SW ( Hickman,
1968 ). The TMG in SW-adapted teleosts was about one tenth that of FW kidneys and the renal blood flow approximately half ( Jackson et al, 1977 ). This decrease in TMG was considered to reflect a reduction in the number of filtering nephrons observed after SW transfer.
Both proximal tubules participate in the reabsorption of Na’*’ and Cl” with a simultaneous secretion of divalent ions ( Mg^+, SO^^"^ ) occurring. Reabsorption of Na’*’ and Cl" was reduced in SW ( Olivereau and Olivereau, 1977 ). A NaCl-linked fluid secretion in proximal tubules has been reported in a diverse group of marine fish, the dogfish shark, the winter flounder and the SW-adapted euryhaline killifish ( Beyenbach, 1986; Beyenbach, 1982 ) and also in the FW-adapted killifish, albeit in a low number of tubules ( Cliff and Beyenbach, 1988 ). Tubular secretion is used by aglomerular fish, such as the marine toadfish, Opsanus tau, to produce urine. In the winter flounder, it was reported that fluid secretion in the proximal tubules was driven by both MgCl2 and NaCl, with NaCl secretion quantitatively more important and
providing the basal fluid secretion rate ( Beyenbach et al, 1986; Cliff et al,, 1986a ). The fluid-secreting proximal tubule has a leaky epithelia, which apparently arises from the paracellular pathway, which is permeable to both N a’*' and Cl", with slightly more permaselectivity to Na’*’ ( Beyenbach et al, 1986 ). Cyclic adenosine monophosphate ( cAMP ) stimulated fluid and Na and Cl secretion. In the FW fish this secretion of fluid and solutes may initially appear surprising, however, this may form an additional renal mechanism for the production of a dilute urine ( Cliff and Beyenbach, 1988 ). Figure 1.9 shows the possible transport pathways for the secretion of Na"*" and Cl" in the shark renal tubule modified from Beyenbach ( 1986 ), which is postulated to be similar for the SW-adapted teleost.
In the kidney of FW teleosts Na^-K’*’-ATPase is present for the
conservation of sodium and the enzyme activity was reported to be higher for marine teleosts compared to FW-adapted fish ( Jampol and Epstein, 1970 ),
Figure 1.9
Figure 1.9 Postulated mechanisms of NaCl secretion in SW teleost proximal tubule as modified from
mechanism of NaCl secretion in shark renal proximal tubule ( Beyenbach, 1986 ).
Serosa Lumen
2+
Mg
c r
so
Na
► Cl
Na
cAMP
however, activity was seen to increase with the transfer of Platichthys stellatus from SW to FW ( Utida et al, 1974 ).
1.5.2 Teleost urinary bladder
The urinary bladder of terrestrial vertebrates is derived from the rectum, but that of fishes is of the same embryological origin as the kidney. The urinary bladder modifies urine and has a role to play in teleost
osmoregulation.
The urinary bladder of fishes is a thin walled sac, and is the result of the fusion and dilation of the two archinephric ducts of the kidney ( Hickman and Trump, 1969 ). Three layers are distinguishable in the teleost bladder: (a) an inner layer lined by one or two regionally segmented cell types,
mitochondrial-rich columnar cells and cuboidal cells; (b) a thin middle layer consisting of connective tissue called the tunica propria, and containing some smooth muscle fibers; (c) a thin outer layer composed of connective tissue.
The inner layer of the urinary bladder of the euryhaline goby, Gillichthys mirabilis, is lined with both columnar and cuboidal cells, maintained in distinct regions ( Loretz and Bern, 1980 ). In 5 % SW- acclimated fish and full SW-adapted fish active reabsorption of Na and Cl from the lumen occurs across the columnar cell region via a neutral cotransport mechanism. In full SW-adapted goby bladders there is also present in addition an electrogenic Na reabsorption component. Cuboidal cell regions from both 5%- and full SW-acclimated fish produced little mucosal to serosal NaCl transport ( Loretz and Bern, 1980 ).
Generally, urinary bladders from SW-adapted fish have higher water absorption and osmotic permeability and lower or equal NaCl absorption rates, compared to those in FW ( Hirano et al, 1973; Johnson et al, 1972; Doneen, 1976; Utida et al, 1974 ). Marine fish appear to have a more variable rate of water movement and osmotic permeability, which may be related to
the degree of development of the bladder and the efficiency of the kidney tubular function ( Hirano et al, 1973 ). Bladders of stenohaline FW fish, such as the carp ( Cyprinus carpio ), Japanese catfish ( Parasilurus asotus ) and white catfish ( Ictalurus catus ), are relatively impermeable to water ( Hirano et ah, 1973 ), This impermeability may be necessary to prevent osmotic water inflow from the dilute urine.
FW-adapted Gillichthys mirabilis had lower water transport and
osmotic permeability compared to SW-adapted fish ( Doneen, 1976 ) and three species of euryhaline flounder ( Paralichthys olivaceus, Platichthys stellatus and Kareius bicoloratus ) demonstrated a reduced osmotic permeability to water and increased permeability to sodium and chloride ions on adaptation to hypotonic media ( Hirano et al, 1973 ).
It seems that the origin of the euryhaline fish may have some effect on the ability of the urinary bladder to modify its permeability when adapting to an osmotically different environment. Bladders of euryhaline fish of FW origin, such as trout and Tilapia, appear relatively impermeable to water irrespective of environmental salinity, while those of SW origin, such as the flounders and Gillichthys, may change from permeable in SW to relatively inpermeable in FW ( Hirano et ah, 1973 ).
The urinary bladder actively takes up Na'^ and CF ( Loretz and Bern, 1980 ) with the apparent involvement of a ouabain sensitive, CT-Na'^’-K'*' cotransport system ( Renfro, 1975 ). Na"^-K^-ATPase is present in the urinary bladder. FW-adapted fish were found to have a higher activity compared to SW fish ( Fossat et ah, 1974 ) which may be indicative of active Na+ and Cl" absorption from the urine.
1.6 Hormones
The effectiveness of any biological homeostatic mechanism depends upon a constant supply of information concerning the state of a particular controlled variable. This information may be conveyed by the nervous or endocrine systems. These systems are intimately involved in the overall regulation of homeostasis. In addition, the nervous system is itself affected by hormones and, conversely, endocrine glands are partly dependent on
nervous control ( Baulieu, 1990 ).
Classically endocrine glands are ductless organs or tissues, located throughout the body, which secrete a variety of chemically distinct hormones. A hormone may be defined as a signal molecule secreted into the internal milieu, most frequently, into the blood perfusing the gland. The internal milieu is considered to be the extracellular fluid which bathes all the tissues and provides the medium for communication and exchange between the cells and external environment. The blood delivers hormones to target cells, where they exert their physiological effect. The receptor is the chemical structure required by the target cell to recognise and receive the hormone ( Baulieu, 1990 ).
In addition to their transport throughout the body to target cells, by the vascular system, some hormones act locally, influencing the activity of
neighbouring cells, a phenomenon defined as a paracrine effect. Examples include neurotransmitters, neurohormones, chemical agents of the immune system such as interferons and interleukins, and nitrous oxide, the
endothelium-derived relaxation factor ( Ànggârd, 1990 ). If the cell itself utilises the hormone it produces ( and naturally also provides the hormone to identical neighbouring cells ) the hormone is termed autocrine. Cultured cells often respond to growth factors they secrete and many tumour cells over-produce and release growth factors that stimulate inappropriate and unregulated growth of the tumour itself.
Hormones can be broadly classified on the basis of their chemical nature, as lipophilic or hydrophilic hormones, the former being
predominantly soluble in lipid and the latter predominantly soluble in water. Lipophilic hormones include the steroid and thyroid hormones, whereas hydrophilic hormones include large polypeptides such as insulin, small peptides such as angiotensin II ( All ) and small charged molecules such as adrenaline.
In general, vertebrate endocrine glands show anatomical and
embryological homologies, but there may be considerable diversity in their morphological arrangements, secretions and apparent physiological roles. Some endocrine glands, such as the adrenomedullary homologue, are ubiquitous among vertebrates, secreting chemically similar hormones with comparable actions. Other endocrine glands are not universally present. The parathyroid glands are observed only in tetrapods, and the caudal
neurosecretory system appears to be present only in teleosts and elasmobranchs while cyclostomes lack ultimobranchial bodies. Some endocrine glands, the adenohypophysis for example, although ubiquitous among vertebrates, may produce individual hormones which have different functions in various groups.
The differences in physiological function and sites of action observed with some hormones are often associated with a change in the chemical structure of the hormone. There is considerable species variation in the amino acid substitution in pituitary peptide hormones, prolactin for example ( Section 1.8.2a ). Similarly, the neurohypophysial hormones ( Section 1.8.4 ) and angiotensins ( Section 1.10.1 ) vary in amino acid substitutions from group to group.