1
1.
TITLE: EMBRYO CELL ALLOCATION PATTERNS ARE NOT
1
ALTERED BY BIOPSY BUT CAN BE LINKED WITH FURTHER
2DEVELOPMENT
3Running title:
Cell allocation and further embryo development 4Authors
5L P Sepulveda-Rincona, N Islama, P Marstersa, B K Campbella, N Beaujeanb, W E Maaloufa* 6
a
University of Nottingham, Division of Child Health, Obstetrics and Gynaecology, School of 7
Medicine, Nottingham, NG7 2UH, England 8
b
INSERM U1208, INRA USC1361, Stem Cell and Brain Research Institute, Department of 9
Pluripotent Stem Cells in Mammals, 69675 Bron, France 10
*Correspondence address: 11
Dr Walid E Maalouf 12
Tel: +44 115 82 30699 13
Fax: +44 115 82 30704 14
Email: [email protected] 15
2
2.
ABSTRACT
16
It has been suggested that first embryo cleavage can be related with the 17
embryonic-abembryonic axis at blastocyst stage in mice. Thus, cells of the 2-cell embryo 18
might be already biased to form the inner cell mass or trophectoderm. This study was 19
conducted to observe the possible effects of embryo biopsy on cell allocation patterns during 20
embryo preimplantation in two different mouse strains and the effects of these patterns on 21
further development. First, one blastomere of the 2-cell embryo was injected with a lipophilic 22
tracer and cell allocation patterns were observed at blastocyst stage. Blastocysts were 23
classified into orthogonal, deviant or random pattern. For the first experiment, embryos were 24
biopsied at 8-cell stage and total cell counts (TCC) were annotated. Furthermore, 25
non-biopsied blastocysts were transferred into foster mothers. Then, pups and their organs 26
were weighed two weeks after birth. Random pattern was significantly recurrent (≈60%), 27
against orthogonal (<22%) and deviant (<22%) patterns among groups. These patterns were 28
not affected by biopsy procedure. However, TCC on deviant embryos were reduced after 29
biopsy. Moreover, no differences were found between patterns for implantation rates, litter 30
size, live offspring and organ weights (lungs, liver, pancreas and spleen). However, deviant 31
pups presented heavier hearts and orthogonal pups presented lighter kidneys among the 32
group. In conclusion, these results suggest that single blastomere removal does not disturb 33
cell allocation patterns during pre-implantation. Nonetheless, the results suggest that embryos 34
following different cell allocation patterns present different coping mechanisms against in
35
3
KEY WORDS
37
Embryo biopsy, pre-patterning, PGD/PGS, organ development, embryo transfer, 38
implantation. 39
3.
INTRODUCTION
40
Assisted reproductive technologies (ARTs) have been clinically used for more than three 41
decades and the success rates still remain relatively low, with a probability to take home a 42
baby after an IVF cycle of around 33 % in women younger than 35 years old (Botros et al.
43
2008) and no more than 23 % for women of older age groups (HFEA 2013). Several factors 44
have been related with pregnancy outcomes after ARTs as gametes/embryos origin and state 45
(autologous or donation and fresh or thawed), female stimulation treatment, patient age, 46
number of previous treatments and day of embryo transfer (D3 or D5) to mention the most 47
common ones (Meseguer et al. 2012). Nevertheless, embryo implantation failure remains the 48
main cause of the low success rates on ARTs (Hesters et al. 2008). Most of embryo 49
implantation failures or pregnancy arrests are caused by embryo chromosomal or genetic 50
abnormalities (Simpson 2012), therefore pre-implantation genetic screening (PGS) or 51
diagnosis (PGD) before embryo transfer is suggested for those cases. The main objectives of 52
PGD are to improve birth rates in those patients presenting any kind of genetic disease or 53
disorder, and to reduce spontaneous abortions (Munné et al. 2010). Embryo pre-implantation 54
genetic diagnosis/screening (PGD/S) is becoming increasingly applied in fertility clinics. 55
Even though trophectoderm biopsy is currently becoming the preferred method, blastomere 56
biopsy on day 3 remains the most common technique for obtaining the biological material 57
according to the latest ESHRE (European Society for Human Reproduction and Embryology) 58
4 after a PGD/S cycle (Peyvandi et al. 2011). Therefore, further research on the potential effect 60
and safety of embryo biopsy on embryo development is needed. 61
Until recent years it was believed that during the first round of cleavage, the cells in the 62
mammalian embryo were identical and had the same potential to become ICM or TE. 63
However, the literature reports a theory called the pre-patterning or biased theory, which 64
refers to the different potential of the twin blastomeres at the two-cell stage embryo to 65
become ICM or TE (Piotrowska et al. 2001, Piotrowska & Zernicka-Goetz 2002, Fujimori et
66
al. 2003, Gardner 2007, Torres-Padilla et al. 2007, Bischoff et al. 2008, Katayama & Roberts 67
2010, Liu et al. 2012). Nevertheles, this theory has been debated suggesting that totipotency 68
within the embryo blastomeres is maintained up to the 8-cell stage (Alarcón & Marikawa 69
2003, Motosugi et al. 2005, Waksmundzka et al. 2006, Kurotaki et al. 2007, Alarcón & 70
Marikawa 2008, González et al. 2011, Wennekamp et al. 2013). It is still unclear if 71
mammalian embryos are pre-patterned or the presence of stochastic development is just a 72
reflex of the great plasticity of mammalian embryos. Research performed on cell allocation 73
patterns suggest that it might be a common characteristic during pre-implantation embryo 74
development of different mammalian species (Park et al. 2009, Hosseini et al. 2016, 75
Sepulveda-Rincon et al. 2016). However, there is a lack of evidence on the mechanism(s) 76
leading to these cell allocation patterns. In this work, the murine model is used to investigate 77
the cell allocation pattern incidence among two different mouse strains and the effects of 78
embryo blastomere removal at the cleavage stage on these patterns. Additionally, we 79
investigated the effect of cell allocation patterns on further embryo development and organ 80
5
4.
MATERIALS AND METHODS
82
All experiments were performed according to the Animals Scientific Procedures Act, 1986 83
under the Home Office licence 40/3480 and with the approval of the Bio Support Unit at the 84
University of Nottingham. Two different experiments were performed during the present 85
study. First, the effects of single blastomere removal at the 8-cell stage on cell allocation 86
patterns were studied using two different mouse strains. Second, the effects of cell allocation 87
patterns on further embryo development were addressed. 88
Mouse embryo production
89
For biopsy experiments B6CBAF1 x B6CBAF1 fresh embryos and B6C3F1 x B6D2F1 90
frozen/thawed embryos were used. First, 5 to 7 weeks old B6CBAF1 females (Charles River, 91
UK) were superovulated with one peritoneal injection of 5 IU pregnant mare serum 92
gonadotropin (PMSG, Intervet, Buckinghamshire, UK) followed by one peritoneal injection 93
of 5 IU human chorionic gonadotropin (hCG, Intervet, Buckinghamshire, UK) after 48 hours. 94
After hCG injection, females were placed with males of the same strain and vaginal plugs 95
were checked the following morning. Females were sacrificed by cervical dislocation and 96
embryos were collected at one-cell stage at 22 to 24 h post hCG. Embryos were collected in 97
EmbryoMax Hepes medium (Merck Millipore), previously equilibrated at 37°C. In order to 98
compare the obtained results a different mouse strain was used, B6C3F1 x B6D2F1. One cell 99
frozen B6C3F1 x B6D2F1 mouse embryos (Embryotech Laboratories, Inc., Massachusetts, 100
USA) were thawed in EmbryoMax Hepes medium (Merck Millipore) according to supplier’s 101
instructions. After embryo thawing, embryos were cultured in KSOM medium (Merck 102
Millipore) under mineral oil (Merck Millipore) at 37°C and 5% CO2. For the second part of 103
the study, the embryo transfer experiment, only frozen/thawed B6C3F1 x B6D2F1 embryos 104
6
Non-invasive Cell tracing method
106
As previously reported (Sepulveda-Rincon et al. 2016), the lipophilic tracer CM-DiI 107
(Chloromethyl DiI, Molecular probes) was dissolved in olive oil at a final concentration of 108
2 mg/ml. Prior to labelling, the FemtoTip II (Eppendorf, Germany) was backfilled with the 109
dye. Mouse embryos at 2-cell stage were placed in HEPES buffered medium at 37°C during 110
the micromanipulation. The injections were performed on an inverted microscope (Leica 111
DMI3000 B, Germany) using Eppendorf TransferMan NK 2 micromanipulators with a 112
coupled Eppendorf FemtoJet microinjector. The micropipette was pushed through the zona 113
pellucida and pressed against one of the blastomere membranes, and then a microdrop 114
(≈ 5 pl) was deposited. 115
Cleavage stage embryo biopsy
116
Mouse embryos were assessed at 672 h post-hCG or 43-45 h post-thawing. Then, 6- to 8-117
cell embryos were randomised for biopsy. The selected embryos were transferred to a pre-118
warmed 60 mm ICSI dish (BD Falcon) containing 10 µl drops of G-PGD medium (Vitrolife) 119
under mineral oil (Merck Millipore). Briefly, embryo biopsy was performed using a 120
40x XYclone laser objective (Hamilton Thorne Biosciences, MA, USA) mounted on a Leica 121
DMI3000 B inverted microscope. A single blastomere was randomly removed and the 122
resulting biopsied embryos were further cultured in culture medium until the blastocyst stage 123
under culture conditions. For morphokinetic analysis embryos were cultured in a time lapse 124
7
Blastocyst assessment
126
Cell allocation patterns
127
Blastocysts were scored for the different pattern categories as described previously 128
(Sepulveda-Rincon et al. 2016). Briefly, blastocysts were placed in 5 µl EmbryoMax Hepes 129
(Merck Millipore) medium drops on 60 mm petri dish and on a Leica DMI3000 B inverted 130
microscope, coupled with red fluorescent filters corresponding to maximum 131
excitation/emission wavelengths of 553 nm and 570 nm respectively. For better visualisation, 132
embryos were rotated in order to place the blastocoel cavity floor and the boundary line 133
between the fluorescent and non-fluorescent cells in the same focal plane. Then, embryos 134
were classified into three categories: orthogonal, if the Em-Ab axis was orthogonal ± 30° to 135
the boundary line between stained and non-stained cells; deviant, if it was ± 30° to the Em-136
Ab axis and random, if stained cells were intermingled with non-stained cells and more than 137
2 clusters of cells were observed. 138
Blastocyst total cell count
139
Blastocysts were permeabilised in 0.1% Triton-100X/PBS during two minutes at room 140
temperature and then rinsed twice in phosphate buffered saline (PBS). Finally, embryos were 141
mounted on a SuperFrost microscope slide using Vectashield-DAPI as mounting medium and 142
nuclear staining. Total cell count was effectuated on a Nikon Eclipse Ti 90x microscope, 143
along with a Hamamatsu digital camera (C4742-80-12AG) and a fluorescent filter 144
corresponding to the excitation 350 nm and 470 nm of emission for DAPI. 145
Blastocyst expansion grading
146
Blastocysts for embryo transfer were graded according to their blastocoel expansion 147
according to the Gardner and Schoolcraft grading system. Blastocysts which the blastocoel 148
8 4 blastocysts were those which the blastocoel cavity fully fills the embryo and this was bigger 150
than the original volume and zona pellucida thinning was observed; Grade 5 blastocysts 151
which some cells are herniating through the zona pellucida. 152
Non-surgical embryo transfer
153
Nine to eleven weeks old CD1 female mice were placed with > 10 weeks old vasectomised 154
CD1 males. Then, 2.5 days post coitus (dpc) pseudo-pregnant females were used as 155
surrogates for embryo transfer. The protocol suggested on the non-surgical embryo transfer 156
(NSET) device (ParaTechs, USA) was followed. Briefly, after cell allocation pattern 157
classification, embryos were transferred by groups to 15 µl drops of KSOM previously 158
equilibrated at 37°C. Then, 13 to 18 blastocysts were loaded into the NSET device and it was 159
inserted into the mouse cervix where embryos were released. After embryo transfer, foster 160
females were caged individually and pregnancy was visually assessed on day 14 after embryo 161
transfer. 162
Offspring assessment
163
Pups were weighed and sexed at 1 week after birth. Furthermore, pups were culled 2 weeks 164
after birth by cervical dislocation, weighed and dissected. Different organs (spleen, pancreas, 165
kidneys, liver, lungs and heart) were carefully dissected and weighed immediately after 166
harvesting. Relative organ weights were calculated dividing organ weight by total body 167
weight. Foster mothers were also sacrificed by cervical dislocation. Then, uteri were 168
harvested and implantation sites were noted. 169
Statistical analysis
170
Data distribution was checked for normality by Shapiro-Wilk test and using SPSS v23 (IBM 171
9 mean. For values reporting cell allocation pattern incidence, SEM was calculated based on 173
number of repetitions of the experiment. Whereas, for values reporting TCC, SEM was 174
calculated based on total number of embryos analysed. Statistical significance was set at 175
p < 0.05 for all analyses. Blastocysts incidence rates within the different cell allocation 176
patterns were compared using ANOVA test for single or two factor as needed. Post Hoc 177
Bonferroni test was used when adequate. Non parametric test, Kruskal Wallis, was used to 178
determine any differences among groups for pregnancy, pregnancy loss, mean live birth, live 179
offspring rates as well as litter size comparison. Also, non-parametric test Kruskal Wallis was 180
used to determine any differences on relative organ weights among groups; when adequate 181
Mann Whitney U test was used to compare groups against each other. 182
5.
RESULTS
183
Cleavage stage embryo biopsy does not disturb cell allocation
184
patterns
185
A total of 287 B6CBAF1 x B6CBAF1 blastocysts in the control group and 214 blastocysts in 186
the biopsied group were successfully classified according to their cell allocation pattern as 187
previously reported on (Sepulveda-Rincon et al. 2016) (Figure 1). Orthogonal embryos 188
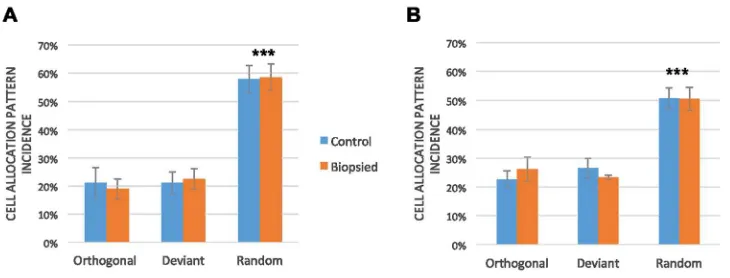
represented 21 ± 5.4% and 19% ± 3.6 of the blastocysts within the control and the biopsied 189
group respectively. The deviant group represented 21 ± 3.9% and 23 ± 3.6% and the random 190
group 58 ± 4.8% and 59 ± 4.6% for the control and biopsied group respectively (Figure 2a). 191
Univariate two way ANOVA showed no significant differences between treatment: control 192
and biopsied groups (p = 0.973). However, there is a significant difference on the incidence 193
of the cell allocation patterns (p < 0.001). Post Hoc Bonferroni test revealed that this 194
10 compared with the orthogonal (p < 0.001) and deviant (p < 0.001). Morphokinetic analysis 196
after blastomere removal (Supplementary Table 1) revealed that there are no differences 197
between patterns among the control group (p < 0.05); however there is not the case among 198
the biopsied group (p = 0.012). Orthogonal embryos spend longer time on the interval from 199
8-cell stage to 9-cell stage (p = 0.011) when compared with deviant embryos. Also, 200
orthogonal embryos spend longer time between compaction and the start of cavitation when 201
compared with deviant (p = 0.003) and random embryos (p = 0.012). 202
In order to address if the biopsy procedure has an effect on the size of the embryo at 203
blastocysts stage, total cell counts (TCC) of blastocysts were calculated. Embryos from the 204
orthogonal group presented a TCC of 45.8 ± 0.2 cells and 41.2 ± 0.5 cells within the control 205
and biopsied group respectively. Deviant embryos presented a TCC of 50.4 ± 0.6 and 206
42.0 ± 0.4 for control and biopsied group; while random embryos presented a TCC of 207
47.9 ± 0.2 and 43.5 ± 0.2. Univariate test showed no significant difference on the TCC 208
among the three patterns (p = 0.490). Still, there was a significant difference on the TCC 209
between the control and the non-biopsied groups (p = 0.002). Post Hoc Bonferroni test 210
suggested that this difference is mainly attributed to the effect of biopsy on the TCC of the 211
deviant group (p = 0.028). 212
Similar results were obtained when repeating the above experiment on B6C3F1 x B6D2F1 213
frozen/thawed embryos. A total of 69 blastocysts in the control group and 82 blastocysts in 214
the biopsied group were classified where 23 ± 2.9% and 26 ± 4.2% were orthogonal in the 215
control and biopsied groups respectively, 26 ± 3.4% and 23 ± 0.7% were deviant, and 216
51 ± 3.5% and 50 ± 3.9% were random (Figure 2b). No significant differences were found on 217
the incidence of the different cell allocation patterns between treatment groups (p > 0.05). 218
11 orthogonal and deviant embryos in both treatment groups. Morphokinetic analysis did not 220
show any difference among cell allocation patterns in control and biopsied groups (p < 0.05) 221
and even though a tendency of orthogonal embryos spending longer time between the 8-cell 222
stage to the 9-cell stage, significance was not reached (p = 0.056, Supplementary Table 1). 223
TCC at blastocyst stage were similar among cell allocation patterns in the control group 224
(p = 0.683) or the biopsied group (p = 0.932). Again, significant difference was found on the 225
TCC between control and biopsied group (p = 0.002) and it was attributed to the decreased of 226
TCC of deviant embryos after biopsy (p = 0.030). Orthogonal embryos presented 49.8 ± 2.8 227
cells and 45.5 ± 1.4 cells for control and biopsied groups respectively, deviant embryos 228
presented 52.1 ± 2.6 cells and 45.6 ± 1.5 cells and random embryos presented 50.0 ± 1.9 cells 229
and 46.3 ± 1.2 cells respectively. 230
Body weight and organ development might be affected by cell allocation
231
patterns during preimplantation embryo development
232
As cell allocation patterns were not disturbed by cleavage stage embryo biopsy, further 233
analysis on the effect of these patterns without the biopsy procedure was investigated. During 234
three repetitions of the experiment, a total of 323 blastocysts were successfully classified into 235
orthogonal, deviant or random accordingly to their cell allocation pattern with an incidence of 236
27.0 ± 4.7%, 28.3 ± 5.2% and 52.3 ± 7.2% respectively. 237
In order to observe if there was the same distribution on blastocysts size within groups, 238
blastocyst expansion grades were noted. Expansion grades were similar between orthogonal 239
(n = 83), deviant (n = 85) and random (n = 157) groups (p = 0.717 for grade ≤ 3, p = 0.917 240
for grade 4 and p = 0.734 for grade 5 among groups by ANOVA test). The majority of the 241
blastocysts were graded as grade 4; 57.8% for orthogonal, 60% for deviant and 57.3% for 242
12 groups; 21.7% and 20.5% for orthogonal, 23.5% and 16.5% for deviant, 24.9% and 17.8% for 244
random groups respectively. 245
Seventeen 2.5 dpc pseudo-pregnant females were used to transfer a total of 275 blastocysts. 246
Due to the higher incidence of embryos classified as random, more foster mothers were used 247
in this group. Nevertheless, the transferred blastocyst number within the three repetitions of 248
the experiment remained constant within the three groups (18, 13 and 16 blastocysts per 249
female for the first, second and third repetition respectively). No significant differences were 250
found between groups for pregnancy rates, implantation rates, pregnancy loss rate, litter size 251
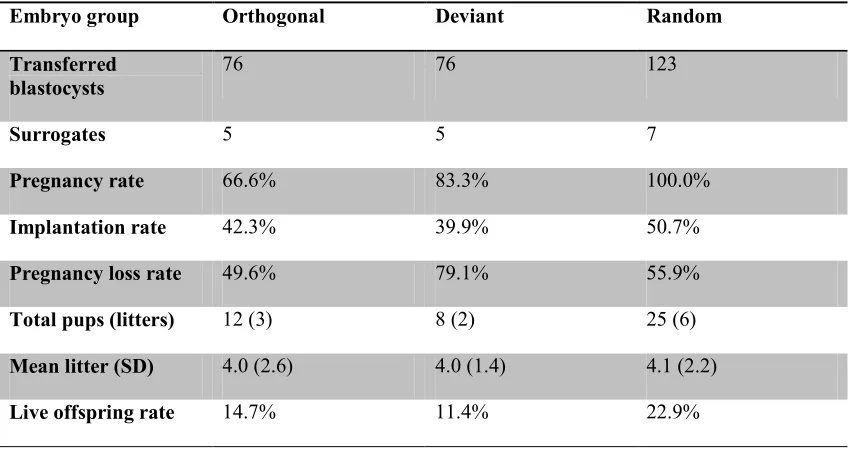
or live offspring rates (Table 1) (p >0.05 by Kruskal Wallis test). 252
Significant difference was found (p = 0.028) among groups when 7 days old pups weights 253
were compared. Mann Whitney U test revealed that pups from deviant group were 254
significantly lighter (5.60 ± 0.3 g) when compared with pups from random group (p = 0.015, 255
6.55 ± 0.1 g), but not when compared to orthogonal group (p = 0.230, 6.28 ± 0.3 g). Fourteen 256
days old pups weights did not vary between groups where orthogonal, deviant and random 257
pups weighed 11.10 ± 0.4 g, 9.77 ± 0.4 g and 10.8 ± 0.2 g respectively. It is worth noting that 258
within the deviant group male pups (n = 5) were significantly heavier than female ones 259
(n = 3, p < 0.05, Mann Whitney U test) during the first and second week measurements 260
(6.2 ± 0.2 g, 10.4 ± 0.3 g and 4.6 ± 0.1 g, 8.56 ± 0.2 g respectively). 261
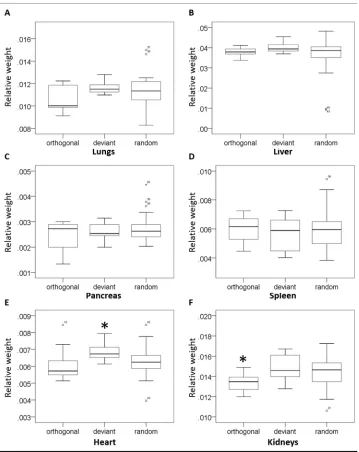
Relative organ weights from 2 week old mice showed no significant differences (p > 0.05) 262
among groups for lungs, liver, pancreas and spleen (Figure 3). However, a significant 263
difference was found between groups (p < 0.05) for heart and kidneys relative weights 264
(Figure 3). Pups within the deviant group presented significantly heavier relative heart weight 265
when compared with orthogonal (p = 0.025) and random (p = 0.036) groups. The pups from 266
13 deviant (p = 0.043) and random (p = 0.025) groups. Mann Whitney U test was applied to 268
determine if gender has an effect on relative organ weights within each group. The results 269
showed no significant difference between genders within the three different groups 270
(p > 0.05). 271
6.
DISCUSSION
272
In the present study different cell allocation patterns during preimplantation development 273
were not disturbed by single blastomere removal at 8-cell stage. These patterns might trigger 274
different compensatory mechanism(s) against in vitro embryo manipulation and this may 275
result in short and long term consequences for foetus or offspring born after embryo transfer; 276
particularly in deviant embryos. This study raises some questions about the cardiovascular 277
system and kidneys development during foetal development and how this might be affected 278
or predisposed since early preimplantation embryo stages. 279
Pre-patterning in mouse embryos has been previously reported (Gardner 1997, Piotrowska et
280
al. 2001, Piotrowska & Zernicka-Goetz 2002, Fujimori et al. 2003, Piotrowska-Nitsche & 281
Zernicka-Goetz 2005, Plusa et al. 2005, Zernicka-Goetz 2005). In the present study, we 282
confirm the presence and a comparable distribution of the three different cell allocation 283
patterns in mouse blastocysts irrespective of mouse strain or embryo cryopreservation at 1-284
cell stage. These resuls are also in agreement with those previously reported in mouse, bovine 285
and ovine embryos (Hosseini et al. 2016, Sepulveda-Rincon et al. 2016). Embryo biopsy at 286
the 8-cell stage, whether the biopsied cell is stained or not stained (data not shown), does not 287
seem to alter the cell allocation patterns in mouse embryos similar to what we have 288
previously reported in bovine embryos (Sepulveda-Rincon et al. 2016). Assuming that 289
14 in bovine embryos, then these results suggest that cell allocation patterns might be established 291
earlier in development than the 8-cell stage in mammalian embryos. Even though, cell 292
allocation patterns were unaffected by the biopsy procedure, TCC at blastocyst stage were 293
significantly affected in deviant embryos among two different mouse strains and also as 294
previously reported in bovine embryos (Sepulveda-Rincon et al. 2016). Hence, cell allocation 295
patterns could be related with different compensatory mechanisms after cell removal. With 296
still an increasing proportion of PGS and PGD procedures and more than ten thousand babies 297
born after embryo biopsy procedures (Peyvandi et al. 2011), further understanding of the 298
effects of early embryo micromanipulation and follow up assessment is needed in order to 299
establish the safety of ARTs in short and long term of development. Therefore, we 300
investigated the effect of cell allocation patterns and its possible impact on further 301
development. 302
Pregnancy rates in the present study were comparable between groups and in agreement with 303
previously reported studies using NSET device obtaining pregnancy rates higher than 60% 304
(Cui et al. 2014). However, there was no statistical difference between groups. It is worth 305
noting that all surrogate females with transferred random blastocysts became pregnant. A 306
possible theory is that random embryos might produce more hyaluronan promoting cell 307
movements, which is released to the endometrium and cell migration and implantation might 308
be facilitated (Gardner 2015). Also, in the present study, two of the females carrying deviant 309
embryos, presumably committed cannibalism due to problems at delivery or poor offspring 310
health (Wuensch 1993). 311
Similarly, embryo implantation rates were comparable between the three groups (around 312
40%) and are similar to those reported after surgical embryo transfer in mice (Hemkemeyer et
313
15 to their cell allocation pattern: orthogonal and deviant. The results obtained in the present 315
study are similar reporting no significant differences between groups regarding implantation 316
rates (Alarcón & Marikawa 2003, Liu et al. 2012). Nevertheless, our results differ from those 317
in cloned mouse embryos where orthogonal embryos presented higher implantation rates in 318
comparison with deviant ones (Liu et al. 2012). Molecular pathways occurring during 319
implantation and crosstalk between embryo and uterus are not clearly understood (Wang & 320
Dey 2006, Cha et al. 2012). It is believed that some embryos do not survive embryo transfer 321
procedure due to microenvironment changes and their inability to adapt (Hemkemeyer et al.
322
2014). Moreover, further research is needed in order to determine at which stage the 323
implanted embryos were lost. Pregnancy loss rates in the present study were > 50% among 324
groups. Pregnancy loss might be due to aberrant decidualisation; giving rise to placental 325
defects (Chen et al. 2015) and therefore affecting foetal growth (Cha et al. 2012). 326
Total body weights at 7 days after birth were different among groups, where the pups from 327
the deviant group presented the lowest weight. While some studies have reported low birth 328
weight after ART when compared with natural conceived babies (Ceelen et al. 2009, Bay et
329
al. 2014), others have reported only a tendency (Pontesilli et al. 2015). In mice, low birth 330
weight has been linked to metabolic syndromes as type 2 diabetes, obesity and hypertension 331
in adults (Chen et al. 2015). Fourteen days after birth, pups among the three groups presented 332
similar total body weights. In humans, it has been reported that babies born with low weight 333
“catch up” within the first 6 months of life (Ceelen et al. 2009, Bay et al. 2014). Moreover, 334
no differences were found between male and female pups for orthogonal and random groups, 335
only for deviant group. Gender differences have been reported for birth weights in babies 336
after unassisted and assisted conception (O'Neill et al. 2014). Further investigations on the 337
long term health between females and males must be addressed as it has been suggested that 338
16 ART (Donjacour et al. 2014). In turn, glucose intolerance can develop into cardiovascular 340
diseases which might affect males or females in a different way (Vlasov & Volkov 2004). 341
Organ morphometry assessment revealed significant differences among groups for relative 342
weights of heart and kidneys. It is poorly understood why kidneys, blood vessels and the 343
heart are the most affected by early life events (Thornburg 2015). Relative heart weights 344
within the deviant group were higher when compared with other groups. The increase of 345
heart weight has been related with hyperfunction of the myocardium in humans (Vlasov & 346
Volkov 2004) and with an increase on systolic blood pressure and ventricular mass in mice 347
(Donjacour et al. 2014). Thus, our results on deviant pups might reflect further consequences 348
on this cardiovascular phenotype and additional investigations could shed some light on how 349
embryo preimplantation development influences the cardiovascular system. Among the long 350
term effects of ART, cardiovascular problems are the most concerning health issue as an 351
increased risk of developing cardiovascular diseases in comparison with naturally conceived 352
babies has been reported (Padhee et al. 2015, Pontesilli et al. 2015). 353
One of the major limitations of this study is the small number of embryo transfers performed. 354
Thus, although the results showed some evidence of effects of preimplantation cell behaviour 355
on subsequent development, further studies are needed to reassure the presented data. 356
Furthermore, it is suggested that a follow up offspring study is conducted in order to 357
investigate in more depth the consequences of the obtained organ morphometry. Likewise, 358
this work was carried out in mice and caution should be taken when translating the reported 359
results in to humans. 360
In conclusion, the present study supports the theory that cell allocation patterns during 361
pre-implantation embryo development could be a conserved mechanism in mammalian 362
17 about the effects of ART in further offspring health, especially long term effects. A better 364
understanding on the effects of in vitro embryo micromanipulation on further development is 365
paramount not only to improve success rates in ART, but also to ensure the health of 366
resulting offspring. 367
7.
DECLARATION OF INTEREST
368
None declared 369
8.
FUNDING
370
PhD studies of LPSR are funded by CONACyT Mexico. 371
9.
ACKNOWLEDGEMENTS
372
We would like to thank the Bio Support Unit at the University of Nottingham for husbandry 373
of rodents during this study and to senior technician Ms Anne Skinner for her experienced 374
help on dissecting the mouse pups. 375
10.
REFERENCES
376
Alarcón VB & Marikawa Y 2003 Deviation of the Blastocyst Axis from the First Cleavage Plane Does 377
Not Affect the Quality of Mouse Postimplantation Development. Biology of Reproduction69 378
1208-1212. 379
Alarcón VB & Marikawa Y 2008 Spatial alignment of the mouse blastocyst axis across the first 380
cleavage plane is caused by mechanical constraint rather than developmental bias among 381
18 Bay B, Mortensen EL & Kesmodel US 2014 Is subfertility or fertility treatment associated with long-383
term growth in the offspring? A cohort study. Fertility and Sterility102 1117-1123. 384
Bischoff M, Parfitt D-E & Zernicka-Goetz M 2008 Formation of the embryonic-abembryonic axis of 385
the mouse blastocyst: relationships between orientation of early cleavage divisions and 386
pattern of symmetric/asymmetric divisions. Development135 953-962. 387
Botros L, Sakkas D & Seli E 2008 Metabolomics and its application for non-invasive embryo 388
assessment in IVF. Molecular Human Reproduction14 679-690. 389
Ceelen M, van Weissenbruch MM, Prein J, Smit JJ, Vermeiden JP, Spreeuwenberg M, van Leeuwen 390
FE & Delemarre-van de Waal HA 2009 Growth during infancy and early childhood in relation 391
to blood pressure and body fat measures at age 8-18 years of IVF children and 392
spontaneously conceived controls born to subfertile parents. Hum Reprod24 2788-2795. 393
Cha J, Sun X & Dey SK 2012 Mechanisms of implantation: strategies for successful pregnancy. Nat
394
Med18 1754-1767. 395
Chen S, Sun F-z, Huang X, Wang X, Tang N, Zhu B & Li B 2015 Assisted reproduction causes placental 396
maldevelopment and dysfunction linked to reduced fetal weight in mice. Scientific Reports5 397
10596. 398
Cui L, Zhang Z, Sun F, Duan X, Wang M, Di K & Li X 2014 Transcervical embryo transfer in mice. J Am
399
Assoc Lab Anim Sci53 228-231. 400
De Rycke M, Belva F, Goossens V, Moutou C, SenGupta SB, Traeger-Synodinos J & Coonen E 2015 401
ESHRE PGD Consortium data collection XIII: cycles from January to December 2010 with 402
pregnancy follow-up to October 2011. Human Reproduction. 403
Donjacour A, Liu X, Lin W, Simbulan R & Rinaudo PF 2014 In Vitro Fertilization Affects Growth and 404
Glucose Metabolism in a Sex-Specific Manner in an Outbred Mouse Model. Biology of
405
Reproduction90 80-80. 406
Fujimori T, Kurotaki Y, Miyazaki J & Nabeshima Y 2003 Analysis of cell lineage in two- and four-cell 407
19 Gardner DK 2015 Lactate production by the mammalian blastocyst: Manipulating the 409
microenvironment for uterine implantation and invasion? BioEssays37 364-371. 410
Gardner RL 1997 The early blastocyst is bilaterally symmetrical and its axis of symmetry is aligned 411
with the animal-vegetal axis of the zygote in the mouse. Development124 289-301. 412
Gardner RL 2007 The axis of polarity of the mouse blastocyst is specified before blastulation and 413
independently of the zona pellucida. Human Reproduction22 798-806. 414
González S, Ibáñez E & Santaló J 2011 Influence of early fate decisions at the two-cell stage on the 415
derivation of mouse embryonic stem cell lines. Stem Cell Research7 54-65. 416
Hemkemeyer SA, Schwarzer C, Boiani M, Ehmcke J, Le Gac S, Schlatt S & Nordhoff V 2014 Effects of 417
embryo culture media do not persist after implantation: a histological study in mice. Human
418
Reproduction29 220-233. 419
Hesters L, Prisant N, Fanchin R, Méndez Lozano DH, Feyereisen E, Frydman R, Tachdjian G & 420
Frydman N 2008 Impact of early cleaved zygote morphology on embryo development and in 421
vitro fertilization–embryo transfer outcome: a prospective study. Fertility and Sterility 89 422
1677-1684. 423
HFEA. 2013. Fertility treatment in 2011: Trends and Figures. In Authority HFEA. 424
Hosseini S-M, Moulavi F, Tanhaie-Vash N, Asgari V, Ghanaei H-R, Abedi-Dorche M, Jafarzadeh N, 425
Gourabi H, Shahverdi A-H, Dizaj AV, Shirazi A & Nasr-Esfahani M-H 2016 The Principal 426
Forces of Oocyte Polarity Are Evolutionary Conserved but May Not Affect the Contribution 427
of the First Two Blastomeres to the Blastocyst Development in Mammals. Plos One 11 428
e0148382. 429
Katayama M & Roberts RM 2010 The effect of superovulation on the contributions of individual 430
blastomeres from 2-cell stage CF1 mouse embryos to the blastocyst. Int J Dev Biol54 675-431
681. 432
Kurotaki Y, Hatta K, Nakao K, Nabeshima Y-i & Fujimori T 2007 Blastocyst Axis Is Specified 433
20 Liu Z, Hai T, Dai X, Zhao X, Wang Y, Brochard V, Zhou S, Wan H, Zhang H, Wang L, Zhou Q & 435
Beaujean N 2012 Early patterning of cloned mouse embryos contributes to post-436
implantation development. Dev Biol. 437
Meseguer M, Rubio I, Cruz M, Basile N, Marcos J & Requena A 2012 Embryo incubation and 438
selection in a time-lapse monitoring system improves pregnancy outcome compared with a 439
standard incubator: a retrospective cohort study. Fertility and Sterility98 1481-1489.e1410. 440
Motosugi N, Bauer T, Polanski Z, Solter D & Hiiragi T 2005 Polarity of the mouse embryo is 441
established at blastocyst and is not prepatterned. Genes & Development19 1081-1092. 442
Munné S, Wells D & Cohen J 2010 Technology requirements for preimplantation genetic diagnosis 443
to improve assisted reproduction outcomes. Fertility and Sterility94 408-430. 444
O'Neill KE, Tuuli M, Odibo AO, Odem RR & Cooper A 2014 Sex-related growth differences are 445
present but not enhanced in IVF pregnancies. Fertility and Sterility101 407-412.e401. 446
Padhee M, Zhang S, Lie S, Wang KC, Botting KJ, McMillen IC, MacLaughlin SM & Morrison JL 2015 447
The Periconceptional Environment and Cardiovascular Disease: Does In Vitro Embryo Culture 448
and Transfer Influence Cardiovascular Development and Health? Nutrients7 1378-1425. 449
Park SK, Won C, Choi YJ, Kang H & Roh S 2009 The leading blastomere of the 2-cell stage 450
parthenogenetic porcine embryo contributes to the abembryonic part first. J Vet Med Sci71 451
569-576. 452
Peyvandi F, Garagiola I & Mortarino M 2011 Prenatal diagnosis and preimplantation genetic 453
diagnosis: novel technologies and state of the art of PGD in different regions of the world. 454
Haemophilia17 14-17. 455
Piotrowska-Nitsche K & Zernicka-Goetz M 2005 Spatial arrangement of individual 4-cell stage 456
blastomeres and the order in which they are generated correlate with blastocyst pattern in 457
21 Piotrowska K, Wianny F, Pedersen RA & Zernicka-Goetz M 2001 Blastomeres arising from the first 459
cleavage division have distinguishable fates in normal mouse development. Development
460
128 3739-3748. 461
Piotrowska K & Zernicka-Goetz M 2002 Early patterning of the mouse embryo — contributions of 462
sperm and egg. Development129 5803-5813. 463
Plusa B, Hadjantonakis AK, Gray D, Piotrowska-Nitsche K, Jedrusik A, Papaioannou VE, Glover DM 464
& Zernicka-Goetz M 2005 The first cleavage of the mouse zygote predicts the blastocyst 465
axis. Nature434 391-395. 466
Pontesilli M, Painter RC, Grooten IJ, van der Post JA, Mol BW, Vrijkotte TGM, Repping S & 467
Roseboom TJ 2015 Subfertility and assisted reproduction techniques are associated with 468
poorer cardiometabolic profiles in childhood. Reproductive BioMedicine Online30 258-267. 469
Sepulveda-Rincon LP, Dube D, Adenot P, Laffont L, Ruffini S, Gall L, Campbell BK, Duranthon V, 470
Beaujean N & Maalouf WE 2016 Random Allocation of Blastomere Descendants to the 471
Trophectoderm and ICM of the Bovine Blastocyst. Biol Reprod95 123, 121-110. 472
Simpson JL 2012 Preimplantation genetic diagnosis to improve pregnancy outcomes in subfertility. 473
Best Practice & Research Clinical Obstetrics & Gynaecology26 805-815. 474
Thornburg KL 2015 The programming of cardiovascular disease. Journal of Developmental Origins of
475
Health and Disease6 366-376. 476
Torres-Padilla M-E, Parfitt D-E, Kouzarides T & Zernicka-Goetz M 2007 Histone arginine methylation 477
regulates pluripotency in the early mouse embryo. Nature445 214-218. 478
Vlasov YA & Volkov AM 2004 Dependence of the Heart Weight on the Body Weight in Patients with 479
Cardiovascular Diseases. Human Physiology30 428-434. 480
Waksmundzka M, Wiśniewska A & Maleszewski M 2006 Allocation of Cells in Mouse Blastocyst Is 481
Not Determined by the Order of Cleavage of the First Two Blastomeres. Biology of
482
22 Wang H & Dey SK 2006 Roadmap to embryo implantation: clues from mouse models. Nat Rev Genet
484
7 185-199. 485
Wennekamp S, Mesecke S, Nedelec F & Hiiragi T 2013 A self-organization framework for symmetry 486
breaking in the mammalian embryo. Nat Rev Mol Cell Biol14 454-461. 487
Wuensch KL 1993 Cross-species fostering affects meat preferences of wild house mice. J Gen Psychol
488
120 413-419. 489
Zernicka-Goetz M 2005 Cleavage pattern and emerging asymmetry of the mouse embryo. Nat Rev
490
Mol Cell Biol6 919-928. 491
492
493
Figure legends
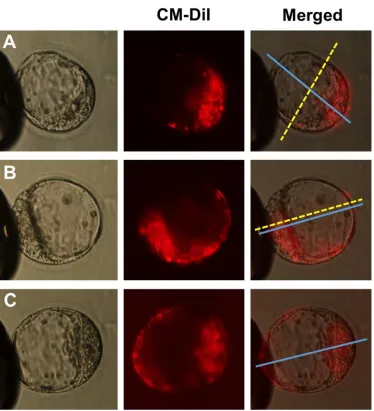
Figure 1. Mouse embryo cell allocation patterns at blastocyst stage. A: Orthogonal embryos, the boundary (doted yellow line) of the stained and non-stained cells is orthogonal to the embryonic-abembryonic (Em-Ab) axis (blue line); B: Deviant embryos, the boundary of stained and non-stained cells is parallel to the Em-Ab axis; and C: Random embryos, stained and non-stained cells are randomly distributed and no boundary line between them can be seen.
Figure 2. Incidence of different cell allocation patterns across control and biopsied mouse embryos. A: Cell allocation pattern incidence in B6CBAF1 x B6CBAF1 blastocysts. B: Cell allocation pattern incidence in B6C3F1 x B6D2F1 blastocysts. *** Denotes statistical difference p < 0.001.
Figure 3. Boxplots comparing the relative organ weights from 2 week old mice. a) Lungs, b) Liver, c) Pancreas, d) Spleen, e) Heart and and f) Kidneys. Relative organ weights were calculated diving the organ weight by the total body weight. A total of 45 pups were analysed: orthogonal (n=12), deviant (n=8) and random (n=25). No significant difference was found among groups for lungs, liver,
Table 1. Non-surgical embryo transfer results in mice. Total numbers and different rates (percentages) among groups are not significantly different (p>0.05 by Kruskal-Wallis test).
Embryo group Orthogonal Deviant Random
Transferred blastocysts
76 76 123
Surrogates 5 5 7
Pregnancy rate 66.6% 83.3% 100.0%
Implantation rate 42.3% 39.9% 50.7%
Pregnancy loss rate 49.6% 79.1% 55.9%
Total pups (litters) 12 (3) 8 (2) 25 (6)
Mean litter (SD) 4.0 (2.6) 4.0 (1.4) 4.1 (2.2)
Live offspring rate 14.7% 11.4% 22.9%
[image:24.612.89.514.102.327.2]Figure 1. Mouse embryo cell allocation patterns at blastocyst stage. A: Orthogonal embryos, the boundary (doted yellow line) of the stained and non-stained cells is orthogonal to the embryonic-abembryonic
(Em-Ab) axis (blue line); B: Deviant embryos, the boundary of stained and non-stained cells is parallel to the Em-Ab axis; and C: Random embryos, stained and non-stained cells are randomly distributed and no
boundary line between them can be seen.
Figure 2. Incidence of different cell allocation patterns across control and biopsied mouse embryos. A: Cell allocation pattern incidence in B6CBAF1 x B6CBAF1 blastocysts. B: Cell allocation pattern incidence in
Figure 3. Boxplots comparing the relative organ weights from 2 week old mice. a) Lungs, b) Liver, c) Pancreas, d) Spleen, e) Heart and and f) Kidneys. Relative organ weights were calculated diving the organ
weight by the total body weight. A total of 45 pups were analysed: orthogonal (n=12), deviant (n=8) and random (n=25). No significant difference was found among groups for lungs, liver, pancreas and spleen.
Heart and kidneys relative weights showed difference among groups (p<0.05 by Kruskal Wallis-Test). *Denotes statistical difference (p<0.05 by Mann-Whitney U-test).