1
Alcohol consumption and the risk of Tuberculosis: A systematic review and Meta-analysis 1
Evangelia Simou1, John Britton 1, Jo Leonardi-Bee1
2
1UK Centre for Tobacco and Alcohol Studies, Division of Epidemiology and Public Health,
3
University of Nottingham, Hucknall Road, Nottingham NG5 1PB
4
Address for Correspondence: Evangelia Simou, PhD student, Division of Epidemiology and 5
Public Health, University of Nottingham, Hucknall Road, Nottingham NG5 1PB, Tel: +44 115
6
82 31388Fax: +44 115 82 31337. Email: Evangelia.simou@nottingham.ac.uk
7
Word Count: 2985 8
Summary count: 203 9
Number of figures: 5 10
Number of tables: 2 11
Number of references: 72 12
Conflicts of interest: 13
ES, JB and JLB have no competing interest
14
Author contributions: ES, JB and JL-B designed the study and wrote the protocol. ES wrote 15
the search strategy and undertook the literature searches, and wrote the draft of the
16
manuscript. ES and JLB undertook study screening, data extraction, and quality assessment.
17
ES undertook all data analysis, supervised by JL-B. All authors contributed to the
18
interpretation of the findings. JB and JLB provided critical revisions to the article, and all
19
authors approved the final version of the article to be published. ES acts as guarantor of the
20
manuscript.
21
Declaration of all sources of funding: 22
This work was supported by the Medical Research Council [grant number MR/K023195/1];
23
the UK Centre for Tobacco and Alcohol Studies (http://www.ukctas.net); and the British
24
Heart Foundation, Cancer Research UK, the Economic and Social Research Council, and the
25
National Institute of Health Research, under the auspices of the UK Clinical Research
26
Collaboration, is gratefully acknowledged.
27 28
2 Running head: Alcohol and tuberculosis risk 30
SUMMARY 31
OBJECTIVE: To perform a systematic review and meta-analysis of the association between 32
alcohol consumption and tuberculosis risk.
33
METHODS: Medline, EMBASE and Web of Science were searched for observational studies 34
from 2005 to April 2018. Reference lists of included studies were screened.
35
RESULTS: Forty nine studies were included. Compared to people with low or no alcohol 36
intake, the risk of tuberculosis in people with high or any alcohol consumption was
37
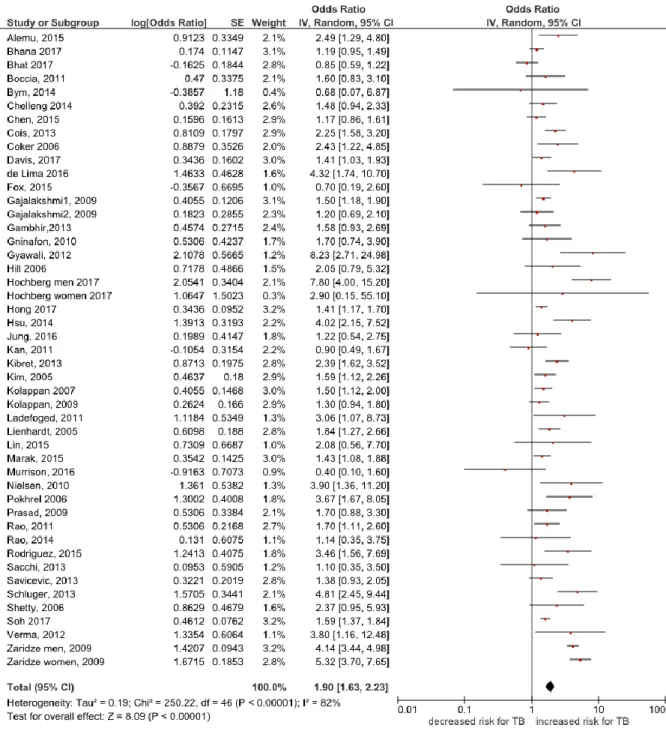
increased by a relative odds of 1.90 (95%CI: 1.63-2.23). Substantial levels of heterogeneity
38
were seen (I2=82%), but there was no evidence of publication bias (P=0.54). Sensitivity
39
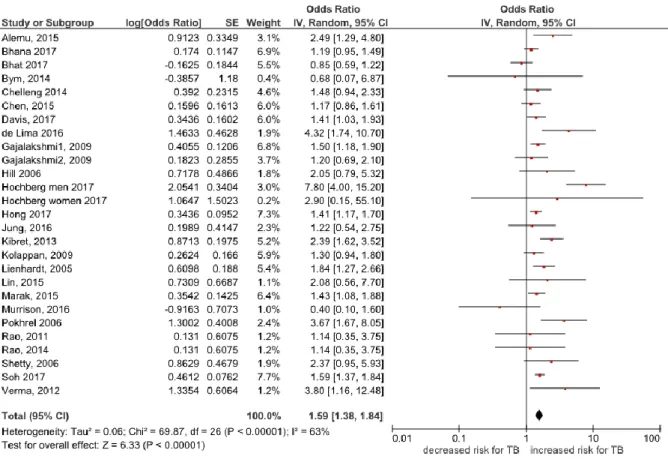
analysis restricted to studies using no alcohol drinking as a reference group found a slightly
40
lower but still increased risk (Odds Ratio= 1.59, 95%CI: 1.38-1.84). Subgroup analyses found
41
no significant differences in relation to study design and quality, geographic location,
42
publication year, and adjustment for confounders. A pooled analysis of a further four
43
studies reporting hazard ratios, found nearly a tripling increase in risk of TB in relation to
44
alcohol consumption during follow-up (HR=2.81, 95%CI: 2.12-3.74). An exposure-response
45
analysis showed that for every 10-20 grams daily alcohol intake, there was 12% increase in
46
TB risk.
47
CONCLUSION: Alcohol consumption is an important risk factor for the development of TB. 48
Keywords: alcohol; tuberculosis; meta-analysis 49
3
Tuberculosis (TB) is a major global health problem with high morbidity and mortality. In
51
2015, TB was the 10th leading global cause of death, according to WHO, accounting for an
52
estimated annual 1.4 million deaths each year. The global incidence of tuberculosis is about
53
10.4 million new cases, of which 5.9, 3.5 and 1.0 million occur respectively among men,
54
women and children. This burden of disease falls particularly on low and middle income
55
countries 1, 2
56
Mycobacterium tuberculosis is the causal agent of TB and known risk factors include HIV
57
infection, smoking, socio-economic deprivation, undernutrition, diabetes, indoor air
58
pollution and alcohol consumption 3-5.
59
Alcohol consumption is also a potential risk factor for TB, because alcohol can impair the
60
immune system 6, 7 and increase susceptibility to both primary infection and reactivation of
61
disease8; and is associated with a higher risk of malnutrition and liver disease both of which
62
impair immunity9. Alcohol consumption may further increase TB risk as a result of poor
63
uptake of medical services among heavy alcohol consumers 10. High alcohol consumption
64
may also be associated with TB either through causal pathways involving, or confounding by
65
homelessness, imprisonment and illicit drug use, all of which also increase the risk of
66
tuberculosis 11, 12.
67
A systematic review published almost 10 years ago identified that alcohol is associated with
68
TB13,and was updated in a new systematic review and meta-analysis published in 201714.
69
However both of these reviews limited their searches to two databases, and may thus have
70
missed important studies, while the most recent review14 included studies only up to June
71
2016, since when several relevant studies have been published. Another review assessed
4
the effects of alcohol on the risk of active TB, but used only self-reported symptoms of
73
productive cough and haemoptysis to ascertain disease status15.
74
We have therefore performed a comprehensive systematic review and meta-analysis to
75
provide a more valid estimate of the magnitude and exposure-response characteristics of
76
the association between alcohol intake and tuberculosis risk.
77
METHODS 78
Our review uses the Preferred Reporting Items for Systematic Reviews and Meta-Analysis
79
(PRISMA) 16 and Meta-analysis of Observational Studies in Epidemiology (MOOSE) 17
80
methods. The protocol was published in PROSPERO under the registration number:
81
CRD42015029910
82
The review included studies which met the following inclusion criteria: (1) comparative
83
observational study designs (cohort/ longitudinal, case control, cross sectional); (2) adults
84
aged 18+ years; (3) alcohol consumption reported as an exposure; (4)
85
comparative/reference group of either no alcohol consumption or the lowest exposed
86
category; and (5) tuberculosis reported as an outcome. Studies which provided only the
87
abstract or reported as conference articles were also included. We excluded studies related
88
to latent tuberculosis, multidrug resistant TB, TB prevention, treatment compliance and
89
hospital acquired TB.
90
Search strategy 91
A search of Medline (Ovid), EMBASE (Ovid) and Web of Science was performed from
92
January 2005 to April 2018. We also reviewed the reference lists of the included studies and
93
previous systematic reviews to identify further potential eligible studies. Specific search
5
filters 18 (SIGN) for observational study designs were used and search terms for both alcohol
95
and TB created using relevant Cochrane Review groups 19. No language restriction was
96
imposed and where necessary papers were translated into English. The database search
97
strategies are provided as Supplementary material. Two reviewers (ES, JL-B) independently
98
screened the titles/ abstract in the first stage and the full text of the eligible ones in the
99
second stage of the review process. Discrepancies were resolved with help of a third
100
reviewer (JB). Where duplicate publications were found, the most comprehensive paper or
101
the most recent paper was included.
102
Data extraction 103
Two reviewers (ES, JLB) independently extracted the data. Variables of interest included:
104
author, year of study, study design, definitions and diagnostic criteria for exposure (alcohol)
105
and outcome (TB), geographic location, reference population, demographic of study
106
population setting, and adjustment for confounders.
107
Quality assessment 108
The Newcastle-Ottawa Quality Scale was used for the assessment of methodological quality
109
of the included studies 20. A study having a score of >= 6 or was deemed to be high quality.
110
Two researchers (ES, JLB) independently assessed the quality of the studies. Discrepancies
111
were resolved through discussion. Where the studies were only published in abstract form
112
we didn’t further conduct a quality assessment due to the required information not being
113
adequate.
114
6
Results were expressed as odds ratio (OR), risk ratios (RR) or hazard ratios (HR) with 95%
116
confidence intervals (95% CI). Where available, we used measures of risk adjusted for
117
smoking and socioeconomic status, in preference to unadjusted estimates reported or
118
derived from the raw data. Where we used raw data from the included studies, we
119
estimated ORs for case control studies and RRs for longitudinal, cohort and cross sectional
120
studies. We pooled ORs and RRs together to estimate pooled ORs in cases of a rare
121
outcome; however HRs were pooled as a separate analysis.
122
We used a random effects (DerSimonian and Laird) meta-analysis, taking into account the
123
heterogeneity/ variation of the included studies (τ2), using the generic inverse variance
124
method. We used the I2 statistic for the quantification of heterogeneity21. Funnel plots were
125
used to assess publication bias; and where data for at least 10 studies were available we
126
used Egger’s asymmetry tests to formally assess the evidence of publication bias.
127
When high levels of heterogeneity were identified (I2>50%), we carried out subgroup
128
analyses to explore potential reasons for heterogeneity based on study design, study
129
quality, year of publication, adjustment for confounders and geographic location. We also
130
conducted sensitivity analyses to explore the robustness of our findings, through restricting
131
our analysis to studies which reported the reference groups as those with no alcohol
132
drinking, studies which assessed the effects of alcoholism or alcohol abuse, studies that
133
recruited from HIV populations and studies that adjusted for smoking as a confounder.
134
A dose response analysis was performed using a random- effects dose response
meta-135
regression model, assuming a linear dose response relation 22, 23. Studies included in the
136
analysis were required to have at least three different exposure categories, and the
137
midpoints of categories used to quantify exposure. Where the highest category was
7
ended; the midpoint value was estimated as the lower bound plus 1.2 times the lower
139
boundary. Grams per day were used as a standard measure for our analysis. Dose categories
140
relating to quantities of alcohol were created to equate to 10-20 grams of pure alcohol per
141
day (approximately one drink per day). Where individual studies reported categories which
142
contained the same dose ranges we collapsed these into a single dose category, estimating
143
a pooled effect estimates based on a fixed effect meta- analysis model. All statistical
144
analyses were performed using Stata (14.0) and Review Manager (5.3) software. A p-value
145
<0.05 was used to represent a statistically significant level.
146
RESULTS 147
The electronic searches yielded a total of 1739 articles, and a further 14 were identified
148
from reference list searches. After removal of 400 duplicates, 1353 articles were screened
149
for title/ abstract eligibility and 121 found to justify full text screening.
150
Of these, 72 were excluded due to the ineligibility of the outcome or the exposure (n=12) or
151
the exposure (n=2); or insufficient data on alcohol consumption (n=4); no comparison group
152
for the outcome (n=52); or outcome information was incorporated with other diseases
153
(n=2). Thus, 49 studies met our inclusion criteria and were included in the review.
154
Overview of the studies 155
The study characteristics of the included studies in this review are presented in Table 1. The
156
studies included a total of 560.598 participants, and the mean ages of people with TB within
157
the sixteen studies reported this was ranged from: 33.6-61.2 years.
158
Twenty eight studies were conducted in Asia; 10 in Africa; 7 in America and 4 in Europe.
159
Thirty three were case control studies; ten were cross sectional and six were cohort studies.
8
Forty four of the studies reported ORs or RRs 24-67 ; 4 reported HRs 68-71 and one did not
161
provide sufficient information 72.Thirty four studies provided adjusted effect estimates and
162
thirteen of these had also adjusted for smoking 24, 28-30, 34, 36, 42, 44, 49, 52, 55, 64, 71.
163
The majority of studies (45 studies) assessed alcohol use through self-report via a
164
questionnaire or an interview. Of the rest, two studies assessed alcohol using the AUDIT
165
(Alcohol Use Disorders Identification Test), one study used ICD codes 33, and one used
166
medical records 34.
167
The reference group for 27studies comprised people who never consumed alcohol, while in
168
three studies the comparison was between consumption defined as abuse or non-abuse 33,
169
35, 53, and five studies compared alcoholism to no alcoholism 32, 36, 47, 62, 69. The reference
170
group for the remaining fourteen studies comprised people who consumed the lowest
171
quantity of alcohol.
172
For the diagnosis of TB, the majority of studies used bacteriological confirmation with
173
sputum smear and/ or culture and chest x-ray characteristics. Others used ICD codes 33, 52, 70,
174
71; medical records 46; questionnaire 27; record linkage67, clinic database data 35; Revised
175
National Tuberculosis Control Programme definition 49. In three studies the method of TB
176
ascertainment was not provided 30, 48, 63.
177
The quality assessment scores indicated that 24 studies were of high quality. However, 23
178
studies found to have a low quality score, with the main reason for this was either the lack
179
of adjustment for confounders; the information bias as a result of the lack of provided
180
information description in outcome or exposure assessment; or due to a low response rate.
181
No quality assessment was conducted for two studies for which only an abstract was
9
available. In total the quality assessment indicated a median score of 6 with a range of: 2-8
183
(Table 2).
184
Meta-analysis findings 185
Forty eight of the forty nine studies were included in the meta-analysis. One study could not
186
be included in the meta-analysis, as data were reported in insufficient detail 72; briefly in this
187
study both the TB cases and controls were non- consumers of alcohol. Forty four of the 48
188
included studies provided data from which pooled odds ratios could be estimated. A
meta-189
analysis of these studies showed a 90% increase in the odds of TB among people who
190
consumed alcohol at all, or in higher amounts, than in those who consumed no, or lower
191
amounts of alcohol respectively (pooled OR= 1.90, 95% CI 1.63 to 2.23, I2= 82%, Figure 2).
192
No evidence of publication bias was detected either visually via a funnel plot or statistically
193
via Egger’s asymmetry test (P = 0.54).
194
Subgroup analyses exploring the possible reasons for the identified heterogeneity in the
195
meta-analysis are presented (see Table 2 in the online data supplement). However, the high
196
level of heterogeneity was not explained by study design (case control, longitudinal/cohort;
197
p for subgroup differences=0.24), methodological quality (high versus low; p=0.31),
198
adjustment for confounders (adjusted versus unadjusted; p=0.32), country of study
199
(America, Asia, Europe, Australia; p=0.25) or year of publication (20052010 versus 2011
-200
2017; p= 0.28).
201
Sensitivity analyses were conducted restricting the meta-analysis to studies with a priori
202
defined criteria. Studies which reported the reference group as no drinking produced a
203
pooled effect estimate lower than the unrestricted meta-analysis, with an OR of 1.59
10
(95%CI: 1.38-1.84, I2=63%, 25 studies) 24-26, 28, 30, 34, 37, 39-42, 44, 45, 49-51, 55, 57, 60, 61, 63-67. Analysis
205
limited to studies categorizing alcohol intake as alcohol abuse/alcoholism found a similar
206
magnitude of increased risk compared to the unrestricted meta-analysis (pooled OR=1.81,
207
95%CI: 1.28-2.57, I2=66%, 8 studies) 32, 33, 35, 36, 47, 53, 59, 62. Restricting the meta-analysis to TB
208
patients with HIV co-infection showed similar results to the main meta-analysis (OR=2.02,
209
95%CI: 1.22-3.36, I2= 55%, 6 studies) 24, 29, 42, 46, 51, 60. Also restricting the meta-analysis to
210
studies reporting smoking adjusted estimates showed that alcohol consumption was also
211
associated with increased risk for TB (pooled OR=1.73, 95%CI: 1.18-2.53, I2= 91%, 12 studies)
212
24, 28-30, 34, 36, 42, 44, 49, 52, 55, 64.
213
Four of the 48 included studies presented effect estimates as hazard ratios 68-71. A separate
214
pooled analysis of these studies found a higher hazard ratio of 2.81 for TB in relation to
215
alcohol consumption (95% CI: 2.12-3.74, I2= 9%, Figure 3).
216
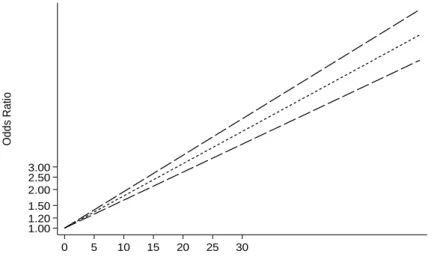
Dose response effect 217
Three of the included studies provided data which enabled a dose-response effect
meta-218
analysis 42, 44, 52. The pooled dose-response analysis identified a significant increase in TB risk
219
in relation to quantity of alcohol consumed, by 12% for every additional 10-20 grams daily
220
intake (pooled RR= 1.12, 95% CI 1.10 to 1.13; p<0.0001; Figure 6).
221
DISCUSSION 222
Summary of the findings 223
In this systematic review and meta-analysis we provide contemporary estimates of the
224
effect of alcohol consumption on the risk of TB among adults. Our pooled analysis
225
demonstrates a 90% higher odd of TB risk in relation to alcohol consumption, and that the
11
magnitude of this effect appears robust to differences in alcohol reference group definition
227
and to be consistent in subgroup analyses. The effect is also exposure-related.
228
Strengths and limitations 229
Our study constitutes a comprehensive review using specific search strategy and with no
230
language restriction. A large number of studies were identified and included in our
meta-231
analysis. Also, our results are likely to be generalizable, as our review includes global
232
evidence of many different countries. There was also no evidence of publication bias.
233
However, we found a high level of between study heterogeneity. Almost all of the studies
234
ascertained alcohol intake by self-report methods, raising the possibility of reporting bias,
235
but the potential for misclassification arising from inclusion of non-drinkers in the lowest
236
exposure category in some studies does not seem to have influenced our findings, since the
237
estimated effect of alcohol was similar; if slightly lower, in those studies involving a zero-
238
intake reference group. Residual confounding or recall bias arising from retrospective
239
designs may also have influenced our results.
240
Comparison with other studies 241
A meta-analysis by Lönnroth et al 13, published ten years ago, showed that there is a
three-242
fold increased risk only in people with an average daily alcohol consumption of more than
243
40 grams or have an alcohol use disorder. This estimate is higher than that arising from our
244
dose response analysis, which indicated that a daily alcohol consumption of 40-50 grams
245
would lead to a 48% increased risk for TB. A possible explanation for this difference is the
246
inclusion of alcohol use disorder in the analysis of Lönnroth study13.
12
Recently a meta-analysis of alcohol effects on TB incidence published in 2017 by Imitiaz et al
248
14, which was an update of the previous published systematic review of Lönnroth13estimated
249
a 35% increase in risk among those who consume alcohol relative to those who do not, and
250
the risk was marginally greater (RR=1.50) when drinkers were also included in the reference
251
category. They also performed a dose response analysis indicating an increasing risk of TB
252
with increasing amounts of alcohol consumed, but when they performed categorical dose-
253
response meta-analyses non-significant results were found for the ≤ 24 and >24 to ≤ 60
254
alcohol categories. In contrast to the previous systematic review by Imitiaz14, our more
255
comprehensive searches and meta-analysis found that drinkers are 1.59 times more likely to
256
have TB compared to non-drinkers. Similarly higher odds of TB (OR=1.90) were also found
257
when in our analysis people who consumed low alcohol were included in the reference
258
group. We further found that consuming drinks that contain 10-20 grams of alcohol
259
everyday was linked to a 12% increased risk of TB, but we did not performed a categorical
260
dose response meta-analysis as Imitiaz et al did14. However the Imitiaz study was restricted
261
to searches of only two databases which, as acknowledged by the authors, will miss eligible
262
studies, therefore making their findings misleading. This concern is borne out by our finding
263
of 33 eligible studies that were missed from the Imitiaz et al review, 14 making our
264
estimates more likely to be valid.
265
Another meta-analysis in 14 high Tuberculosis burden countries assessed the effect of
266
alcohol, diabetes, low body mass index on the risk of self-reported symptoms of active
267
tuberculosis was conducted in 2014 by Patra et al 15. They found that ever drinking was
268
associated with a 26% increased risk of TB symptoms in men and with a 50% increased risk
269
in women when adjusted for age and education. However adjustment for further
13
confounders showed a non-significant association. However Patra study15 relied on
self-271
reported productive cough and haemoptysis to ascertain active TB, which while a pragmatic
272
approach is likely to be less valid than the clinical diagnoses used in our meta-analysis.
273
Conclusions 274
In conclusion, our review confirms that alcohol drinking is associated with an increased risk
275
of tuberculosis. Also, in the dose–response analysis, the increase in tuberculosis risk
276
associated with every 10-20 grams linear increment in daily alcohol intake. Therefore our
277
findings suggest that measures that reduce alcohol consumption are likely to lead to a
278
reduced risk of TB in the general population.
279
Acknowledgements
280
The authors thank Erica Brasil, Magdalena Opazo-Breton and Yue Huang from the University of 281
Nottingham for their help in translations 282
References 283
1. Organization. WH. Global tuberculosis report 2016. 284
2. Dye C. Global epidemiology of tuberculosis. The Lancet. 2006 Mar 18;367(9514):938-40. 285
3. Lönnroth K CK, Chakaya JM, Chauhan LS, Floyd K, Glaziou P, Raviglione MC. Tuberculosis 286
control and elimination 2010–50: cure, care, and social development. The Lancet. 2010 May 287
28;375(9728):1814-29. 288
4. Lönnroth K JE, Williams BG, Dye C, Raviglione M. Drivers of tuberculosis epidemics: the role 289
of risk factors and social determinants. . Social science & medicine. 2009 Jun 30;68(12):2240-6. 290
5. Bates MN KA, Pai M, Chang L, Lessa F, Smith KR. Risk of tuberculosis from exposure to 291
tobacco smoke: a systematic review and meta-analysis. Arch Intern Med 2007.167:335–42. 292
6. Mason CM, Dobard E, Zhang P, Nelson S. Alcohol exacerbates murine pulmonary 293
tuberculosis. Infection and immunity. 2004;72(5):2556-63. 294
7. Szabo G. Alcohol's contribution to compromised immunity. Alcohol health and research 295
world. 1997;21:30-41. 296
8. Happel KI NS. Alcohol, immunosuppression, and the lung. Proceedings of the American 297
Thoracic Society. 2005 Dec;2(5):428-32. 298
9. Dunne FJ. Alcohol and the immune system. BMJ: British Medical Journal. 299
1989;298(6673):543. 300
10. Parry C RJ, Poznyak V, Room R. Alcohol and infectious diseases: an overlooked causal 301
linkage? Addiction. 2009 Mar 1;104(3):331-2. 302
11. Fazel S, Bains P, Doll H. Substance abuse and dependence in prisoners: a systematic review. 303
14
12. Story A, Murad S, Roberts W, Verheyen M, Hayward AC. Tuberculosis in London: the 305
importance of homelessness, problem drug use and prison. Thorax. 2007;62(8):667-71. 306
13. Lönnroth K, Williams BG, Stadlin S, Jaramillo E, Dye C. Alcohol use as a risk factor for 307
tuberculosis–a systematic review. BMC Public Health. 2008;8(1):289. 308
14. Imtiaz S, Shield KD, Roerecke M, Samokhvalov AV, Lönnroth K, Rehm J. Alcohol consumption 309
as a risk factor for tuberculosis: meta-analyses and burden of disease. Eur Respir J. 310
2017;50(1):1700216. 311
15. Patra J, Jha P, Rehm J, Suraweera W. Tobacco smoking, alcohol drinking, diabetes, low body 312
mass index and the risk of self-reported symptoms of active tuberculosis: individual participant data 313
(IPD) meta-analyses of 72,684 individuals in 14 high tuberculosis burden countries. PLoS ONE. 314
2014;9(5):e96433. 315
16. Moher D, Liberati A, Tetzlaff J, Altman DG. Preferred reporting items for systematic reviews 316
and meta-analyses: the PRISMA statement. Ann Intern Med. 2009;151(4):264-9. 317
17. Stroup DF, Berlin JA, Morton SC, Olkin I, Williamson GD, Rennie D, et al. Meta-analysis of 318
observational studies in epidemiology: a proposal for reporting. Journal of American Medical 319
Association. 2000;283(15):2008-12. 320
18. SIGN. Healthcare Improvement Scotland. 321
19. Library. C. Available from: http://www.cochranelibrary.com/. 322
20. Wells G, Shea B, O’connell D, Peterson J, Welch V, Losos M, et al. The Newcastle-Ottawa 323
Scale (NOS) for assessing the quality of nonrandomised studies in meta-analyses 324
http://www.ohri.ca/programs/clinical_epidemiology/oxford.asp (accessed 10 February 2016). 325
21. Higgins JP, Thompson SG, Deeks JJ, Altman DG. Measuring inconsistency in meta-analyses. 326
Bmj. 2003;327(7414):557-60. 327
22. Greenland S, Longnecker MP. Methods for trend estimation from summarized dose-328
response data, with applications to meta-analysis. Am J Epidemiol. 1992;135(11):1301-9. 329
23. Orsini N, Bellocco R, Greenland S. Generalized least squares for trend estimation of 330
summarized dose-response data. Stata Journal. 2006;6(1):40. 331
24. Alemu YM, Awoke W, Wilder-Smith A. Determinants for tuberculosis in HIV-infected adults 332
in Northwest Ethiopia:multicentre case-control Study. BMJ Open. 2016;6 (4) (no 333
pagination)(e009058). 334
25. Chelleng PK, Devi KR, Borbora D, Chetia M, Saikia A, Mahanta J, et al. Risk factors of 335
pulmonary tuberculosis in tea garden communities of Assam, India. Indian J Med Res. 336
2014;140(JUL):138-41. 337
26. Chen M, Deng J, Li W, Lin D, Su C, Wang M, et al. Impact of tea drinking upon tuberculosis: a 338
neglected issue. BMC Public Health. 2015;15:515. 339
27. Cois A, Ehrlich R. Problem drinking as a risk factor for tuberculosis: a propensity score 340
matched analysis of a national survey. BMC Public Health. 2013;13:871. 341
28. Davis A, Terlikbayeva A, Aifah A, Hermosilla S, Zhumadilov Z, Berikova E, et al. Risks for 342
tuberculosis in Kazakhstan: Implications for prevention. International Journal of Tuberculosis and 343
Lung Disease. 2017;21(1):86-92 and i-v. 344
29. Fox GJ, Lee RS, Lucas M, Khan FA, Proulx JF, Hornby K, et al. Inadequate Diet Is Associated 345
with Acquiring Mycobacterium tuberculosis Infection in an Inuit Community. A Case-Control Study. 346
Ann Am Thorac Soc. 2015;12(8):1153-62. 347
30. Gajalakshmi V, Peto R. Smoking, drinking and incident tuberculosis in rural India: population-348
based case-control study. Int J Epidemiol. 2009;38(4):1018-25. 349
31. Gninafon M, Ade G, Ait-Khaled N, Enarson DA, Chiang CY. Exposure to combustion of solid 350
fuel and tuberculosis: A matched case - Control study. Eur Respir J. 2011;38(1):132-8. 351
32. Gyawali N, Gurung R, Poudyal N, Amatya R, Shrestha R, Khanal LK, et al. Tobacco and 352
alcohol: the relation to pulmonary tuberculosis in household contacts. Nepal Med Coll J. 353
15
33. Hsu WH, Kuo CH, Wang SS, Lu CY, Liu CJ, Chuah SK, et al. Acid suppressive agents and risk of 355
Mycobacterium tuberculosis: case-control study. BMC Gastroenterol. 2014;14:91. 356
34. Jung WJ, Park YM, Song JH, Chung KS, Kim SY, Kim EY, et al. Risk factors for tuberculosis after 357
gastrectomy in gastric cancer. World Journal of Gastroenterology. 2016;22(8):2585-91. 358
35. Kim S, Crittenden KS. Risk factors for tuberculosis among inmates: a retrospective analysis. 359
Public Health Nurs. 2005;22(2):108-18. 360
36. Kolappan C, Gopi PG, Subramani R, Narayanan PR. Selected biological and behavioural risk 361
factors associated with pulmonary tuberculosis. Int J Tuberc Lung Dis. 2007;11(9):999-1003. 362
37. Kolappan C, Subramani R. Association between biomass fuel and pulmonary tuberculosis: a 363
nested case-control study. Thorax. 2009;64(8):705-8. 364
38. Ladefoged K, Rendal T, Skifte T, Andersson M, Soborg B, Koch A. Risk factors for tuberculosis 365
in Greenland: case-control study. Int J Tuberc Lung Dis. 2011;15(1):44-9. 366
39. Lienhardt C, Fielding K, Sillah JS, Bah B, Gustafson P, Warndorff D, et al. Investigation of the 367
risk factors for tuberculosis: A case-control study in three countries in West Africa. Int J Epidemiol. 368
2005;34(4):914-23. 369
40. Lin YH, Chen CP, Chen PY, Huang JC, Ho C, Weng HH, et al. Screening for pulmonary 370
tuberculosis in type 2 diabetes elderly: a cross-sectional study in a community hospital. BMC Public 371
Health. 2015;15:3. 372
41. Marak B, Kaur P, Rao SR, Selvaraju S. Non-communicable disease comorbidities and risk 373
factors among tuberculosis patients, Meghalaya, India. Indian J. 2016;63(2):123-5. 374
42. Murrison LB, Martinson N, Moloney RM, Msandiwa R, Mashabela M, Samet JM, et al. 375
Tobacco Smoking and Tuberculosis among Men Living with HIV in Johannesburg, South Africa: A 376
Case-Control Study. PLoS ONE. 2016;11(11). 377
43. Nielsen NO, Skifte T, Andersson M, Wohlfahrt J, Sborg B, Koch A, et al. Both high and low 378
serum vitamin D concentrations are associated with tuberculosis: A case-control study in Greenland. 379
Br J Nutr. 2010;104(10):1487-91. 380
44. Rao VG, Bhat J, Yadav R, Muniyandi M, Bhondeley MK, Sharada MA, et al. Tobacco smoking: 381
A major risk factor for pulmonary tuberculosis - evidence from a cross-sectional study in central 382
India. Transactions of the Royal Society of Tropical Medicine and Hygiene. 2014;108(8):474-81. 383
45. Rao VG, Gopi PG, Bhat J, Yadav R, Selvakumar N, Wares DF. Selected risk factors associated 384
with pulmonary tuberculosis among Saharia tribe of Madhya Pradesh, central India. Eur J Public 385
Health. 2012;22(2):271-3. 386
46. Rodriguez FAH, Agbo SO. An assessment of the risk factors for pulmonary tuberculosis 387
among adult patients suffering from human immunodeficiency virus attending the Wellness Clinic at 388
Themba Hospital. South African Family Practice. 2015;57(2):106-11. 389
47. Sacchi FPC, Croda MG, Estevan AO, Ko AI, Croda J. Sugar cane manufacturing is associated 390
with tuberculosis in an indigenous population in Brazil. Transactions of the Royal Society of Tropical 391
Medicine and Hygiene. 2013;107(3):152-7. 392
48. Schluger NW, Terlikbayeva A, El-Bassel N, Darisheva M, Hermosilla S, Zhumadilov Z, et al. 393
Risk factors for tuberculosis in Kazakhstan: A case control study. American Journal of Respiratory and 394
Critical Care Medicine Conference: American Thoracic Society International Conference, ATS. 395
2013;187(no pagination). 396
49. Shetty N, Shemko M, Vaz M, D'Souza G. An epidemiological evaluation of risk factors for 397
tuberculosis in South India: a matched case control study. Int J Tuberc Lung Dis. 2006;10(1):80-6. 398
50. Sinaga BYM, Siregar Y, Amin M, Sarumpaet SM. Smoking and alcohol consumption as risk 399
factors of pulmonary tuberculosis development in Medan, Indonesia. Respirology. 2014;19:61. 400
51. Verma SC, Dhungana GP, Joshi HS, Kunwar HB, Pokhrel AK. Prevalence of pulmonary 401
tuberculosis among HIV infected persons in Pokhara, Nepal. J. 2012;10(1):32-6. 402
52. Zaridze D, Brennan P, Boreham J, Boroda A, Karpov R, Lazarev A, et al. Alcohol and cause-403
specific mortality in Russia: a retrospective case-control study of 48 557 adult deaths. The Lancet. 404
16
53. Boccia D, Hargreaves J, De Stavola BL, Fielding K, Schaap A, Godfrey-Faussett P, et al. The 406
association between household socioeconomic position and prevalent tuberculosis in Zambia: a 407
case-control study. PLoS ONE. 2011;6(6):e20824. 408
54. Coker R, McKee M, Atun R, Dimitrova B, Dodonova E, Kuznetsov S, et al. Risk factors for 409
pulmonary tuberculosis in Russia: case-control study. Bmj. 2006;332(7533):85-7. 410
55. de Lima DS, Ogusku MM, dos Santos MP, de Melo Silva CM, de Almeida VA, Antunes IA, et al. 411
Alleles of HLA-DRB1* 04 Associated with Pulmonary Tuberculosis in Amazon Brazilian Population. 412
PLoS ONE. 2016;11(2):e0147543. 413
56. Gambhir HS, Kaushik RM, Kaushik R, Sindhwani G. Tobacco smoking-associated risk for 414
tuberculosis: a case-control study. International Health. 2010;2(3):216-22. 415
57. Hill PC, Jackson-Sillah D, Donkor SA, Otu J, Adegbola RA, Lienhardt C. Risk factors for 416
pulmonary tuberculosis: a clinic-based case control study in The Gambia. BMC Public Health. 417
2006;6(1):156. 418
58. Jurcev-Savicevic A, Mulic R, Ban B, Kozul K, Bacun-Ivcek L, Valic J, et al. Risk factors for 419
pulmonary tuberculosis in Croatia: a matched case–control study. BMC Public Health. 420
2013;13(1):991. 421
59. Kan X, Chiang C-Y, Enarson DA, Chen W, Yang J, Chen G. Indoor solid fuel use and 422
tuberculosis in China: a matched case-control study. BMC Public Health. 2011;11(1):498. 423
60. Kibret KT, Yalew AW, Belaineh BG, Asres MM. Determinant factors associated with 424
occurrence of tuberculosis among adult people living with HIV after antiretroviral treatment 425
initiation in Addis Ababa, Ethiopia: a case control study. PLoS ONE. 2013;8(5):e64488. 426
61. Pokhrel AK, Bates MN, Verma SC, Joshi HS, Sreeramareddy CT, Smith KR. Tuberculosis and 427
indoor biomass and kerosene use in Nepal: a case–control study. Environmental health perspectives. 428
2010;118(4):558. 429
62. Prasad R, Suryakant RG, Singhal S, Dawar R, Agarwal G. A case-control study of tobacco 430
smoking and tuberculosis in India. Annals of thoracic medicine. 2009;4(4):208. 431
63. Bhana A, Rathod SD, Selohilwe O, Kathree T, Petersen I. Characteristics and correlates of 432
alcohol consumption among adult chronic care patients in North West Province, South Africa. SAMJ: 433
South African Medical Journal. 2017;107(7):636-42. 434
64. Bhat J, Rao V, Sharma R, Muniyandi M, Yadav R, Bhondley MK. Investigation of the risk 435
factors for pulmonary tuberculosis: A case–control study among Saharia tribe in Gwalior district, 436
Madhya Pradesh, India. The Indian journal of medical research. 2017;146(1):97. 437
65. Hochberg NS, Sarkar S, Horsburgh Jr CR, Knudsen S, Pleskunas J, Sahu S, et al. Comorbidities 438
in pulmonary tuberculosis cases in Puducherry and Tamil Nadu, India: Opportunities for 439
intervention. PLoS ONE. 2017;12(8):e0183195. 440
66. Hong EP, Go MJ, Kim H-L, Park JW. Risk prediction of pulmonary tuberculosis using genetic 441
and conventional risk factors in adult Korean population. PLoS ONE. 2017;12(3):e0174642. 442
67. Soh AZ, Chee CB, Wang Y-T, Yuan J-M, Koh W-P. Dietary intake of antioxidant vitamins and 443
carotenoids and risk of developing active tuberculosis in a prospective population-based cohort 444
study. Am J Epidemiol. 2017;186(4):491-500. 445
68. Inghammar M, Löfdahl C-G, Winqvist N, Ljungberg B, Egesten A, Engström G. Impaired 446
pulmonary function and the risk of tuberculosis: a population-based cohort study. Eur Respir J. 447
2011;37(5):1285-7. 448
69. Moran-Mendoza O, Marion S, Elwood K, Patrick D, FitzGerald J. Risk factors for developing 449
tuberculosis: a 12-year follow-up of contacts of tuberculosis cases. The International Journal of 450
Tuberculosis and Lung Disease. 2010;14(9):1112-9. 451
70. Yung-Feng Yen H-YH, Ya-Ling Lee, Po-Wen Ku, Pei-Hung Chuang, Yun-Ju Lai and Dachen Chu. 452
Heavy alcohol consumption increases the risk of active tuberculosis in Taiwanese adults: a 453
17
71. Pednekar MS, Sansone G, Gupta PC. Association of alcohol, alcohol and tobacco with 455
mortality: Findings from a prospective cohort study in Mumbai (Bombay), India. Alcohol. 456
2012;46(2):139-46. 457
72. Lakshmi P, Virdi NK, Thakur J, Smith KR, Bates MN, Kumar R. Biomass fuel and risk of 458
tuberculosis: a case–control study from Northern India. J Epidemiol Community Health. 2010:jech. 459
2010.115840. 460
18 Table 1.Characteristics of included studies
Study&
Year Study design
Geographical
location Population
Characteristics of people with
TB Number of included subjects Alcohol ascertainment Alcohol definition Tuberculosis ascertainment Adjustment/ matching Alemu, 2015
24 Case-control Africa
HIV population
Male: 46% Mean age: -
446
Questionnaire interview
Alcohol consumption
Yes vs no
Sputum microscopy, X-ray,
histopathology, culture or molecular
Adjusted for: HAART,CPT, IPT,
smoking, khat, TB family patient
Bhat, 201764 Case-control India/Asia District population
Male: 79% Mean age: -
1602
Questionnaire
Alcohol consumption
Yes vs no
Sputum smear and culture examinations
Adjusted for:age, sex,
occupation, BMI, family income, history of asthma, chewing tobacco, smoking tobacco,
blood sugar
Bhana,
201763 Cross-sectional Africa
Hospital population Male: 24.8% Mean age:46.8 1332 AUDIT Questionnaire Alcohol consumption
Yes vs no -
No adjustment/ matching performed
Boccia, 2011
53 Case-control Africa
General population Male:53.9% Mean age:36 370 Questionnaire/ interview Alcohol abuse >3 drinks per
occasion Sputum sample
culture positive
Adjusted for sex, age group, area of residence, household
socioeconomic position
Bym, 2014 50
Case-control
Indonesia/Asia General
population
- 152
Self-report Alcohol
consumption yes vs no
Sputum positive test
Matched for: sex, age and ethnic
Chelleng
2014 25 Case-control Asia
Occupational population
- 873
Questionnaire
Alcohol consumption yes vs
no
sputum smear and culture positive
Adjusted for: age and sex, BMI, income, literacy
Chen, 2015
26 Case-control China/Asia
General population
Male: 74.4% Mean age: -
1156 Self-report
Questionnaire
Alcohol drinking
(yes vs no) Bacteriological results
Matched for: gender and age
Cois, 2013 27 Cross-sectional South Africa/
Africa
Research database data
- 8115
CAGE Questionnaire
Problem drinking vs moderate/
abstainers
Questionnaire Has a doctor or
nurse or health worker at
19
a clinic or hospital told you that you have or have had TB
Coker 2006
54 Case-control Russia/ Europe
General population
- 668
Questionnaire Heavy drinking at
least once/month in past year
Culture positive
Adjusted for: age, sex, diabetes
Davis, 2016
28 Case-control Kazakhstan/Asia
General population Male:55% Mean age:35.4 1600 Questionnaire
Ever drank alcohol vs never alcohol
Culture methods
Adjusted for: age, sex, ethnicity, education level, incarceration,
marital status, smoking, drug use, HIV, diabetes
de Lima,
2016 55
Case-control Brazil/ South
America Outpatient population Male:61.4% Mean age:36 622 Questionnaire Alcohol yes (Women: >=120 ml
& Men: >= 150 ml At the same time within the last 30
days) vs no
Sputum smear and culture positive
Adjusted for: sex, smoking
Fox, 2015 29
Case-control
Canada/North
America HIV population
- 65
Self-report Questionnaire/
Interview
Recent alcohol use
Culture positive
Adjusted for: age stratum, sex, living with a person with smear-positive tuberculosis, visiting a
gathering house, room occupancy, and low vegetable intake, smoking, cannabis use Gajalakshmi,
2009 30 Case-control India/Asia
Rural general population
- 2912
Interview Ever vs never drinkers - Adjusted for: age, education, smoking
Gambhir,
2010 56 Case-control Asia
Hospital population
Male:78.9% Mean age: 43.2
287
Questionnaire
Regular alcohol use >= 200 ml of 40%– 60% alcohol for four
days or more in a week for the last five years or more.
Sputum smear positive
Matched for: age and sex
Gninafon,
2010 31 Case-control Africa
General population
Male: 69.5% Mean age: 35.2
600
Questionnaire
Daily alcohol use
yes vs no Smear positive
Matched: age and sex
Gyawali,
2012 32
Cross-sectional
Asia General
population
Male:40.9% Mean age: -
986
Self-report Questionnaire
Alcoholic (yes vs no)
Sputum smear
No adjustment/ matching performed
Hill 2006 57 Case-control Africa Outpatient
population
Male: 65% Mean age: 33.6
300 Questionnaire current/past vs
never consumers Sputum smear and
culture positive
20
Hochberg,
201765 Case control India/Asia
General population
Male: 75.1%
Mean age: 45 409 AUDIT
questionnaire
Alcohol consumption
Yes vs no Smear positive
No adjustment/ matching performed
Hong,
201766 Case-control Korea/ Asia
Two research databases data
Mean age: 61.2 Mean age: 58.1
2459
Self-report Questionnaire
Current vs
non-drinkers sputum smear and
culture positive
No adjustment/ matching performed
Hsu, 2014 33 Case-control Taiwan/Asia Research database
data
Male:65.4% Mean age:57.7
71951
ICD 9 codes
Alcohol abuse
ICD 9 codes
Matched for: age, sex, year/month of index visit
Inghammar,
2011 68 Cohort Sweden/Europe
General population
- 28.907
Questionnaire
Problematic drinking yes vs no
Confirmed bacteriology or diagnosed by a
clinician
No adjustment/ matching performed
Jung, 2015 34 Cohort Asia Gastric cancer
population
Male: 87.5% Mean age: -
1776
Medical records
Alcohol history yes
vs no Culture
Adjusted for: sex, age, BMI, smoking, previous TB infection,
surgery gastrectomy
Kan, 2011 59 Case-control Asia Outpatient
population
Male:72.8% Median age:63
624
Questionnaire
Daily alcohol use Frequency & amount of alcoholic
beverages
Sputum smear positive
Matched for: age, sex
Kibret, 2013
60 Case-control Africa
HIV population Male:56.6%
Mean age:36.7
613 Questionnaire/
interview
alcohol drinking yes
vs no Sputum smear
positive
No adjustment/ matching performed
Kim, 2005 35 Case-control USA /North
America
Clinic database data
Male: - Mean age: 37.7
919
Questionnaire
Alcohol abuser
TB database clinic data
Adjusted for: ethnicity, married, homeless, drug user, HIV positive, type of crime, length of
stay in jail Kolappan,
2007 36
Cross-sectional
India/Asia General
population
- 93.945 Self-report
Questionnaire
Alcoholism vs
non-alcoholism Sputum smear/ culture examination
Adjusted for: age, sex, smoking
Kolappan,
200937
Case-control
India/Asia Rural and urban
units
Male:87% Mean age: -
1530
Self-report Questionnaire/
interview
Alcohol user vs non drinkers Ever had consumed
alcoholic liquor before interview
Sputum smear or culture examination
Adjusted for: age and sex, biomass fuel
Ladefoged,
2011 38 Case-control
Greenland/ North America Hospital population Male: 58% Median age:37 730 Questionnaire Alcohol often(at least once/week) X ray/positive histology/culture positive
Adjusted for: age, sex, ethnicity, town, immunosuppressive
21
vs seldom (less than once a
week)
Lakshmi,
2010 72 Case-control Asia
General population
- 378
Questionnaire Alcohol intake yes
vs no Sputum smear
positive
Matched for: age and residence area
Lienhardt,
2005 39 Case-control
West Africa/ Africa
General population
Male: 69% Mean age: -
2325
controls Questionnaire
Alcohol intake Current/past vs
never
Smear positive
Matched for: age
Lin, 2015 40 Cross-sectional Taiwan/Asia
Hospital and public health centre
population
- 2.979
Self-report Questionnaire Alcohol consumption (yes vs no) Sputum culture
No adjustment/ matching performed Marak, 2015 41 Cross-sectional India/Asia Outpatient patients Male:63.6% Mean age: -
210
Self-report Questionnaire
Current alcohol consumer >=1 drinks in the year preceding the
survey vs never
Confirmed bacteriology or diagnosed by a
clinician
No adjustment/ matching performed
Mendoza,
2010 69 Cohort
Canada/North America
Clinic database data
Male:57% Mean age: -
33.146
Questionnaire
Alcoholism yesvs
no
Sputum smear and culture positive
Adjusted for: immunosuppressive condition, age, LBTI treatment, Closeness of contact, drug use, ethnicity, socioeconomic status, sex, country with high tuberculosis
prevalence
Murrison,
2016 42 Case-control Africa
HIV hospital and outpatient populations
Male: - Median age: 38
279
Questionnaire
Drinks/week >=15 drinks vs 0
drinks
Sputum smear microscopy or sputum culture
Adjusted for: smoking, age, education, employment status, household income, CD4, History of previous TB, Duration of HIV
Nielsen,
2010 43 Case-control
Greenland/ North America
Hospital population
- 754
Questionnaire
Frequent (every day or 1-6
times/week) vs (non- frequent
<1/ week)
Culture/x-ray
Matched for: sex, age and district, 25(OH)D and ethnicity
Pednekar,
2012 71 Cohort India/Asia
General population
- 35.102
Questionnaire Drinkers vs never drinkers ICD codes Adjusted for age, education, and tobacco use.
Pokhrel
2010 61 Case-control Asia
Hospital population
Male: - Mean age: 35
375
Questionnaire Alcohol
consumption yes vs no
Chest x ray and positive active sputum smear
22
Prasad, 2009
62 Case-control Asia
Hospital population
444 Questionnaire/
interview Alcoholism yes vs
no
Sputum smear positive +interview
Matched for: age, sex
Rao, 2011 45 Cross-sectional India/Asia General
population
- 9.538
Questionnaire Alcohol consumption (yes vs no) Sputum samples smear microscopy and solid media culture
methods
No adjustment/ matching performed
Rao, 2014 44 Cross-sectional India/Asia General
population
- 95.071
Questionnaire
Alcohol/day Heavy alcohol (>500 ml/day for
>20 years) Vs Non-alcohol consumers Sputum smear specimen
Adjusted for: sex, age, smoking, social class
Rodriguez,
2015 46 Cross-sectional Africa HIV population
Male:33% Mean age:38.2 300 Questionnaire/ Interview Heavy/moderate drinker vs
light/non-drinker Medical records
Adjusted for: age, marital status, outdoor environment
Sacchi, 2012 47 Case-control Brazil/ South America Indigenous general population Male:57.1% Mean age: -
189
Questionnaire/ interview
Alcoholism yes vs no
X-ray, thorax CT (computed tomography) and/or positive sputum smear or
culture.
Matched for: age, geographic location
Savicevic,
2013 58 Case-control Europe
General population
- 600
Questionnaire
Current vs never consumer
Daily alcohol last 12 months
Vs Less than once a
week, last 12 months
Culture positive pulmonary TB
Matched for: age, sex, country of residence
Schluger,
2013 48
Case-control
Asia General
population
Male:50% Mean age: -
173
Self-report Questionnaire
Regular alcohol
users -
No adjustment/ matching performed
Shetty, 2006
49 Case-control India/Asia
Outpatient population
- 378
Questionnaire
Alcohol use Current (at least 6 months)
Revised National Tuberculosis Control Programme
23
vs never (RNTCP) case
definition
cooking fuel, smoking
Soh, 201767 Cohort Asia Research database
data
Male:73.5% Mean age:59.1
57471
Questionnaire
Alcohol consumption
Yes vs no
Record linkage
No adjustment/ matching performed
Verma, 2012
51 Cross-sectional Asia HIV population
- 184 Self-report
Questionnaire/ interview
Alcohol habit yes vs
no Culture /smear
No adjustment/ matching performed
Yen, 2017 70 Cohort Asia General
population
Male:41.9% Mean age:43.2
46.196 Self-report
Questionnaire interview
Heavy alcohol consumption: intoxication at least once/week vs never
drinking
ICD 9 codes
Adjusted for: age, sex, marital status, educational level
Zaridze,
2009 52
Case-control Russia/Europe General
population
- 48.557 Questionnaire Weekly intake (>=3
bottles of vodka vs <0.5 bottles of
vodka)
ICD codes Adjusted for: age, city, and
24
Table 2.Critical appraisal of included studies using Newcastle Ottawa Scale
Study, year Stars number
Selection† Comparability‡ Exposure§
Alemu, 2015 24 3 2 2
Bhat, 201764 3 2 2
Bhana, 201763 0 0 2
Boccia, 2011 53 4 1 1
Bym, 2014* 50 - - -
Chelleng 2014 25 3 1 1
Chen, 2015 26 3 1 1
Cois, 2013 27 1 1 3
Coker 2006 54 4 1 1
Davis, 2016 28 4 2 2
de Lima, 2016 55 3 2 1
Fox, 2015 29 3 2 1
Gajalakshmi, 2009 30 3 2 2
Gambhir, 2010 56 3 1 2
Gninafon, 201031 4 2 1
Gyawali, 2012 32 2 0 1
Hill 2006 57 3 1 2
Hochberg, 201765 2 0 3
Hong, 201766 4 0 1
Hsu, 2014 33 3 0 1
Inghammar 2011 68 2 0 2
Jung, 2015 34 2 2 2
Kan, 2011 59 4 1 1
Kibret KT, 2013 60 3 0 2
Kim, 2005 35 3 2 1
Kolappan, 200736 2 2 1
Kolappan, 200937 4 1 2
Ladefoged, 2011 38 3 1 3
Lakshmi, 2010 72 2 1 2
Lienhardt, 2005 39 4 0 1
Lin, 2015 40 1 0 1
Marak, 2015 41 1 0 2
Mendoza, 2010 69 2 1 3
Murrison, 201642 2 2 1
Nielsen, 2010 43 3 1 1
Pednekar, 2012 71 2 2 3
Pokhrel 2010 61 2 1 2
Prasad, 2009 62 3 1 1
Rao, 2010 45 1 0 1
Rao, 2014 44 2 2 2
Rodriguez, 2015 46 2 1 1
Sacchi, 2012 47 3 1 2
Savicevic, 2013 58 4 1 2
Schluger, 2013* 48 - - -
Shetty, 2006 49 2 2 1
Soh, 201767 3 0 3
Verma, 2012 51 2 0 1
Yen, 2017 70 2 2 3
25
*Abstract only available-not quality assessment † Maximum 4 stars
‡ Maximum 2 stars § Maximum 3 stars
Figure 1.PRISMA Flow Diagram
Records identified through database searching
(n = 1739)
Sc
re
e
n
in
g
In
cl
u
d
e
d
El
ig
ib
ili
ty
Id
e
n
tif
ic
ation
Additional records identified through other sources
(n =14)
Records after duplicates removed (n =1353)
Records screened
(n = 1353) Records excluded (n =1232)
Full-text articles assessed for eligibility
(n = 121)
Full-text articles excluded, with reasons (n = 72)
no comparison group for outcome, n=52
outcome/ not eligible, n=12
exposure/ not eligible, n=2
no information for alcohol, n=4
incorporated outcome with other disease, n=2
Studies included in qualitative synthesis
(n =49)
Studies included in quantitative synthesis (meta-
26
27
Figure 3. Forest plot of the association between any alcohol versus no alcohol consumption and the risk of TB
28
Figure 5.Linear dose response meta-analysis for the association between categories of alcohol intake(grams/day) and the risk of TB
List of Figures
Figure 1.PRISMA Flow Diagram... 25 Figure 2. Forest plot of the association between any alcohol consumption versus non-alcohol/lower alcohol consumption and the risk of TB ... 26 Figure 3. Forest plot of the association between any alcohol versus no alcohol consumption and the risk of TB... 27 Figure 4.Forest plot of the association between alcohol consumption versus non-alcohol/lower alcohol consumption and the risk of TB (data presented as hazard ratios) ... 27 Figure 5.Linear dose response meta-analysis for the association between categories of alcohol intake(grams/day) and the risk of TB ... 28
List of Tables
Table 1.Characteristics of included studies ... 18 Table 2.Critical appraisal of included studies using Newcastle Ottawa Scale ... 24
1.00 1.20 1.50 2.00 2.50 3.00
O
d
d
s
R
a
ti
o
0 5 10 15 20 25 30