; . 6 . 294 @1 <91 @8. 7 50= . 81 097 ; ? >2< =57 ? 6 . >598
93 >? </51 5>2= 58 >4 2 7 . <89=9" . <28. 02. !
89<>4 2<8 . ; 288582=! 5>. 6 @
1 ATID 2KKIQ
. >HEQIQ =S BL IRRED FNP RHE 1 EG PEE NF ; H1 AR RHE
? MITEPQIRVNF=R . MD PEU Q
&,+'
3S KKL ERAD ARA FNP RHIQ IREL IQ ATAIKABKE IM =R . MDPEU Q <EQ EAPCH <EONQIRNPV
AR-HRRO-$ $ PEQEAPCH" PEONQIRNPV#QR" AMD PEU Q#AC#S J $
; KEAQE S QE RHIQ ID EMRIFIEP RN CIRE NP KIMJ RN RHIQ IREL
-HRRO-$ $ HDK#HAMD KE#MER$ &%%'($ ,)%*
Palaeohydrodynamics and Computer simulation of turbidites in the Marnoso-Arenacea,
Northern Apennines, Italy.
A dissertation submitted for the degree of Ph.D at the University of St. Andrews, December 1951
T Of Si
Thrsis CopyTioht Eisrtion Ferro.
A UNkESTR1OTED A)
tls„ "In submitting this thesis to the University of St. Andrews I ond.rE-tehd that
I re giving permission for it to be b.ade avei):--h:le for pob)ic Ln ,ee
with the reoolations of the UnivrrQity library fur the time 1'-5ng 5h f, •ce,
subject to any copyright vested in the work not being effected thereby. I
also understand that the title and abstract will be published, and that a copy
of the work may be made and supplied to any bone fide library or research
worker."
B RESTRICTED
"In submitting this thesis to the University of St. Andrews I wish access to
it to be subject to the following conditions:
for a period of years [maximum 5] from the date of submission the
thesis shall be
a) withheld from public use.
b) made available for public use only with consent of the head or chairman
of the department in which the work was carried out.
I understand, however, that the title and abstract of the thesis will be
published during this period of restricted access; and that after the
expiry of this period the thesis will be made available for public use in
accordance with the regulations of the University Library for the time being
in force, subject to any copyright in the work not being affected thereby,
and a copy of the work may be made and supplied to any bona fide library or
research worker."
Declaration
I wish to exercise option f\ [i.e. A, Ba...e,p—Cal of the above options.
Signature Date
i r
r
This research was carried out whilst under the receipt of a
N.E.R.C. research studentship, for which I am grateful.
I would like to express by sincere gratitude to Professor E.K.
Walton (University of St. Andrews) and Professor F. Ricci Lucchi
(University of Bologna) for their friendly encouragement and guidance
during the supervision of this research.
Thanks are due to Mrs. L. Miller in the St.Andre s University
Computing Laboratory, whose patience and understanding helped produce
the computer simulation programmes. The fine computing facilities at
St. Andrews and the invaluable help given by various members of the
academic and technical staff is gratefully acknowledged.
I would like to express by sincere gratitude to Mrs. N. Wood for
painstakingly typing the script, Miss K. Finley for the typing of
tables and to Mr. J. Allen for producing excellent photographic
results.
It has not been possible to give full, credit to all people who
have advised, encouraged, criticised or otherwise shown interest in
this research, but I would like to extend my gratitude to all those
Abstract
Observation of turbidite features including areal development and
thickness of Bouma units, grainsize and grading are used to define the
flow parameters of a turbidity current. Observations have been made
on four beds in the Marnoso-Arenacea formation in the Northern
Apennines, Italy. This allows the estimation of turbidity current
depth, volume, velocity, deceleration and density variation. A
computer simulation of sediment deposition at a single locality from a
turbidity current flow has been developed. The latter enables
theoretical units derived from experimental and theoretical studies to
be compared with field observations.
Studies of a large turbidite, the 'Contessa bed' show that it was
introduced into a long, narrow basin from a southeasterly source and
continued to flow northwestwards before turning on itself with the
consequent reversing of structures. It is postulated the reversal was
due to the collision of the turbidity current against an intra-basin
fault scarp. This reversed the current before it had reached the full
length'of the basin.
Syndepositional mudflows have been discovered in three beds,
occurring at the Bouma 'C' and 'D' interface. They are related to
sediment highs, fan-fringe positions and inherent instabilities in the
sediment. After liquefaction, movement and freezing the mudflows were
-iv-
Contents
Acknowledgements
Certificate
Abstract
Page
ii
iii
Chapter One: Introduction and reveiw of previous literature
Chapter Two: The Marnoso-Arenacea formation;
Geological setting 10
Chapter Three: Description of the Contessa bed 17
3.1 Introduction 17
3.2 The Houma 'A' unit 19
3.3 The Houma unit 19
3.4 Sole markings 22
3.5 Inclusions 26
3.6 The Bouma 'C' unit 29
3.7 The Bouma 'DE' unit 41
3.8 The Hemipelagic unit 42
3.9 Sediment analysis 43
3.10 Size and velocity of the Contessa
flow 47
3.11 The Contessa turbidity current:
a discussion 50
Chapter Four: Description of turbidites D.21, 0.38, 0.41 56
4.1 Introduction 56
4.2 Houma 'B' units 56
4.3 Sole markings 57
4.4 Bouma 'C' units 59
4.5 Convoluted bedding and slumping 61
4.6 Bouma 'DE, units 65
4.7 Sediment analysis 65
4.8 Flow size and velocity values for
-v-
Page
Chapter. Five: Sedimentary Structures of turbidites 68
5.1 Introduction 68
5.2 Sole marking 68
5.3 Bourne 'A' formation 71
5.4 Formation of Bourne 'B' units 73
5.5 Formation and significance at rip-
up clasts 76
5.6 Bouma 'C' unit formation 77
5.7 Bouma ID 1 unit formation 83•
5.8 Bouma unit thickness variation 84
Grainsize variation in turbidites 05
Chapter. Six: Syndepositional, intra-turbidite mudflows 88
6.1 Introduction
6.2 Description of the Contessa intra- bed mudflow
6.3 Description of the D.38 and 8.41
88
88
intra-bed mudflows
6.4 Formation of the .Contessa, D.38 and
92
D.41 intra-bed mudflows 98
Chapter Seven: Computer simulation of turbidites 107
7.1 Introduction 107
7.2 Velocity decay 107
7.3 Grain-sizes, deposition 110
7.4 Tedforms 111
7.5 Density decay and depth 114
7.6 Simulation program results 116
Chapter Eight: Discussion on the validity of the
• simulation model 120
Bibliography
Appendix A: Grainsize and modal analysis of rock specimens
Appendix B: Calculation of regression lines and correlation coefficients
Appendix C: Computer simulation program for deposition of sediment from a turbidity current with time (maximum grainsizes)
Appendix D: Computer'simulation program for deposition of sediment from a turbidity current with time (mean grainsizes)
Appendix E: List hydrodynamic symbols and units
r 1 r
Chapter One
Introduction and review of previous literature
Since Kuenen and Nigliorini (1950) started a geological
revolution with the concept that graded beds in the geological record
had been formed by submarine density currents the complete study of a
single bed derived from a single density current has long been cited
as a major problem (Walker, 1973).
Turbidity currents are currents containing suspended sediment
which flow within a standing body of water due to their inherent
higher densities. When the flows decelerate, overloading, deposition
of sediment and consequent density decay produce a laterally and
vertically graded bed.
The depositional unit of a gradually decelerating turbidity
current is the Bouma sequence comprising a structureless, graded 'A'
unit, an upper stage planerparallel 'B' unit, a crossrstratified 'C'
unit, a lower stage planerparallel laminated 'D' unit and an oceanic
fallout 'E' unit (Bouma, 1962). The sequence is of practical
importance in the study of bedding thickness variations and properties
of grainsize, sole markings, internal structures, etc., and their
dependence on current velocity, rate of deceleration, depth and
F 2
The aims of this work is to define the parameters of a turbidity
current r volume, depth, velocity deceleration, density variation t
from the observed features of turbidites r grainsize, grading,
thickness, areal development and thickness of Bouma units. To this
end observations have been made in four beds in the MarnosowArenacea
in the Northern Apennines, Italy; and a computer simulation of
deposition at a single locality from a turbidity current has been
developed. The latter required information on the parameters listed
above from previous work which is treated below and includes
experimental and theoretical studies, observations on recent turbidity
currents and their deposits, and observations of ancient turbidites.
Turbidity current velocity is related to flow depth, density,
gravitational force, slope and frictional resistance at the base and
top of the flow. (see Kuenen, 1951; Johnson, 1966; Middleton, 1966a;
Scheidegger and Potter, 1971; Kersey and Hsu, 1976.) It is these
factors that control the type of flow (tranquil, turbulent, etc.) as
defined by the flow Reynolds number or densiometric Fronde number
(Middleton, 1966a; Kersey and Hsu, 1976). The velocity decay
downflow, or at a point, is less clearly understood because of the
problems of direct observation in nature and the difficulties in 3D
modelling of flow using experimental or theoretical models. Plapp and
Mitchel]. (1966), invoking turbulent boundary layer theory, argue that
velocity at a point downflow is inversely proportional to the
horizontal distance from source. Potter and Scheidegger (1966) relate
the deposited grainsize as a function of turbulence decay, while
energy to velocity, slope, flow depth and density. Hanesjee (1977)
found that the rate of deceleration affected grainsize sorting and
growth rate of sedimentary structures, while Luthi (1980) found
velocity decay related to density decay and not slope.
Density distribution through flows on horizontal floors is
uniform, but decreases upwards towards the flow interface on steeper
slopes due to ambient mixing of water across the flow boundaries
(Luthi, 1980). In distal flows Stonely (1957) says that downward
density increment in turbidity currents is constant at about 0.6 so
producing thin, high density distal flows, while Plapp and Mitchell (1960) disagree, and say it is one-twentieth of this and results in thick, low density flows. This fundamental problem on the nature of
distal turbudity flows still remains.
Flow depth is regarded by Plapp and Mitchell (1960) to be
directly proportional to distance from source on horizontal slopes.
Johnson (1966) calculating flow depths for turbidites in the Madcap
area of the northwest Atlantic, gives flow decreases of 53 to 5.8 m
over 220 miles. He does, however, admit the problem of lateral
spreading which increases the rate of depth decay. Kersey and Hsu
(1976) calculate flow depth downflow by acknowledging the role of slope and a friction loss factor and note that flows on horizontal
slopes exhibit uniform downflow thickness, little ambient mixing and
r 4 r
who notes that with increasing slope the rate of depth decay downflow
increases and that depth is directly related to the length of the
flow.
The distribution of grainsizes laterally and vertically in
turbidite beds can be related to flow parameters like velocity, rate
of density and depth decay. Grainsize has been related to slope (Rand
and Emery, 1964; Conolly and Ewing, 1967), distance along flow (Hand
and Emery, 1964; Conolly and Ewing, 1967; Middleton, 1967), bed
thickness (Scheidegger and Potter, 1965; Potter and Scheidegger, 1966)
and rate of current decay (Middleton, 1967; Banerjee, 1977). Hand and
Emery (1964) were able to demonstrate that grainsize decay was
exponential with distance in the San Diego trough, while Potter and
Scheidegger (1966) demonstrate in a semirquantitative model that bed
thickness and grainsize decay asymtotically from flow source. The
rate of the decay is demonstrated, to effect grain sorting
(Middleton, 1967; Banerjee, 1977) and bedform growth rates
(Kuenen, 1965, 1966; Middleton, 1967; Walker, 1969; Allen, 1970b).
Proposed mechanisms for grain transport in flows include movement
in high concentrations near the floor as traction carpets
(Kuenen, 1966; Middleton, 1967; Walker, 1967; Price, 1977; Elmore et
al. 1979) and suspension through turbulence (Bagnold, 1962;
Kuenen, 1965; McCave and Swift, 1976; Banerjee, 1977; Hesse and
Chough, 1980; Stow and Bowen, 1980). The presence of clay and silt
fines affects the settling velocities of larger grains and increases
their transport potential (Kuenen, 1965; Pett and Walker, 1971; Kuenen
r 5 I
aided by a process called 'autosuspension' (Bagnold, 1962), although
this idea has been criticized by Middleton (1966a) for being based on
dubious assumptions and Luthi (1980) as a mathematical inequality.
Theoretical models combined with size and scaling in experimental
models provide only limited information on flow depth, velocity,
density and grainsize decay in turbidites. The extrapolation of their
results to natural occuring flows may be problematic.
The recording of modern turbidity currents in nature is difficult
and is often confined to information gained from submarinercable
breaks in the very recent past. The most famous example is the 'Grand
Banks' turbidity current which was generated by an earthquake off the
Newfoundland coast in 1929. The resultant turbidity current flowed
for 300 miles onto the Sohm Abyssal Plain at velocities up to 70 km
per hour with a volume of 100 km3 (Heezen and Ewing, 1952; Kuenen,
1952; Heezen, Ericson and Ewing, 1954; Menard, 1964). Further studies
of submarine cable breaks by turbidity currents of lesser orders of
magnitude have been documented from the Balaearic Abyssal Plain after
the 1954 Orleansville earthquake (Heezen and Ewing, 1955), off the
Congo and Magdalena rivers and in the Western New Britain Trench
(summary by Heezen and Holister, 1971). Small scale turbidity
currents have been documented from lakes (Lambert et al., 1976, Lake
Wallensee, Switzerland; Normark and Dickson, 1976, Lake Superior,
Canada). Both marine and lake studies indicate downflow exponential
decay of velocity, but little or no information on grainsize or
r 6 r
If this detail is lacking in recorded flows, then an examination
of the detailed structures and grainsize of individual turbidites in
modern marine sediments may provide clues to rates of current decay.
Correlation of single turbidites in geologically recent sediments in
modern deep marine basins has met varying degrees of success. ['Grand
Banks' turbidity current for 300 miles, Newfoundland (Heezen and
Ewing, 1952); 55 km, Tyrrhenian Abyssal Plain Mediterranean (Ryan et.
al., 1965); 65 km, Madcap area, E. Atlantic (Belderson and Laughton,
1965); 100 km, Puerto Rico Trench (Conolly and Ewing, 1967); 350
miles, Gulf of Mexico (Davies, 1968); rebounding currents after 10 km,
MidrAtlantic (van Andel and Komar, 1969); 25r30 km, Columbus Basin,
Bahamas (Bornhold and Pilkey, 1971); 33 km, Western Albora.n .Sea,
Mediterranean (Bartolini et al., 1972); 55 km, Wilkes Abyssal Plain,
Antarctica (Payne et al., 1972); 30 km, HispaniolarCaicos Basin,
Caribbean (Bennetts and Pilkey, 1976); 35 km, Navidad Basin, Caribbean
(Sieglie et al., 1976); 500 km, Hatteras Abyssal Plain, Atlantic
(Elmore et al., 1979); 40 km, Exuma Sound, Bahamas (Crevello and
Schlager, 1980).] With the exception of the works by Bennetts and
Pilkey (1976) and Elmore et al. (1979) the preceeding studies have
largely dealt with grainsize, long:distance correlation and the
description of complete beds as tonguershaped or lobate forms. This
limited application of turbidite beds and the lack of detailed data
produces problems in relating bedform, grainsize and bed thickness to
the parent turbidity current. Only Bennetts and Pilkey (1976) have
completed more detailed studies on grainsize, compositional changes
and the variation of Bouma units in three turbidities in the
r 7 ir
Shell' turbidite (Hatteras abyssal plain) only identifies an axial AE
unit, and lateral and distal 'more complete' Bouma units with
corresponding vertical and lateral changes in grainsize (Elmore et
al., 1979).
If detail is lacking from recent deeprsea sediments then the
vertical and lateral decline of structures within marker turbidities
in ancient sequences may provide some of the anslrers to the
evolutionary' characteristics of turbidity currents during flow and
sediment deposition. The earliest attempt at correlation of single
beds within rock sequences was carried out by Carozzi (1957) in the
Swiss Alps. Nine turbidites containing shelfrderived material were
correlated up to 40 km in a sequence of black pelagic limestones of
Upper Jurassic age. The study was one of bed correlation down a
palaeoslope and grainsize variation both vertically and laterally
within the beds.
More detailed studies of individual beds over greater distances
have been carried out in the Cloridorme Formation, Gaspe Peninsula,
Canada (Enos, 1969; Parkash, 1970; Parkash and Middleton, 1970;
Skipper and Middleton, 1975); the Bavarian Alps (Hesse, 1974); the
Pyrennes, Spain (Rupke, 1976; Johns et al., 1981); the Otadai
Formation, Boso Peninsula, Japan (Hirayama and Nikajima, 1977) and the
Apennines, Italy (Ricci Lucchi and Pialli, 1973; Parea and Ricci
r 8 r
Detailed work carried out in the Cloridorme Formation provided
information on the rate of downcurrent change of basal structures,
internal current meandering and grain orientations in beds correlated
up to 12 km downflow. In the Otadai Formation, Japan, turbidite
correlation over 60 km has yielded additional information on the rate
of vertical and lateral downflow decay of Bouma units. From the
Pyrenees, Rupke (1976) recorded current interrfingering, pulsing,
ponding of fine sediment, and changes of current direction for
individual turbidites correlated up to 16 km. Johns et
al.
(1981)recorded from the same formation a megarturbidite (up to 43 m thick)
overlying a thick, massive conglomerate which is a minimum of 75 km
long and 12 km wide. However, information is only provided on lateral
and vertical grainsize variation with overall bed shape.
Lateral continuity of single beds in the rock record over greater
distances is more difficult to prove. Hesse (1974) described the
correlation of 55 beds over 115 km in the Bavarian Alps but lack of
outcroprcontinuity and tectonic complications has raised doubts over
the validity of the correlation. In the Italian Apennines relatively
simple structural evolution and the presence of a large megaTturbidite
timermarker (the 'Contessa bed') emplaced in a sequence of thinner
deeprsea fan and basinrplain deposits has allowed detailed correlation
of individual beds over 120T150 km (Ricci Lucchi and Pialli, 1973;
Parea and Ricci Lucchi, 1975; Ricci Lucchi and Valmori, 1980). Work
carried out on individual layers has produced data on overall bed
shapes, grainsize variations, current reworking and ponding of
t 9 t
The detailed examination GI- Bouma unit internal structures for
several single turbidites over long distances is required to give some
guidance as to the likely values of the many unknown variables in
theoretical models. The detail required is unavailable from modern
deeprsea studies as demonstrated in the above review but the
occurrence of a basin wide sequence of turbidites in the Marnoso
Arenacea Formation in Italy correlated over 130 km lends an
r 10 r
Chapter Two
The Marnoso-Arenacea formation: Geological setting
The problem is to determine the variables involved in turbidity
currents during flow and sediment deposition. To this purpose four
turbidites from the MarnosorArenacea (M,A) formation in northern Italy
were studied.
The geologic history of the northern Apennine and the MrA
formation has been reviewed by Ricci Lucchi
(1975,a; 1975,b; 1978, 1981) and is therefore only summarized here.
The MrA occurs in the northeastern Apennine (Periadriatic)
mountains of Italy and represents the outer and younger parts of the
Apenninic chain (fig. 2.1). The northern Apennines consist of
tectonically superposed or juxtaposed units which are dominantly
nappes or allochthonous sheets i.e. units of rock moved varying
distances from their place of formation by tectonic processes. They
consist of 'alpine' or 'apenninic' units where the former (called
'Ligurian units') are largely early Jurassic oceanic rocks which were
transported towards Europe during an alpine orogenic phase
(CretaceousrEocene) and then south during a later apennine phase in
the postrearly Miocene (Sestini, 1970; Boccaletti, Elter and
Guazzone, 1971). The allochthonous apennine units are represented by
locally derived flysch of turbidite formations and form the
tectorstratigraphic units known as the Macigno, Modino and Cervarola
formations. Unfolding and replacement of the apenninic allochthonous
fig. 2.1
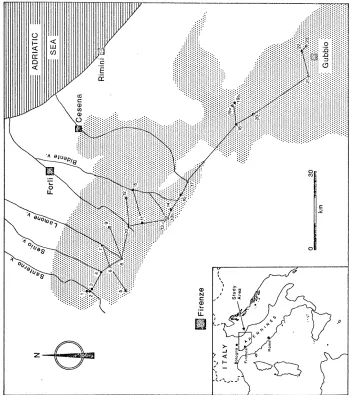
Aerial extent of the Marnoso-Arenacea formation and Contessabed location points (after Ricci Lucchi and Valmori, 1980).
r 11 r
basins were a series of parallel, northwestrsouthwest trending basins
that have been moved up to 120 km eastwards.
Not all apenninic units are allochthonous for the outer ones
(including the MrA) which form the Adriatic side of the chain are
considered autochthonous, though some slippage over Triassic
evaporites has occurred. The autochthonous units called
'Periadriatic' or 'UmbrianrMarchean units' are marine sediments
(Liassic to middle Miocene) which have undergone deformation but not
12
ILI
Lu
0
0
STAGE ZONE SUBZONE BLOW ZONE
Messinian Globorotalia tumida
plesioturnida
N 18
N 17
Tortonian Globorotalla
mertardie
'
Globorotalia miocenica
Si. N 16
Globorotalia ventriosa I
Globigerina nepenthes ..._ N IS
N 14
Serravallian Orbaltna s.l.
Globigerinoides obliquus '
Globoquadrina altispira /
Globorotalia miozea N 13 — N 12
Orbulina suturalis N II -- N 9
Langhian Globigerinoides
trilobus
Praeorbulina gloinerosa
s.l. N 8
Globigerinoides bisphericus
N 7
Globoquadrina dehiscens
Aquitanian Globigerinita dissimilis
Globigerinoides altiaperturus I
Gbr. trilobus I.s. N 6 — N 5
Globigerinoides primordius N 4
[image:20.426.63.389.128.399.2]* GIs% lenguaensis
'7
Paccala
& =TYRRHENIAN
. S E A
'9A
S /
Ns
o 50Km
“111/111111—=
410
ROME
17)
,
I-, A
*-+-
/
Bologna
ADRIATIC
SEA
F)A.y),
A N
ace
nza
BASIN
PO PLAIN
1,
[image:21.426.55.385.43.352.2]..a ...
'1% 10 ItAli(
C . ...Z ,, (7
Florence
O
4-
s 13
During the middlerlate Miocene the periadriatic area consisted of
two main palaeogeographic depositional areas, the 'Inner basin' and
the foredeep (fig. 2.2). The Inner basin was the largest basin in
the area and was active from Langhianrearly Tortonian time
(Table 2.1), and extended for nearly 400 km from Piacenza in the north
to Perugia in the south. Basin width was a maximum 60 km and the
orientation of the central axis was northwestrsoutheast. Like many
apenninic basins it was elongated parallel to the present tectonic
axes with its eastern margin merging with the foredeep and the
northwestern and southeastern margins being defined by active
transverse, tectonic faults (fig. 2.2). The southeastern fault
defined the northwestern edge of a carbonate platform (the 'Abruzzi
platform', figs. 2.4a; 2.4b) which during the middle Miocene separated
the MrA basin from the larger Laga basin to the south. The basin
margin to the west is buried by overthrust ModinorCervaola units
except for one area around Madonna del Fiumi (fig. 2.1, loc. 5).
During the middle Miocene the basin divided into two along a major
transverse tectonic line (the 'Sillaro line', fig. 2.2) with the
northern part becoming infilled by Ligurian units and the south
gradually uplifted. Other transverse faults cut the basin at
irregular intervals to produce a stepped northwest to southeast
palaeoslope.
The foredeep lay to the northeast of the inner basin and
comprised a northern narrow trough and in the southeast, a series of
complex,parallel minor basins (fig. 2.2). Both the inner basin and
w
;
A 4X
0 0 00 0 0 00
a
wl AfLiks6mig
O
2
I— 2
0 17,
A I
OW
IN
ti
Inn nog n
1110
SAN
T
[image:23.426.11.415.13.581.2]ERNO
fig. 2.3
Correlation of the Contessa, D.21, D.38 and D.41 turbidites,Periadriatic Apennines, Italy. Note the decrease in numbers of sandy turbidites to the southeast (adapted from Ricci Lucchi and
ROMA
GNA
4in //
oian
Am
nil
filTi
i
g
0
r 14 r
basins at the African continental margin or on a separate
ItalorDynaric microplate.
Uplift and faulting has left the M7A relatively undeformed in
gently dipping fault blocks. At boundary faults the beds are steeply
upturned.
Sediment supply was primarily from the northwest with minor but
significant intrarbasin sources from the, southeast and other basin
margins. The northwestern source was situated along the alpine chain
(testified by fragments of mediumrhigh grade metamorphic schist and
gneiss, serpentinorschist and dolomite) while the minor southern
source supplied carbonaterrich material containing granitic
fragments. Other minor sources included recycled intrarbasin
sediments and early Ligurian units (Cipriani and
Malesani, 1963; Gandolfi, Paganelli and Zufa, 1981). Volumetrically
the minor sources supplied only 2r3% of the total sediment input but
this in often single, spectacular events (e.g. the Contessa bed).
Sedimentation rates were high in the Inner basin (average
15r45 cm/1000 yr; max. 75 cm/1000 yr) with the foredeep only
achieving 3r5 cm/1000 years. The four turbidites studied comprised
the middle Serravallian 'Contessa bed' (type exposure: the Contessa
road section, Gubbio, close to the basin entry point of the turbidite;
Ricci Lucchi and Pialli, 1973; Parea and Ricci Lucchi, 1975) and the
turbidites D.21, D.38 and 8,41 (fig. 2.3). (The letter 'D' denotes a
position above the Contessa bed, the 'position figure', the number of
beds above.) The immense size, high calcium carbonate content and the
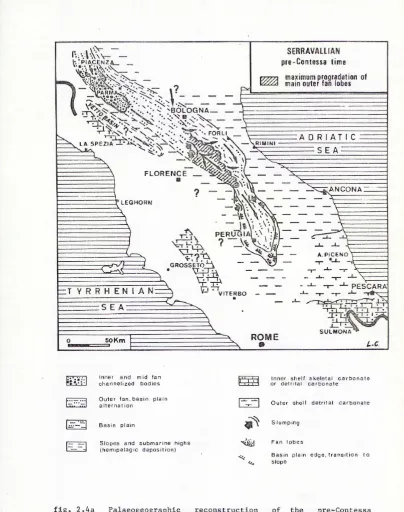
SERRAVALLIAN pre-Contessa time
mi
maximum progradation of main outer fan lobesT* r ,- .1t147..% FOR LI LA SPEZIA —•-•" •
'•
FLORENCE
?
It
T. PERUMIA
k‘e
?-:
rA
__ 444%
GROSSETO
A
'77 VITERBO
• SEA ROME
•
ADRIATIC RIMINI ANCONAA . PiCE NO —ir
""" • PESCARA
1. nr nr
;_
SULMONA
L.0
D 50 Km
essomr=
•
==T YRRHEN1AN
SEA
LEGHORN
Inner shelf skeletal carbonate or detrital carbonate
Outer shell detrital carbonate
Slumping
-4411
Fan lobesBasin plain edge. transition to
44.
SlopeInner and mid fan channelized bodies
Outer fan. basin plain alternation
L-.11 Basin plain
[image:25.426.4.408.14.526.2]Slopes and submarine highs (hemipelagic deposition)
fig. 2.4a Palaeogeographic reconstruction of the pre-Contessa
-1.- •1.". SEA 177 1.C. ROME • SULMONA
50 K M 111M1ININII=1
cQ
—
TVRRHENIAN
SERRAVA al A N
post - Contessa time
im
maximum progradation of main outer fan lobescalcareous turbidites:
terrigenous admixture (Contessa type )
no terrigenous fraction (Abruzzi shelf type)
PLI&ENZA—
'PARMA
? -
BOLOGNA—
c7
--
FORLI
\ RIMINI
FLORENCE
■
ADRIATIC SEA
LA SPEZIA
**44t\i—
ANCONA
ZiEGNORN
i_471\
?14
V1 :TA
OROSSETO.r
•
PERU G
It
;7
V 1.
A. PICE
• NO
• VITERBO •
\\ •
1 -1- 1 -7- PE SCA RA..r • .
r 15 t
Contessa bed an ideal lithological time plane with which to correlate
rock sequences. The immense size of the Contessa deposit smoothed out
many basinrbottom irregularities so investigation of the beds
immediately above Contessa proved more desirable to beds below which
were probably influenced by unknown bottom irregularities.
Middle Serravallian palaeogeographical reconstruction for the
inner basin can be split into two subrunits, the pre-Contessa and the
postrContessa.
Sub-surface drilling in the Po plain indicates in prerContessa
time the presence of a northwesterly derived deep-sea fan complex near
Piacenza which is succeeded southwards by fanrfringe and basin plain
deposits (fig. 2.4a). South of Bologna, the outcrops of the MrA
indicate another northwesterly derived fanrcomplex succeeded to the
south of the Marecchia area by a smooth basin plain. The incoming of
the Contessa flow marked the end of the maximum progradation of the
deeprsea fans across the basin plains.
PostrContessa times are marked by a temporal decrease in the
northwesterly supply of sediment, increased subsidence and the
recession of the southern fanrcomplex to increase the size of the
southern basin plain (fig. 2.4b). During the Serravallian the uniform
lateral thicknesses of basinrplain turbidites suggests a near
horizontal slope but on the oversupplied deeprsea fams the beds
indicate slopes up to 1r3°. Absolute depths for the basin plain based
on plankton/benthos ratios (in the hemipelagites), ichnofacies
indicate depths of 1500-1750 m (Ricci Lucchi, 1978; 1981).
Deep-sea fan, fan-fringe and basin-plain facies have been
described from this area by Mutti and Ricci Lucchi (1972; 1975) and
Ricci Lucchi (1975a) and a brief summary is expressed here.
In the exposed southern fan-complex a distinction between inner
and middle fan is not applicable to the M-A. Evidence for apical fan
valleys with great depths, steep sides and very coarse chaotic fills
is lacking, while on the mid-fan it is unclear if the preserved
channels are distal extensions of single fan valleys or a channel
distributary network. Inter-channel areas are represented by thin,
parallel sided muds and sands.
The outer fan is represented by mud-rich interbeds and sandy,
narrow elongated lobes which are attached to mid-fan channel termini.
Finally the basin plain is represented by thick developments of
hemipelagite and silt, mudstone (Bourne CDE and DE turbidites which are
laterally continuous and parallel sided) with bioturbation of the beds
common.
Mantling all the facies are basin-wide, extensive, individual
turbidites. It is into this latter category the Contessa, the D.21,
D.38 and D.41 beds fall, their basin-wide extent and size making them
t 17 t
Chapter Three
Description of the Contessa bed
Plate 3.1 The Contessa bed at Galeata (loc. 15). Note the large size and couplet of resistant sandstone (Bouma B,C) and the dark grey Bouma D siltstone.
3.1 Introduction
The Contessa bed (Plate 3.1) is a mega*turbidite of exceptional
volume in a sequence of thinner basin plain and fan fringe deposits
(figs. 2.3, 3.1). With an estimated volume of 35 km3 (Ricci Lucchi,
18
of 25-30 km. Both the most proximal and distal sub-regions of the
turbidite are lost due to burial by later allochthonous Ligurian
units.
The term 'bed' is used for a lithological unit comprising a
sandstone and siltstone/mudstone couplet. Within this couplet not all
Bouma units may be represented due, to either non-deposition, or later
erosion.
The term 'laminae' is used for units which are sometimes greater
than the normal limit of 1 cm (McKee and Weir, 1953). This is because
they are considered to be minor events in the deposition of the whole
turbidite.
'Proximal' and 'distal' are qualitative terms referring to
distance along beds from the direction of flow origin (as presently
exposed).
The term 'heisipelagite' refers to a calcium carbonate and
organic-rich (pteropods and foraminifera) rock with low mica content
and extensive bioturbation (Ricci Lucchi, 1975a). It is considered to
have been derived from the oceanic 'rainfall' of organic tests and
sediment reworking by bottom ocean currents. In the typical tubidite
sequence this makes up the inter-turbidite pelagic unit.
As discussed in Chapter. Two the surface of the basin floor is
assumed to be near horizontal in the basin plain, and 1-30 on the
t 19 t
Though the number of data points in the basin is small a
consideration of several data sets allows the development of a
3tdimensional beds-form plot if basin, bed and flow symmetry is
assumed.
3.2 The Bouma A unit
Occurring in the southeast of the basin the 'A' unit has a
maximum thickness of 102 cm at its extreme southeastern limit
(fig. 3.2a). Decreasing in thickness both laterally and downflow (to
the northwest) it produces a semi-coned shaped body that disappears
after 40 km. The unit is normal-graded from a coarse grained sand at
the base to a coarse-medium grained sand at the top. Occasional
scattered grains near the base have maximum longtaxis lengths (a-axis)
of 3 mm.
3.3 The Bouma B unit
The 'B' unit achieves its maximum thickness where it overlies the
Bouma A unit in the southeast (fig. 3.2b). Here a rapid decrease in
thickness occurs laterally and downflow where the unit thickness
decreases from 640 cm to 434 cm after 40 km. A semi..cone shape
FORLI
fa FIRENZE
. '•
--- o
, •• Isopachs in cm
0 30
ammarame---sammica
km
II FORLI
•
1211 FIRENZE
Isopachs in metres
0 30
km
fig. 3.2 a) Unit thickness, extent and sample points for the Bourns A unit.
E 20 V
A more gentle decrease in unit thickness from 300 cm to 143 cm
occurs along the rest of the basin to the northwest. Maximum
sedimentation occurs at the basin margins (300+ cm) with the central
axial 'low' containing 143300 cm of sediment.
Intratunit sedimentary structures are primarily laterally
continuous planet parallel laminae. These were picked out by the
weathering of laminae with small grainsize differences. Laminae
thickness varies within the range 275 cm at the base of proximal
exposures and 1-.2 mm in the distal and upper parts of units.
In proximal Contessa at Assino Creek (fig. 3.1; loc. 21) in the
top of the unit are bands of laminated coarsemedium grained and
medium grained sand (Plate 3.2). Repeated couplets consist of poorly
laminated, coarsetmedium grained sand with unit sizes ranging between
12429 cm which are interspaced with 8-29 cm of well laminated medium
grained sand. Four cycles were recorded with the contacts between
t 21 t
Plate 3.2 Repetitions of poorly laminated, coarse*medium grained sand
with well laminated medium grained sand in the upper Bouma B unit,
Assino Creek (loc. 21).
In more distal locations 'wavy laminae' overlain by normal
planetparallel lamination was discovered at irregular heights in the
Bouma B units. Laminae overlying planetparallel laminae appeared to
'pinch and swell' to produce horizontally aligned, symmetrical,
sinusoidal ripple forms that quickly becamee buried again by
planetparallel laminae (Plate 3.3). Grainsize in the ripple forms is
restricted to medium, medium fine grained sediment in the upper half
of the unit. Crest to trough amplitudes for individual laminae never
exceed 2 cm and cresttcrest wavelengths 29 cm. Crest line orientation
is transverse to the inferred dirdction of flow. Unit thickness for
N
OForli
g
Firenze
g : groove marks
0 30
km
fig. 3.3
Palaeocurrent directions inferred from flute casts. (Singlet 22 t
irregular heights at several exposures. Their occurrence at irregular
heights in exposures of variable quality make inter-exposure
correlation of specific horizons impossible.
Plate 3.3 Sinusoidal ripple laminae in Bouma B plane-parallel
lamination at Coniole, Saterno valley (loc. 1).
3.4 Sole markings
Flute casts indicating a southeast to northwest flow dominate the
basal structures (fig. 3.3). In the proximal and central parts a
deviation of the flute directions around the mean may reflect some
eddying effects in the base of the current. The number of flutes
varies erratically from very few to overcrowded abundance with no
clear pattern emerging except for a general decrease in numbers in the
final distal 20 cm (Table 3.1). Here the bed is dominated by flat,
B 23 k
Location distance (km) Total number of
number [SEt>N14) flute mark observations
23 2 10+
21 8 Flat base
20 33.2 8
19(a) 38.8 10+
18 43.2 7
17 68.8 4
15 84 8
13 85.6 Flat base
12 88.6 10
11 92.4 6
10 95.6 3
9 100.8 1
7 108 1
6 108 4
4 116.4 3
3 123.6 9
2 124 1
1 128 1
t 24 t
Flute types consist of asymmetric and symmetric, simple
parabolic, symmetric spindle7shaped and asymmetric corkscrew and
twisted forms (Allen, 1971a; fig. 3.4; Plate 3.4).
(a)
..., ,Lyt
Wove-like x
Axis of princlpol furrow Crest
(b) Parabolic (broad) -;.--
Lateral Median ' ridge .." ridge
_ x
Lz (c)Parabolic (narrow)
.-... i
\ .... , I / i (di Spindle-shaped 7:- I '2'. ' (e) Cornet-shaped 1 t ...". .,..,'..,
(t) Polygonal (syrnrn.)
...)., ...-.. X } ...Z (g) ..., ..‹.: ...'
- .."...'.0.1
Simple
, ...e.
W1 Corkscrew
z
(Ii Twisted (j)
r Polygonal (asyrnm.)
.
fig. 3.4 Schematic types of flute form in profile and plan (from Allen, 1971a).
Measurement of flute parameters (length, depth, width) indicate a
poorly defined trend of large, broad, deep flutes to smaller,
shallower, narrow ones (fig. 3.5). Correlation coefficient (r) values
range between -.0.61 to ..'0.46 are significant at the 10% level (see
r = -0.46
n = 10
r = - 0.48
= SE
to NW
•
r =-0.61
= 8
Distance down basin km 130
too oi
Distance down basin km 130
E
U
ym
Mean
flu
te
leng
t
h
Distance down basin 130
10
•
t 25 t
correlation coefficients). Small parasitic flutes extending in
echelon downcurrent from large leading flutes are common (Plate 3.4).
Plate 3.4 Asymmetric, parabolic flute with secondary parasitic flutes, proximal Contessa (Gubbio; loc. 22). Note the concentration of coarse sand grains in the base of the flute.
Loading into the underlying mudstone by flute heads is common
with vertically rising mud-*flames detectable between flute in areas
1- 26 t
Within the basal zones of many flutes concentrations .of coarse
sand grains could be found, especially in the upcurrent heads
(Plate 3.4).
Other bottom structures are rare in Contessa and when found
comprised poorly exposed groove-casts or excavated, sedimentrfilled
worm burrows. The groove casts discovered at Tredozio
(fig. 3.1, loc. 9) are wide, shallow structures (310 mm
deep x 4',30 mm wide) of indeterminate length (20+ cm). These
generally parallel and post*date the flute marks. The small,
excavated worm burrows found at the same locality consist of short,
cylindrical (2t'4 mm dia. x 2.5+ cm length) pipes of fine sediment,
concentrated in local clusters and aligned parallel or transverse to
the inferred direction of flow (an alignment of minimum resistance to
the flow).
3.5 Inclusions
In both proximal and distal areas -riirrup clasts' of siltstone,
mudstone or hemipelagite are found.
Proximally at Assino Creek (fig. 3.1, loc. 21) the clasts are
large (up to 1.7 m dia.), sub,-spheroidal and found in the Bouma A or
?7
Plate 3.5 Large, sub—spheriodal mudstone, siltstone and hemipelagite 'ripTup clasts' in the base of Contessa, Assino Creek (loc. 21).
In more distal areas the clasts occur in the Bouma B units,
frequently some centimetres above the base (Plate 3.6). Typical forms
are platelike with the longeaxis parallel to the flow direction and
the a-b plane parallel of the plane of the plane parallel laminae in
z
••• •
• • • •• 0
(0
4-
• • •
w • •
• ••
O O
wo co6uoi
O Dis tanc e a lo ng E C O O D is tanc e a long ba s in E O
O 0 0 0
wo yldoo 446Ua1 14 0 00 00,H O
0
0
O
W3 I-11P!M
[image:44.425.51.393.47.551.2]0 E _v Dis tance a long bas in 0) Co 0 4- • •• 0 O a long bas in a, R
Tza
r
The change from large, sub—spheroidal to flat, platelike
inclusions from proximal to distal environs can be demonstrated by the
analysis of the clast parameters (width, length, thickness;
fig. 3.5). It is noticed the size parameters decay in a log•linear
mode with significant correlation coefficient values of -,0.55 to
TO.76.
I 29 t
3.6 The Bouma C Unit
'C' units are defined by the presence of ripple (Bouma, 1962) or
dune cross stratification (Allen, 1970a). Simons (et. al., 1961)
define the term 'ripple' as a small scale bed roughness of 2/7 cm
amplitude. Dunes are similar structures with amplitudes exceeding
7 cm. Bouma C units within the Contessa bed are typified by the
t- 30
Bouma D
Upper sinusoidal lamination
Trough crossbedding
at ...ad/2r
Climbing ripple lamination
Lower sinusoidal lamination
Bouma C
Bouma B
fig.
3.6
Composite cross stratification sequence developed in Contessa Bouma C units.The base of the units is marked by a 'pinch and swell' thickening
of the uppermost Bouma B laminae (similar to the sinusoidal 'wavy
laminae' described in
3.3).
These develop into the troughs and crests of sinusoidal ripples which grow vertically and become asymmetric inthe direction of current flow (Plate 3.7). Preservation of the stoss
•
- StITQSTJa
--• • h.. ,0! - - 31 -
8-180). Amplitude (crest to trough height) increases downflow (SE->N4,)
from 1-2 cm to 9 cm; along with ripple length and wavelength
(fig.3.9). Downflow increase in flat areas of sand between ripples
results in crest to crest wavelengths gradually exceeding ripple
lengths (base of stoss measured horizontally to base of lee slope)
hinting at particular grainsize starvation in the flow. All the
correlation coefficients are significant at the 5%, 10% levels.
- 32 -
The middle Bouma C units contain trough or climbing ripple
cross-stratification, occasionally together. Climbing ripple
cross-stratification (ripple drift) for most locations is poorly
developed or absent, but if present comprises the 'type B' ripple
drift of Jopling and Walker (1968). Plate 3.7 indicates a sequence of
ripple drift where stoss and lee slopes are preserved (slope angles:
stoss 2.6o; lee up to 80). The angle of climb was 210 with the
amplitude for individual ripples (2 cm) remaining constant with ripple
climb. Ripple crests climb from the crests of underlying sinusoidal
ripples, the wavelength between two climbing sets being 50-55 cm,
similar to the underlying sinusoidal ripple wavelength.
The more common development for the middle of Bourns C units is
cross-lamination. Here the sets of laminae are bounded at the base by
curved erosion surfaces (McKee and Weir, 1953; Allen, 1953).
Preservation of lee faces is the norm with average vertical heights of
5-10 cm and face angles of 180 or lees. Sometimes inclined laminae
became oversteepened and slumped. These were then covered by stable,
lower angle laminae representing a return to more stable bedforms.
In the top and upper parts of the Bouma C units there is a return
to sinusoidal ripple formation. This is in finer-grained sediment
than that composing the lower ripples (fine and very fine grained sand
compared to medium, coarse-grained sand), though form and growth
patterns remain similar. Upper sinusoidal ripple parameters are
closely comparable to those of the lower series; amplitude increases
33
decreases (55 to 20 cm) [fig. 3.8]. Again both stoss and lee faces
were preserved with face angles of stoss 6-8° and lee 8-16°.
Quarrying exposed large surface areas of upper sinusoidal ripples to
reveal long, slightly sinuous asymmetrical forms (Plate 3.8).
Plate 3.8 Large expanse of slightly sinuous, asymmetric upper
Ripp
le
leng
th
E
SE NW
10
Distance down basin km 130
•
Distance down basin km
100
E
=
10
r: 0.4s
- 14
Distance' down basin km 130
10
Ripp
le
he
ig
ht
NW SE
r, 0.55
• • n = 2t
200 360
Distance down basin (after reversal) km
r = -0 38
• 11= 21
•• 100
E
100
S
a a
10
•
200 360
Distance down basin (at ter reversal) km
•
• •
r = 0 29 n=n
200 Distance down basin laf ter reversal) km aso
•
10
fig. 3.8
Basin midline plots for ripple length, height and wavelength1- 34 1
On the backs of these ripples are found small scale microTripples
(Plate 3.9). These consist of laterally discontinuous ripples of
1T2 mm amplitude and wavelengths of 1T2 cm. The direction of flow
indicated by these structures is parallel to that indicated by the
larger upper sinusoidal ripples.
- 35 -
Analysis of ripple palaeo-current directions reveals that for
lower and middle unit forms the flow was from southeast to northwest
(fig. 3.9). These would have been influenced by the topography
inherited from the deposition of the Bouma B unit and from this we can
see that middle unit ripples consistently show an anti-clockwise
deviation away from the direction of the lower series, that is off the
sediment high of the basin margin (fig. 3.9 (the opposite direction to
Coriolis force]). In the upper series of sinusoidal ripples the flow
is from the northwest to the southeast, 1800 to the direction derived
from the flutes and lower ripples (fig. 3.10). In the northwest of
the basin the complete Bouma C units show reversal while progressively
to the southeast the reversal horizon is found higher in the Roomer C
unit until in the most proximal Contessa only the very top of the C
• 21,4 2
2R L
1\
II Firenze
1 base 01 Bouma C
2 , middle Bouma C
0 30
km
Forli
O
Forli
e. .. .. ...
Firenze
Isopachs in metres
0 30
km
fig. 3.9 a) Palaeocurrent directions derived from lower and middle
Bouma C ripple cross-stratification. Arrows indicate mean
directions.
b) Bouma A,B unit total thickness isopachs (Reflect structure
Fonu
%,1
0
FIRENZEFORLI
/3 FIRENZE
•
Isopachs in metres
30
km =ail r
I Mean foreset direction
30 km
fig. 3.10 a) Palaeocurrent directions derived from upper Bouma C sinusoidal ripples. Arrows indicate mean direction.
Bouma A.8
Reversal _______________
Bouea C
t 36 t
NW SE
120 100 60 0.0
Distance down basin (km)
fig. 3.11 Plot of the reversal horizon in Contessa. Distances are measured from the southeast, the direction of derivation for lower Contessa.
(w
)
es
eq
e
noq
s
tq
t 5(
eH
10
5
- 37 -
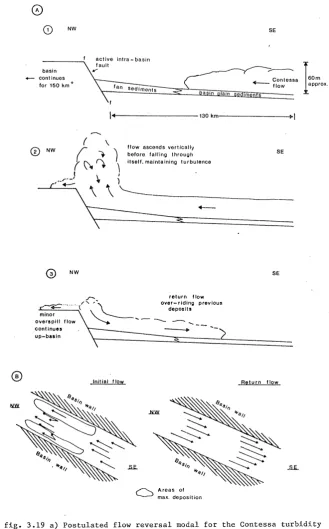
During deposition the upper sinusoidal ripples would have been
influenced by sediment deposited during the formation of the
Bouma A,B,C units (fig. 3.10). This reveals the formation of a
'basin' structure with sediment highs at the basin margins and in the
southeast with a complementary central 'low' area running along the
axis of the basin.
The reversal horizon itself is represented by a blocky, poorly
laminated horizon of some 10-15 cm thick. It is parallel sided and at
Lamoli (fig. 3.1; loc. 18) [proximal region] it contains many plant
fragments including a pine cone (Plate 3.11). The unit is overlain by
t
Plate 3.10 Fossil pine cone (dark object,centre of picture) in the reversal horizon of Contessa at Lamoli (loc. 18). This and other plant fragments may represent deposition from a 'still stand' before burial by the return flow (see end of chapter discussion). [The structure, running vertically down from top right is a function of drilling.]
[For grainsize 'break' across the reversal horizon, see section
-39 -
The preservation of stoss and lee slopes of ripples and their
development of asymmetry with climb can be used to deduce some idea of
the rate of sediment deposition. With known experimental hydrological
conditions for the transition from upper-plane bed to ripples we need
only to know angle of climb, sediment size and ripple height to
calculate the rate of deposition represented by the ripples
(Allen, 1971c). Deposition rate is calculated by:
3
R
—K tan
e
ci,
4.
2 (3.1)H
-
where R* is the rate of deposition (gm cm 2 s-1), E)the angle of
climb, d* the sediment diameter (mm), H the ripple height and K a
bed-load efficiency factor (calculated by Allen to be approximately
51). The results obtained for Contessa are:
R*
At 33.2 km (base) 0.051 mm 1.2 cm 15 1.31 x 10⁻¹
At 60 km (base) 0.051 2.0 15 7.8 x 10⁻²
At 128 km (base) 0.025 4.0 15 1.35 x 10⁻²
At 232 km (top) 0.015 1.25 22 3.02 x 10⁻²
At 288 km (top) 0.0075 1.8 22 7.43 x 10⁻³
At 314 km (top) 0.015 3.2 22 1.18 x 10⁻²
Table 3.2 'top' Houma C unit figures are after a reversal
90 -
The figures indicate a decrease in sedimentation rate from
southeast to northwest which is continued after reversal from
northwest to southeast. The figure for 314 km is high because the
reversed current appears to rework previously deposited sediment.
With comparison to studies in the turbidites of the Aberystwyth Grits
(lower Silurian) and the Sandstone, Marl Group of the Old Red
Sandstone (Devonian) the rate of sedimentation (R*) is higher for
Contessa and indicates a higher rate of deceleration (Allen, 1971;
Table 3.3).
d (mm) H (cm) 0 R,
Aberystwyth grits 6.072-0.19 1.9-4.7 4-10 1.9-3.2x10⁻³
(Lower Silurian)
Sandstone, Marl Group 0.11-0.23 2.1-5.2 3-17 2.5-5.7x10⁻³
(Devonian, O.R.S.)
- 91
3.7 The Bound DE unit
Maximum Bourns DE sedimentation took place in the centre of the
basin where up to 12 m of sediment was deposited (fig. 3.12b). This
is in contrast to the sediment highs of the Bouma A,B,C units found in
the southeast and basin margins (fig. 3.12a). The Bouma D unit
comprises a heavily fractured, structureless siltstone grading
vertically to structureless mudstone (Bouma E). The boundary between
the two units is never clear and for measurement purposes the unit was
mapped as a Bouma DE unit. In the northwest the unit begins with a
. plane-parallel laminated fine sand which thins from 18 cm to 0 cm
after 30 km to the southwest (fig. 3.12b). Several horizons within
the sand unit show liquefaction and water escape structures with the
consequent destruction of the original plane-parallel lamination
(Plate 3.11). Slightly coarser-grained horizons show the liquefaction
structures while the bounding upper and lower finer grained layers
show planar tops and loaded, bulbous bases (Plate 3.11). Up to four
repetitions of liquefied layers could be detected in the sand unit at
FORLI
El
FIRENZElsopachs in metres
30
km
N
FORLI
‘••••:',xft
E3
FIRENZEExtent of / tine sand at
the base of Isopachs in metres
30
km
fig. 3.12 a) &puma A,B,C combined unit isopachs. The. basirrt7dike structure influences Bouma D sedimentation.
-'43
3.8 The Hemipelagic unit
The unit has very variable preservation due to erosion by later
turbidity currents except for in the extreme southeast of the basin
where up to 16 cm of sediment is found. The unit comprises a hard,
white carbonate overlying the grey Bouma D unit within which
individual foraminifera could be detected with the naked eye. Limited
work was carried out on this unit because of the variable
preservation.
3.9 Sediment analysis
Composition and grainsize analysis were carried out by the
techniques outlined in Appendix A.
Vertical grainsize analysis indicates a rapid decrease in
grainsize from the base of the bed to the reversal horizon
(fig. 3.13). A grainsize break occurs in the 'C' horizon followed by
a more gentle upwards decline in grainsize. The level of the break
occurs progressively lower in the Bouma C unit from southeast to
northwest until at 123.6 km it appears in the top of the Bouma B
unit. This decline of the break mirrors the evidence of the reversed
ripples and the plot of the structureless reversal horizon
(fig. 3.11). Vertical grainsize analysis also indicates that the bulk
SE NW
0 1 mm mm
33.2 km
mean grainsize ---- max. grainsize
123,6 km
He
ig
ht a
bov
e
bas
e
m
60 km
k 44 k
(fig. 3.13).
Orainsize
- 45 -
Lateral grainsize variation for individual Bouma units is
demonstrated in fig. 3.14 (Wentworth size classes). In the base of
Contessa (Bouma A,B units) a coarse-grained sand is found extending
from the southeast down the centre of the basin (fig. 3.14a). It is
flanked to the east along the basin margin by a finer coarse-medium
grained sand. This sand also flanks the coarse-grained sand to the
west in the extreme northwest of the basin. In the top of the Bouma B
unit (fig. 3.14b) the coarse-grained sand grades to a coarse-medium
grained sand extending northwestwards for 80-90 km before grading into
a medium-grained.sand. Both of these are bounded to the east by finer
grained medium-fine grained sand. The top of the Bouma C unit
(fig. 3.14c) shows a complex pattern of a southeastern medium-fine
grained sand succeeded to the northwest by a fine grained sand. A
fine grained sand also occurs in the northwest of the basin where
between it and the southeasterly fine sand occurs a central zone of
very fine grained sand. The Bouma D unit as previously described
begins with fine grained sand at the base in the northwest and grades
southeast to a siltstone and mudstone. For the whole basin the top of
the Bouma DE unit is a fine grained, dark grey mudstone.
Modal composition denotes that Contessa is a calc-arenite
(Parea & Ricci Lucchi, 1975) with angular, sub-angular and sub-rounded
mineral and lithic clasts. Intra-basin carbonate mud, silt and
0.
59
-0.
1
2 mm
0.
29-0.
21
mn
,
Conies. Position in unit % Coco,
% Component of
Plagioclase
total nos,
Carbonate Rock frogs. Qtr Orthoclase
of clots
carbonate Rock Rock frogs.
Rica Organics
8 km Boon A 31.20 28.12 10.13 7.40 9.85 28.40 1.57 19.45 (Ion, 21) Base El 47.20 41.67 12.12
7.58 11.36 15.91 1.52 9.84 Top C 46.40 32.84 14.92 9.70 8.21 14.18 2.24 17.91
D 64.40 19.10 5.62 2.24 0.0 0.0 7.87 65.17
(100 PM up)
33.2 km Base A 25.00 23.61 15.20 6.64 15.20 20.00 0.28 18.88 (loc. 20) Base C 37.40 30.98 21.41 7.68 7.68 11.50 1.59 11.16
Mid C 32.40 16.94 1.70 2.96 0.0 0.0 8.26 68.04
Mid D 56.00 25.00 0.0 2.27 0.0 0.0 9.09 63.64
Top 0 50.00 4.76 0,0 0.24 0.0 0.0 .7.10 87.90
68.8 km Base B 47.60 42.21 15.51 18.99 15.00 3.03 0.53 4.73 (Ion. 17) (10 cm up)
Top 0 36.60 30.59 9.16 9.15 15.14 5.36 0.32 30.28 Top C 78.80 22,29 6.02 8.54 2,04 0.0 6.51 54.60
Top 0 64.50 8.45 0.0 0.0 0.0 0.0 12.68 76.87
92.4 km (loc. 11)
Base B Top 6 33.00 39,60 30.21 36.41 15.52 13.91 17.31 13.91 10.45 13.91 12.54 11.26 0.59 0.66 5.30 7.94 Top C 39.20 16.45 2.63 3.95 2.63 0.0 7.24 67,10 Base 0 39.60 20.53 1.98 6.62 1.33 0.0 7.28 62.26
Top 0 46.40 2.99 0.0 0.75 0.9 0.0 7.46 88.80
108 km Top 13 44.56 39.73 14.45 15.40 5.61 6.32 3.65 14.84 (lee. B) (66 cm below)
Top 13 65.40 35.26 0.50 6.94 9.25 0.0 1.73 46.24
Base C 50.00 60.40 0.80 9.60 7.60 0.40 1.20 20.00
(10 cm up)
Top C 45.80 36.90 2.58 2.95 5.54 1.11 6.64 44.26 Base D 42.40 24,31 4.85 4.16 1.38 0.0 4.17 61.12 Base D 72.20 16.55 1.44 5.04 0.0 0.0 14.39 62.58 (4.0 cm up)
Top D 77.80 13.51 0.0 0.9 0.0 0.0 16.73 68.86
123.6 km Base El 25.20 51.87 14.44 9.09 3.74 14,14 5.90 0.54 (loc. 3) B (110 cm up) 65.60 53.63 6.99 16.33 5.63 4.39 1.00 10.04 Top 13 69.80 49.01 4.78 7.30 8.14 1.99 3.29 25.49
Base D 86.90 37.09 0.0 4.73 0.0 0.0 5.45 52.73
Top 8 88.10 15.18 0.0 1.3/ 0.0 0.0 7.06 74.45
Table 3.4 Modal rock analysis for Contessa bed (basin mid-line locations). The percentage of CaCo
t 46 t
Comparison with the composition of northwesterly derived
turbidites (Table 3.2; Chapter 4, Table 4.1) indicates that Contessa
is defined by a high calcium carbonate, higher orthoclase, low mica,
low non7carbonate rock fragment composition. In the northwest
occasional small garnets in the base of Contessa hint at contamination
by inclusion of northwesterly derived material (alpine metamorphic
source).
Downtbasin changes in composition for the base of Contessa
reflect the lateral degree of sorting in all the Bouma units
(fig. 3.15). Mica and to a lesser extent quartz increase while total
calcium carbonate, orthoclase and plagioclase remain constant or show
slight fluctuations. Carbonate rock fragments and organic remains
show definite decrease down-basin with the organics in the proximal
part being dominated by coarse7grained, broken shell or large
foraminifera remains and the distal dominated by smaller, more
complete foraminiferal tests. Non7carbonate rock fragments show an
increase in the northwest of the basin possibly due to contamination
by the erosion of northwesterly derived sediments.
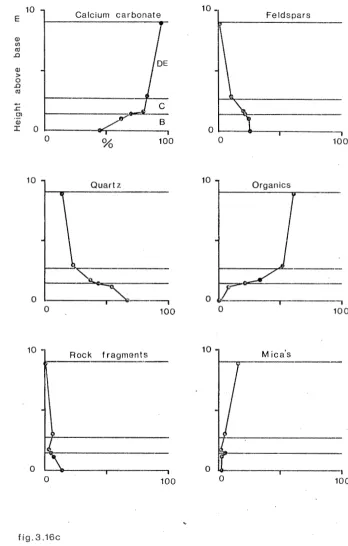
Mica, organic remains and total calcium carbonate at the
basintaxis exposures all show vertical increase with zeniths in the
top Bouma D unit (fig. 3.16a,b,c). Elements that decrease are
feldspars (especially after mid7'C), quartz (after Bouma B
sedimentation) and rock fragments. Carbonate rock fragments reach
their zenith in the upper Bouma B or Bouma C units while non..carbonate
--- --- g
SE NW
100
* quartz
---o'' calcium
carbonate
to
--- _
-• orthoclase
,•,
plagioclase
Distance down basin kin
1
100 130
---
non- carbonate rock fragments
o mica
Q.-I:A< carbonate ❑ * rock
fragments
R
--- -0'
--- organic remains
100
10
01
100 130
Distance down basin km
17 Calcium carbonate
DE 10
He
ig
ht
a
bo
v
e
base
m
100 B
0
17 Feldspar
10
100
17 Rock fragments Mica's
10
[image:72.425.53.377.35.552.2]0
f ig. 316b
100 100
16
10 16,-
10
Mica's Rock fragments
0 100 0 100
He
ig
ht
a
bov
e
E
16 Organics
10
Feldspar
16
Calcium carbonate
DE
C
100
16
0 _cc
o
He
ig
ht a
bov
e
E
10
0 0
Calcium carbonate
0/6 100 0 100
0 100
10 10
Quartz Organics
0 100
Rock fragments
[image:74.425.40.388.34.580.2]100