R E S E A R C H
Open Access
Cloud cover: monitoring large-scale clouds
with Varanus
Jonathan Stuart Ward
†and Adam Barker
*†Abstract
Cloud computing has quickly become the de facto means to deploy large scale systems in a robust and cost effective manner. Central to the maintenance of large scale systems is monitoring which allows for the detection of faults, errors and anomalies and the enacting of optimisation and corrective measures. Monitoring large scale systems is significant challenge requiring the low latency movement of large volumes of data and near real time analysis. This challenge is magnified by elasticity and other cloud properties which previous monitoring systems do not yet fully account for. In this paper we propose Varanus1a cloud aware monitoring tool that provides robust, fault tolerant monitoring at scale. We describe in detail the mechanisms which enable Varanus to function effectively and explore the performance of Varanus through a detailed evaluation.
Keywords: Cloud computing; Monitoring
Introduction
Monitoring is a fundamental part of designing and main-taining reliable and effective software systems. The data obtained from monitoring is invaluable allowing for the detection of error, misconfiguration and other interesting phenomena. As the Internet of Things, Big Data and per-vasive computing become increasingly relevant, data has never been more valuable. However, as the size and com-plexity of systems has increased so to has the difficulty in collecting monitoring state. Cloud computing is a tech-nology which underpins much of the so called data deluge and is an area where monitoring is a distinct challenge.
Prior to the advent of cloud computing, large scale sys-tems were accessible only to organisations with the great-est means. Since 2007, cloud computing has brought large scale systems to the masses. Organisations and even indi-viduals can now temporarily acquire significant compute and storage capacity via an elastic model for a fraction of the cost of a single physical server. Elasticity is the abil-ity of a deployment to change in scale and composition in accordance with demand and is what sets cloud comput-ing apart from grid, cluster and other earlier paradigms of distributed computing. The combination of elasticity
*Correspondence: adam.barker@st-andrews.ac.uk †Equal Contributors
School of Computer Science, University of St Andrews, St Andrews, UK
and scale poses a series of challenges to a number of area, including monitoring.
Cloud management is a research topic which has received considerable attention. Common topics include configuration and change management, cost forecasting and architectures for deploying services and workloads to cloud services. Monitoring, an integral part of manage-ment has however received notably less attention. Moni-toring cloud deployments is a challenge for a number of reasons. Scale necessitates that a monitoring tool must collect and analyse vast quantities of data in a timely man-ner, with minimum human intervention, while elasticity requires tolerance to all manner of change. Other areas of monitoring including failure detection, QoS and root cause analysis are also affected by elasticity.
Current monitoring tools fall into two broad categories: monitoring as a service tools which outsource data collec-tion and analysis to a third party and legacy grid, cluster and enterprise monitoring tools such as Nagios, Gan-glia and Cacti which have greater functionality but are ill suited to the requirements of cloud computing [1]. The former category of tool charge, typically, at a per host basis and can incur significant fiscal costs. Furthermore these tools transmit monitoring data across the Internet to the cloud provider, this potentially introduces secu-rity concerns and increases monitoring latency. The latter
category of tools are ill suited to cloud computing due as they lack awareness of cloud properties, as such they conflate termination with failure, are ill suited to han-dling elasticity and have no conception of the myriad of costs (both fiscal and performance related) associated with cloud computing.
Cloud computing has enabled even small organisations to deploy thousands of VMs, if only for short period of times. Prior to cloud computing this level of scale was unavailable to all but the largest organisations, as such the vast majority of legacy monitoring software is designed for smaller scale operations. As the scale of cloud deploy-ments continues to grow the availability of scalable mon-itoring tools which support the unique requirements of cloud computing are becoming necessary. Monitoring as a service tools are often touted as those tools, however these services lack the customisability of previous tools and lack any mechanisms to implement corrective or adaptive behaviours. Any tool which is designed to monitor large deployments of virtual machines must be autonomic. It cannot rely upon humans to process events or analyse data and implement manual alterations. Humans are sim-ply too slow to manually monitor anything resembling a large scale system. What is therefore required are tools which can collect and analyse monitoring data and decide if necessary to alter the state of the system. This is signif-icantly beyond the current state of cloud monitoring and thus requires new tooling.
The area of cloud monitoring remains relatively unex-plored and there is hitherto no universally accepted toolchain or systems for the purpose. Most real world cloud monitoring deployments are a patchwork of various data collection, analysis, reporting, automation and deci-sion making software. There are few universal best known practices or tools and many grid and cluster monitoring tools remain in common usage despite being a poor fit for cloud monitoring.
This paper presents a detailed overview and evaluation of Varanus [2–4], a highly scalable monitoring tool resis-tant to the effects of rapid elasticity. This tool breaks with many of the conventions of previous monitoring systems and leverages a multi-tier P2P architecture in order to achieve in situ monitoring without the need for dedicated monitoring infrastructure.
Prior work
Cloud monitoring is a relatively new area, however other types of monitoring have produced a vast array of tools and designs. Many of these tools have not been designed with cloud properties in mind and are potentially ill suited for cloud monitoring, irregardless these tools are fre-quently used and referred to within the domain of cloud monitoring.
Nagios
Nagios [5] is the premier open source monitoring tool. Ini-tially released in 1999, the venerable tool has a vast plugin library which supports virtually all common software, net-work devices and appliances. Nagios was never designed for cloud computing, as such it has no native support for tolerating elasticity and requires a significant deal of modification to better support cloud computing. Despite the domain mismatch, Nagios remains the most popular monitoring tool for two reasons: its extensive functional-ity and the lack of a suitable replacement. Recent cloud monitoring tools predominantly fall under the categori-sation of monitoring as a service tools which eschew the computational costs of data collection and analysis to a third party company. Users who wish to keep their moni-toring tools behind their firewall, or who demand greater functionality that is offered by monitoring as a service tools have little alternative to Nagios and its contempo-raries. As it is open source, widely used and is available for experimentation we therefore make use of Nagios to com-pare with Varanus throughout our evaluation described in detail in Section 8. Two versions of Nagios are evaluated alongside Varanus: a stock configuration and a modified installation which has a number of patches applied includ-ing the ‘large installation tweaks’. The Nagios architecture that we employ in our evaluation is depicted in Fig. 1. We employ a three tier Nagios hierarchy whereby the mas-ter is responsible for collating and analysing the results which are obtained from monitored hosts via a set of Nagios slaves. The slaves are intended to alleviate the burden of scheduling and communicating with individual VMs. Puppet is also used in order to seed newly joining VMs with the Nagios client and provide the configuration necessary to communicate with the Nagios master and additionally to restart the Nagios master in order add the new hosts.
Ganglia
Fig. 1The Nagios architecture used in our evaluation, assisted by Puppet
frontend. Ganglia is first and foremost a resource moni-tor and was designed to monimoni-tor HPC environments. As such it is designed to obtain low level metrics including CPU, memory, disk and IO. It was not designed to mon-itor applications or services and nor was it designed for highly dynamic environments.
Riemann
Riemann [7] is an event based distributed systems mon-itoring tool. Riemann does not focus on data collection, but rather on event submission and processing. Events are representations of arbitrary metrics which are gen-eratedq by clients and encoded using Google Protocol Buffers [8] and additionally contains various metadata (hostname, service name, time, ttl, etc). On receiving an event Riemann processes it through a stream. Users can write stream functions in a Clojure based DSL to operate on streams. Stream functions can handle events, merge streams, split streams and perform various other oper-ations. Through stream processing Riemann can check thresholds, detect anomalous behaviour, raise alerts and
perform other common monitoring use cases. Designed to handle thousands of events per second, Riemann is intended to operate at scale.
Amazon CloudWatch
CloudWatch [9] is the monitoring component of Amazon Web Services. CloudWatch primarily acts as a store for monitoring data, allowing EC2 instances and other AWS services to push state to it via an HTTP API. Using this data a user can view plots, trends, statistics and various other representations via the AWS management console. This information can then be used to create alarms which trigger user alerts or autoscale deployments. Monitor-ing state can also be pulled by third party applications for analysis or long term storage. Various tools including Nagios have support for obtaining CloudWatch metrics.
[image:3.595.59.542.86.448.2]presents a trade-off between full customisability and ease of use. The primary use case of CloudWatch is monitor-ing the full gamut of AWS services. Users of only EC2 will likely find the customisability of a full monitoring system preferable to the limited control afforded by CloudWatch.
Varanus overview
Varanus is comprised of four components: the coordi-nation service, the collection service, the storage service and the analysis service. The next four sections detail the design of these services. Figures 2 and 3 provide a high level overview of the interaction of the four ser-vices. These loosely coupled services cooperate in order to provide a full suite of monitoring functionality. The coor-dination service is the foundation upon which the other services operate, providing a means for the components to communicate and provides VM registration, configu-ration storage, decision making and agreement. The data collection service is comprised of a small daemon which operates on each monitored host which collects metrics and values and transmits them to the storage service. The storage service runs across elected (or specifically dedicated) VMs and provides a mechanism for the in memory storage and processing of large volumes of time-series data. The analysis service consumes data from the storage service in order to detect irregularities, failure, bottlenecks, plan optimisations and other user definable behaviour.
Varanus coordination service
The coordination service is a robust, highly available con-figuration store which additionally provides agreement, configuration storage and failure detection to the other components within Varanus. It is a self contained service with no external dependencies and is intended to continue operating even under high failure rates. Every VM within
a Varanus deployment runs a coordinator daemon, how-ever the role that each coordinator takes can vary from taking part in relevant agreements and detecting failure to storing configuration data, coordinating agreements and enforcing consistency.
When building distributed systems the challenge of configuring and coordinating components soon arises. In the typical case one looks to well tested frameworks and platforms upon which to build. Software such as Apache Zookeeper, etcd and Doozerd provides fault tol-erant mechanisms for service discovery, coordination and orchestration. The use of existing configuration and man-agement tools as a basis upon which to develop a moni-toring tool poses a number of issues. Firstly, such tools are commonly built upon large stacks which require a myriad of dependencies resulting in a footprint far beyond what is required. Ideally, in order to avoid a significant observer effect the components of a monitoring tool must be small and unobtrusive. Secondly, current coordination tools are intended to be used by multiple applications. Thus, the failure, loss of performance or other issues with a coordi-nation service would impact both critical applications and the monitoring service. Therefore, when the monitoring tool is most required, it is unavailable or degraded. We therefore eschew the use of third party coordination tools in favour of a dedicated out of band mechanism which is intended to tolerate a wide variety of failure modes in order to facilitate monitoring and maintain a small foot-print. For this purpose we look towards peer to peer overlay networks as a means to provide a highly robust basis for developing a monitoring solution.
Cloud computing is unlike classical peer to peer com-puting scenarios whereby there are a large number of geographically distributed peers, each with network con-ditions of variable performance. A typical large scale cloud deployment consists of a significant number of VMs
[image:4.595.57.540.544.719.2]Fig. 3The Orchestration of the four Varanus services
in a small number of geographical locations with each (in usual circumstances) possessing plentiful bandwidth within the localised cloudregionand reduced bandwidth between cloud regions. This scenario lends itself to the use of a structured peer to peer architecture which exploits localisation and the plentiful bandwidth within cloud
regions while conserving slower inter-cloud bandwidth. The Varanus coordination service is peer to peer over-lay network which attempts to exploit the architecture of clouds.
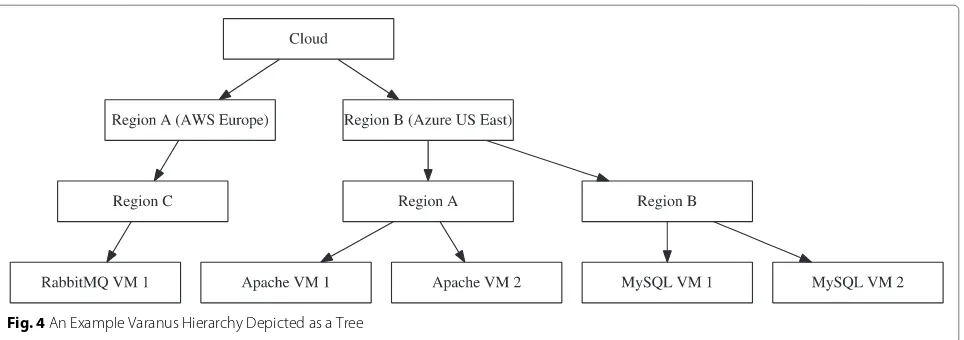
We describe the communication architecture employed by the coordination service in terms of three groupings: cloud,regionand sub-region. Cloud andregionmap neatly to the well established terminology, a cloud is a top level abstraction which includes multipleregionsand aregion
is a geographic area which hosts cloud resources. A sub-region is a further sub division of aregionwhich includes a subset of provisioned cloud resources this is similar to the notion of (availability) zones but may transcend or overlap actual zones.
These different levels of abstraction produce a three tier hierarchy. An example of this hierarchy is shown in Fig. 4 and a more detailed overview is provided by Fig. 5. The coordination service employs a gossip protocol over this
hierarchy in order to facilitate a range of functionality. The coordinator itself uses the protocol to disseminate configuration state, update membership and detect fail-ure meanwhile the other service uses this mechanism to exchange state.
Communication
The coordination service makes use of a gossip protocol. In the context of cloud monitoring, gossip protocols have several advantages, including:
• Minimising CPU usage in favour of utilising network capacity. This is advantageous in a cloud computing setting where internal bandwidth is free where as CPU is a metered resources.
• Tolerating network outages, membership change and failure with minimum overhead.
• Providing heartbeat and primitive failure detection at no extra message of computation cost.
Therefore, a gossip protocol serves as the communi-cation mechanism for the coordinator and for the other Varanus services.
[image:5.595.59.541.85.407.2]Fig. 4An Example Varanus Hierarchy Depicted as a Tree
constraints. By distributing the computational complex-ity of an operation over the system, gossip protocols offer a means to develop mechanisms better suited to large scale systems. Gossip protocols have been demon-strated to be effective mechanisms for providing robust and scalable services for distributed systems including information dissemination [10], aggregation [11] and fail-ure detection [12]. The coordination services uses a gossip protocol to propagate updates to the configuration store, update membership and detect failure. In addition to the gossip protocol, the coordinator also makes use of the Raft protocol in order to achieve consensus when necessary.
The basic operation of the coordination gossip proto-col consists of the periodic, pairwise propagation of state between coordinator instances. This mechanism under-pins the data collection and agreement protocols which support monitoring functions. Each monitoring agent participates in a gossip based overlay network. Using this overlay monitoring agents propagate and receive state from other, nearby, agents. This is achieved by performing a pull-push operation with neighbouring correspondents. The rate of dissemination of data from a single process
to all other processes can be described by the following equation:
St+1=Tinterval×Fanout×
StXt
n (1)
where S is the number of susceptible processes (those
which have not yet received the information), X is the number of infected processes (those which have received the information), n is the number of processes andt is the current timestep. Therefore, the delay in propagat-ing information can be greatly reduced by decreaspropagat-ing the interval at which communication occurs (thus increas-ing the frequency) and by increasincreas-ing the fanout value (thus increasing the number of correspondents selected as targets).
In addition to this mechanism, preferential target selec-tion is used to reduce the delay in propagating state. Targets are selected based on a weighting scheme which uses round-trip time estimates in order to select targets which are topologically closer. Each round of gossip is spa-tially weighted according to the scheme proposed in [13], using RTT as a distance metric in order to propagate
[image:6.595.59.541.85.255.2] [image:6.595.59.540.568.720.2]updates to all VMs within distancedwithinO(log2d)time steps.
This scheme results in increased memory usage and constant background communication but achieves rapid state propagation and resilience to churn and failure.
In order to best exploit the topology of IaaS clouds different behaviours occur at each level of the gossip hier-archy. The rationale for this hierarchy is rooted in the differences between intra and inter cloud communication. Within IaaS environments there are high bandwidth, low latency and unmetered network connections. This is true of virtually all cloud providers. It is also true of any private cloud with a public network between cloud regions. This environment lends itself to the use of an unreliable proto-col for rapid and near constant state propagation. Between cloud regions this is not as feasible, costs arising from latency and bandwidth metering force communication to be performed in a slower, more reliable fashion.
This gossip protocol, is applied at every level of the hierarchy. What differs between each level is the informa-tion which is communicated and the frequency at which communication occurs.
1. Intra Group: communication between monitoring agents within the same sub-region. This occurs at a near constant rate. Each time an event occurs in the coordinator or other Varanus service the coordinator propagates the new state to its group. At this level of granularity, the full state stored by the monitoring agent is propagated to its neighbours.
2. Inter-Group: communication between monitoring agents in differentsub-regions within the same region. This occurs at a frequent but non constant rate. Periodically state is propagated to external groups according to a shifting interval. At this level, only aggregated values and a small subset of local contacts and foreign contacts are propagated. 3. Inter-Region: communication between coordinator
processes in different different cloudregions or datacenters. This occurs proportionally to the inter-group rate. At this level aggregate values for the entire region and subsets of the local and foreign contacts are propagated between regions.
Some concrete examples of this communication hierar-chy include:
• Configuration store lookup data. A full set of lookup data is sent to hosts within the local sub-region, the location of top level VMs are sent tosub-regions within the same region and only the location of the root VM is propagated between regions.
• Monitoring data collected by the collection service. Raw data is sent to storage service instances in the same sub-region, aggregates values of thesub-regions
resource are sent to neighbouringregions and aggregates of the entireregion are sent to other regions.
• Membership information. Full membership information is propagated within a sub-region. Betweenregions a subset of hosts in that sub-region are propagated and betweenregions a small sub-section of hosts in theregion are propagated.
Consensus
In addition to the gossip protocol, the coordination ser-vices makes use of a separate protocol for enforcing con-sensus. This protocol is less frequently used than the gossip protocol due to its additional complexity and over-head. In the coordination service it is used for leader election, consistent commits and the other services rely upon it for a range of functions. The Varanus consensus protocol is based on the Raft consensus algorithm [14]. Raft is used as it is comparable to Paxos in terms of perfor-mance, but it more modern and is designed to be easier to understand and debug in addition to having a wide range of implementations. Raft uses a replicated state machine approach to consensus similar to Paxos but is intended to be simpler to understand and to implement. In order to agree upon a single value, Raft employ a leader to enforce consensus. The process of committing a value using Raft is as follows:
1. A leader is elected from the pool of candidates. 2. The leader continuously broadcasts heartbeats to
followers. Follower use a 200–500 millisecond heartbeat timeout which varies based on acknowledgement time.
3. Followers respond to the heartbeat with an acknowledgement.
4. A client submits a value to the leader.
5. The leader attaches the value to the heartbeat and waits for acknowledgements.
6. Once the majority of VMs have accepted the value the leader commits the value.
7. The leader then appends a notification to the heartbeat to notify all followers of the agreed upon value.
Should followers fail to receive a heartbeat it will become a candidate, nominate itself and broadcast a solic-itation for votes to all other VMs. Should a network partition occur, the leader of the partition with the largest portion of VMs will be able to commit. Other partitions will not. After the partition ends, values are reconciled to return all VMs to a consistent state.
messages. Batches of commits and acknowledgements can be compacted into single messages which reduces the complexity cost of performing frequent commits. Despite this, a single commit requires several rounds of gossip to complete and as such is avoided in favour of plain gossip wherever possible.
sub-regionassignment
sub-regions are groups of related VMs within the same geographic cloud region. Related is qualified by a num-ber of factors including the software the VM is running, the network distance and latency between VMs and the behaviour of the VM.
sub-region assignment is done according to a dis-tributed, weighted, k-nearest neighbour algorithm. Upon instantiation the collection service daemon running on each VM compute a feature vector which describes all available properties including installed software, resource usage, logical location and user provided metadata. This vector is then pushed to the coordination service. A default weighting is given in favour of installed software and logical location (location in terms of cloudregionand in terms of network distance). This weighting is given as the software the VM is running is the most likely factor in determining the purpose and general behaviour of the VM and location has the greatest influence on the cost of communication. This scheme therefore preferentially groups VMs running similar software which have few net-work hops between them. The feature vector describes the following, in order of importance:
1. Location. The location of the virtual machine down to the smallest unit. The exact nomenclature is cloud dependant but in general terms, this will correspond to a data center, availability zone, region or other abstraction.
2. Primary software deployed in the VM. Software that the VM was deployed in order to provide, including but not limited to web servers, databases, in memory caches, distributed computation tools and so forth. 3. Seed information. Information provided to the VM
at boot time including but not limited to the id of the stakeholder who instantiated the VM, hostnames and addresses of common resources and user provided annotations.
4. Secondary software, other than monitoring tools. Software which supports the primary application or otherwise adds additional functionality.
The coordination service computes an aggregated fea-ture vector for each preexisting sub-region describing properties common to all VMs within that sub-region. Newly instantiated VMs fetch all relevant group’s aggre-gate feature vector from the coordination service and
perform a k-nearest neighbour to assign the VM to a
sub-regions. Should the distance between the VM and existing sub-groups exceed an acceptable value or should nosub-regionsexist, the VM will form a new sub-region. Periodically the coordination service recomputes the fea-ture vector for each sub-regionto ensure it best reflects its membership. Should a the individual feature vector of a VM differ significantly from its sub-region aggre-gate it will perform a comparison against other relevant
sub-regions. After a delay, if no satisfactorysub-regioncan
be found, he VM will depart its sub-region to form a
new sub-region. If asub-regionremains underpopulated, when compared to othersub-regions, its members will dis-band and join the othersub-regions. After a repeat of this process, VMs will cease forming new sub-regionsfor an exponentially increasing length of time in order to pre-vent an infinite cycle occurring. This grouping scheme attempts to group related, nearby VMs based upon the assumption that monitoring state is most valuable to VMs similar to that from which the state is collected. Varanus, which is based upon this scheme, is therefore primarily concerned with the distribution of monitoring state to other VMs and places delivering state to human users as a secondary concern. This is pursuant to Varanus being
an autonomic monitoring framewo sub-region rk and is
motivated by the ability of software to make effective use of large quantities of near real time monitoring state (as opposed to humans’ lesser capacity).
Membership
Keeping track of membership of a large scale system requires significant message rates. A number of schemes have been proposed in peer-to-peer literature [15–18] which provide mechanisms for disseminating and main-taining membership state at each peer. Varanus, however, aims to be unobtrusive and have limited effect upon mon-itored VMs. As such, the coordination service makes no effort to maintain a consistent global view, or anything approaching a global view. Rather, the coordination ser-vice local to eachsub-regiontasks itself with tracking full
membership of thatsub-region and maintains two
addi-tional member sets storing minimal membership state of sub-regionsbelonging to the local region and remote
regions respectively. These sets are referred to as local contacts and remote contacts.
This scheme provides a means for the coordination ser-vice to locate related VMs quickly, only requiring them to consult their own state store. Meanwhile, should the need arise to communicate with monitoring agents in other
sub-regions, lookup can be achieved in constant time via
the local and remote sub-region contacts. This scheme
Newly joining VMs register their membership by gos-siping with the coordination service in that sub-region. This in turn will eventually announce that VMs presence to othersub-regions.
Role assignment
Each VM runs a coordinator instance, however not all instances perform the same functions. Coordinator instances within asub-regioncan be assigned one of three roles:
1. The leader is responsible for committing values to the mutable configuration store and ensuring its consistency. Similarly the leader enforces agreement amongst its sub-region. It also serves as the broker for events and holds a portion of the configuration store. It is elected using the consensus mechanism. 2. Failovers are participants which serve as hot standbys
should the leader fail or elect to stand down. 3. Participants store portions of the configuration store
and take part in agreement.
4. Reserves receive event notifications and other message and are able to become participants but take no active role in the coordination service until they do.
The leader is assigned using the standard agreement mechanism from the pool of participants. The election considers load average as the worthwhile value, the ini-tially elected VM is the VM with the lowest load average. Participants also nominate themselves based upon load averages. If a VM is heavily loaded it can opt to become a reserve and take on no additional work that could affect its performance. If the leader or a participant encounters a sustained period of load it can opt to become a reserve. In this case all Varanus services other than the collec-tion service must migrate their state to alternative hosts (unless already done so). If all available hosts are acting are reserves, Varanus cannot operate correctly. In this situa-tion Varanus require addisitua-tional dedicated VMs in order to provide monitoring functionality.
Regions and clouds also have leaders.regionleaders are
nominated from a pool of sub-region leaders and cloud
leaders are nominated from a pool ofregionleaders. This allows configuration storage, agreement and other func-tions to be performed acrosssub-regionsis necessary. The
mechanisms which govern howregionand cloud leaders
operate is the same assub-regionleaders.
Configuration store
While Varanus attempts to be autonomic, providing mon-itoring services with as little human interaction as neces-sary, it still has a need for configuration data. Archetypal
design advises the use of configuration files that use a standard format such as XML, YAML, .cfg or .ini. This design requires either a human or a program to write the file and raises a number of potential issues regarding file versioning and consistency. While this design can be suc-cessfully used (we employ this design in the collection service in order to integrate existing software) it is best to avoid it entirely and employ a design which lends itself to programatic (and thus autonomic) configuration. This is the role of the configuration store.
This portion of the coordination service lends itself to direct comparison with Zookeeper, etcd and other ser-vices. Unlike these other tools the Varanus coordination service is fully decentralised and designed specifically to support a single set of services. This allows the configura-tion store to be vastly simpler than other general purpose services and potentially more robust.
The configuration store is comprised of several individ-ual stores. Each level of the communication hierarchy has its own configuration store. There is:
1. A cloud wide store which stores values relevant to every VM in the cloud.
2. Aregion wide store which stores values relevant to every VM in the region.
3. Asub-region wide store which stores values relevant to every VM in the sub-region.
Each store is managed by the leader of the respec-tive level in the hierarchy. Leaders pass commits down the hierarchy until the value is committed to partici-pants within a sub-region. Thus, a value committed to the cloud store will be replicated in every sub-region, a value committed to the region will replicated in sub-regionsbelonging to thatregionand thesub-regionstore has no replication beyond that sub-region.
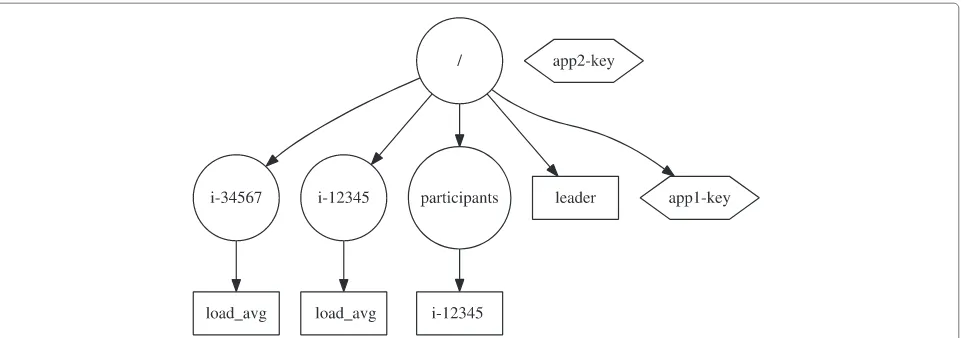
Fig. 6The filesystem like structure of the configuration store. Circles denote directory nodes, rectangles denote data nodes and hexagons denote immutable data nodes. In this case the root directory node has not yet been associated with the “app2-key” node, preventing it being found via traversal
Consistency is the motivation behind the dichotomy between mutable and immutable data nodes. As the immutable nodes do not support modifying existing val-ues there is no need to employ any complex consistency protocol to ensure that all copies of that value are kept consistent. Adding immutable nodes to the store can be performed by any participant (where as mutable values can only be committed via the leader) and can make use the the previously described gossip protocol to quickly disseminate state to other participants. The mutable data nodes and directories meanwhile, allow deletion and allow values to be updated and to avoid inconsistent configura-tion requires the use of an consistency protocol. For muta-ble values the store makes use of the Raft based consensus mechanism. As per all consistency algorithms, RAFT is significantly slower than the Varanus gossip algorithm.
Immutable nodes can be created without modifying directory nodes. If this is done, the list of children pro-vided by the parent will not include the immutable node. This is acceptable if the immutable node’s key is known, otherwise this is problematic as clients will be unable to locate the node. This can be rectified by updating the directory node which, while more costly than creating the immutable node, is less costly than creating a muta-ble node. Updates to the directory node can be done in batches to allow numerous immutable nodes to be created before the directory is updated in a single operation.
Both the mutable and immutable nodes use the same strategy for determining replica placement. Replication is orientated aroundsub-regions. Three factors are used in determining replication locations:
1. Load average, highly loaded hosts are avoided while underloaded hosts are preferred
2. Uptime. All VMs are eventually terminated and often termination occurs in batches. It is therefore
advantageous to distribute keys over hosts which have a range of up times so as to potentially avoid all replicas being terminated simultaneously.
3. Previous keys. So to avoid a overly skewed distribution of keys the number of current keys stored by each host is considered and hosts with fewer keys are preferred as replicas.
Priority is given to load average, pursuant in the goal of Varanus being unobtrusive. The coordination service will attempt to identify K replicas (where K is a user defined value stored by the configuration service, defaulting to 3) within a sub-region which are uniformly distributed throughout the range of up times which have not been overloaded and have fewer than half of the keys assigned to the most significant replica. If the coordination service cannot find K replicas which satisfy these criteria it will relax the need for a uniform distribution and accept repli-cas with more than half the number of keys that the most significant replica stores. If it still cannot satisfy those requirements it will relax them further, until a suitable arrangement can be found.
Each coordinator maintains a lookup table for values within each store. Each participant within a sub-region
[image:10.595.59.540.86.255.2]The configuration store is intended to store small (less than 4KB) items. The store is intended to store config-uration strings and data necessary for the coordination service to function. Larger data sets, such as full moni-toring data is committed to the storage service which is optimised for the storage of greater volumes of time series information. The information that the configuration store is intended to store includes:
• 15 minutely load averages for members. This is used for leader elections and for replicas.
• Configuration strings, for example the key-value pair: "n_replicas=3".
• The location of the leader and participants
Failure detection
Failure detection is provided by a gossip based Phi Accrual algorithm [19], using a similar scheme to Apache Cas-sandra. Heartbeats are propagated between coordinator processes via a gossip protocol at a regular interval. Rather than providing a boolean failed/alive value, the phi accrual failure detectors provides, a value signifying the
like-lihood that a given VM has failed. is derived from a
sliding window of heartbeat intervals. The failure detec-tor calculates the mean, median and variance within the window and builds the resultant exponential distribution which is used to compute. This differs from the original Phi Accrual design which used the normal distribution as the exponential distribution better tolerates the variable latency of the gossip stream. This algorithm is beneficial for cloud environments whereby there is often consid-erable variance in network performance. If the network performance degrades the resulting averages and variance will increase resulting in a longer period than previously
for the value of to rise. When the of a given VM
exceeds the a predefined threshold that VM is considered to have failed by the detecting VM. The detecting VM first checks using the cloud provider’s API if the failed VM has been terminated, if it has indeed been terminated it announces this to other VMs and no further action is taken. If, however, the VM is still declared as running by the cloud provider then the detection VM initiates a round of consensus in order to agree upon the failure. If con-sensus is reached, the VM is declared failed and action can be taken to mitigate that failure. If agreement can-not be reached it is therefore the case that some VMs are not receiving heartbeats while others are. This indi-cates the presence of some form of network partition or other Byzantine failure. One of the strengths of the RAFT consensus algorithm is the inbuilt ability to detect net-work partitions and still operate in spite of them. Thus, if a round of agreement is initiated and there is indeed a network partition, so long as their is a majority of VM in one partition, the VMs that can still communicate with
each other can still reach consensus regarding the fail-ure. The default action for failed VM (including VM that are divided by partition) is to terminate them and replace them with correctly functioning VMs.
For optimum failure detection, every VM should sub-scribe to the heartbeats of every other VM and calculate the appropriatevalue. This is ill advised for a number of reasons: firstly it would result in significant computation at each VIM and secondly would require heartbeats to be propagate across cloud regions. Heartbeats, are instead propagated according to the previously described gossip hierarchy. The full set of heartbeats are propagated within sub-regions, a subset are propagated within regions and a smaller subset between regions. It is subsections, not aggregates that are transmitted at higher levels of the hier-archy as aggregates would be of little value and would not be appropriate for the Phi Accrual algorithm. Subsec-tions are still, however, propagated at a decreasing rate as accorded by the hierarchy. The Phi Accrual algorithm per-fectly tolerates slow but constant heartbeats and as such is unaffected by a slowed rate of propagation at higher levels of the hierarchy. The size of the subset that is propagated between sub-regions and regions is dependant upon pre-defined configuration. Propagating heartbeats between sub-regions doesn’t particularly aid in failure detection, as gossip messages are propagated faster within sub-regions inevitably failure will be detected there first. What prop-agated gossip messages does achieve, however is deter-mining if a network partition has occurred between layers of the hierarchy. Unlike in the case of failure detection with a sub-region, terminating VMs is unlikely to resolve this issues but detection can allow alternative action to be taken.
Events
Fig. 7The Varanus event format
with regards to computation and analysis in section 1. Events are distributed over the existing coordination ser-vice infrastructure and therefore serve as a lightweight loosely coupled message service, they are used by the anal-ysis service to encode intermediate computation and by other services to notify components of configuration and status changes.
Varanus collection service
Monitoring fundamentally entails the observation of behaviours which occur within a system. Most data collec-tion tools, the Varanus colleccollec-tion service included, consist of a small daemon which regularly collects state and trans-mits it to a remote host for storage and processing. What differs about the Varanus collection service is its ability to perform on the fly reconfiguration and alter what data is obtained and the frequency and granularity at which it is captured.
A single VM has no shortage of values and behaviours which can be monitored. In the typical use case inter-est focuses around a limited number of values, these are primarily performance factors (cpu, memory, trans-actions, requests etc), application behaviours (error rates,
logs, status codes etc) and user behaviour (click through rates, time per page etc). There are additional sources of potentially valuable monitoring data which vastly out-number the typically collected data. Virtually all changes in memory or on disk and all network activity can be valu-able. Be it for diagnostic purposes, intrusion detection or another more specific motivation. Capturing the full range of potential metrics is, however, all but impossible. The computation required to collect all possible metrics would outstrip all other applications and much of the data may be of no practical use for a given use case. Therefore best practice is to collect a subset of the possible metrics which are most appropriate to the monitoring system’s use cases. A monitoring system has a wide range of use cases and the importance of a given use case may change dependant upon the state of the system. For example if a system is suf-fering from widespread failure which is preventing user’s accessing a service, diagnostic metrics increase in impor-tance while use metrics decrease. Situations may also arise where it is advantageous to have data collected at a shorter interval or at a different level of precision. It is therefore important to provide a flexible mechanism to collect mon-itoring state that befits the current set of use cases. The Varanus collection service aims to be such a mechanism. The collection service considers three types of monitoring data that can be obtained:
• Metrics, numeric values typically representing performance
• Logs, debugging data, service codes and other textual data which describes events or behaviours
[image:12.595.56.293.88.416.2]a myriad of shell and Perl scripts which are difficult to maintain and autonomically deploy.
From the vast pool of potential tools, the Varanus lection service uses collectd, a well established data col-lection daemon with an extensive plugin library, to obtain data from the OS and applications. collectd is an ideal basis for building a more complex data collection tool as it has a small footprint (in terms of resource usage and its size on disk), has a wide range of plugins, an active devel-opment community and a simple, well designed architec-ture. The design of collectd is orientated entirely around plugins. The core of collectd does very little, its primary function it to invoke plugins which obtain data and then to invoke plugins which stores or transmits that data. Exactly which plugins are invoked, what data is collected and where it is transmitted is determined by a configu-ration file. This limits the effectiveness of collectd as an autonomic tool and necessitates a human or an external service provide this configuration. In large deployments it is common place to use Chef, Puppet, Salt or an alter-native automation tool to install and configure collectd instances. For deploying and managing a monitoring tool, it is undesirable to have external dependencies as it is most desirable to ensure that the monitoring tool continues to function despite the failure of external services. It is for this reason that the collection service manages the con-figuration of collectd with no dependency other than the Varanus coordination service.
The collection service consists of two components: a collectd instance and a configuration generator. Addition-ally collectd uses a bespoke plugin which allows collectd to communicate data to the storage service. Collectd uses a unicast protocol to communicate directly with the appro-priate storage service instance. The architecture of the collection service is depicted in Fig. 8.
The configuration generator is intended to solve two problems: generating the initial configuration for collectd which is appropriate for the software and services oper-ated by the VM and secondly updating configuration to alter data collection as requirements change. In order to initially generate the necessary configuration for collectd, the config generator pulls down the set list of metrics and rate of collection from the configuration store. The configuration generator then outputs the necessary con-figuration in the collectd format and begins the collection process. The coordinator instance running on the VM passes any relevant events, such as updates to collectd configuration to the configuration generator. This allows Varanus to alter the rate of collection and change what metrics are collected.
The storage service
The industry standard tool for storing time series data is RRDTool [20], a circular buffer based database library.
A typical RRDTool deployment will have a small num-ber of variables stored per RRD database file. As a central responsibility of Varanus is the storage of time series mon-itoring data one might initially consider the use of rrdtool. There are however a number of limitations which reduce the applicability of rrdtool to Varanus and its intended use cases.
• When used as a backend for a monitoring tool an update to an rrdtool database typically occurs when fresh data is collected. An update involves multiple disk reads and writes to the header and archives within the database and if consolidation occurs there are additional reads and writes. As the number of databases increases and as the delay between updates decreases the IO load increases. This load is tolerable for hundreds of rrdtool databases however as this number increases to thousands, IO load becomes problematic. Users of medium to large scale systems report2 3that IO load can result in rrdtool falling behind on writes, resulting in the database failing to represent recent monitoring data. This has lead to the development of various caching solutions which feed data to rrdtool, a Java reimplementation of rrdtool and a range of strategies to optimise rrdtool to reduce IO load.
• rrdtool does not allow updates with a timestamp earlier than the most recent updated. In a monitoring tool such as Ganglia where there is a hierarchical structure that provides an ordered stream of time series data this is not a major limitation. In alternative schemes where monitoring data is replicated between multiple locations or where data is collected
according to a best effort mechanism this can be a significant issue. If, for example, network latency resulted in the out of order delivery of monitoring data those older values would be discarded. This limitation also prevents historical data from being imported, unless it is done so prior to other updates.
Fig. 8The collection service. The configuration generator obtains a list of metrics and frequencies from the Varanus configuration store and generates the resulting collectd configuration. Collectd is then started and obtains state via its plugins and pushes state to the Varanus storage service through the use of a bespoke network plugin. Should a use case require additional metrics or an alternative frequency of collection then an event can be dispatched via the coordination service which will in turn be passed to the configuration generator which will update the Collectd configuration as appropriate
redundant "UNKNOWNS" will be stored in the database.
• rrdtool is first and foremost a storage format, it is not intended to support in memory process of monitoring data. All processing of monitoring data (such as threshold or trend analysis) must be done prior to or after data is committed to disk. The use case rrdstool is optimised for is graphing and it does this extremely well. Modern monitoring use cases however go beyond simple graphing and necessitate a much wider range of processing, this requires greater support for in memory storage than what stock rrdtool provides.
There are a number of plugins, patches and mitiga-tion strategies that can make rrdtool more appropriate for cloud monitoring. While the concept of a fixed sized circular buffer database is an ideal format for storing time series data elements of the design of rrdtool, (espe-cially the concept of a fixed update schedule and a heavy reliance upon IO) are a poor foundation for a scalable,
elastic monitoring tool. We therefore propose an alter-native circular buffer based storage mechanism which replicates a subsection of rrdtool functionally while mak-ing design decisions that make it more appropriate to cloud monitoring.
BufferTable
BufferTable is the Varanus storage system. BufferTable is a distributed hash table which associates a source id and metric id with a family of circular buffers. BufferTable is intended to store metrics and status codes/log/event data. As such the buffer that the family maps to varies with the format of the data.
[image:14.595.66.539.86.418.2]which the coordination service uses to determine the role each coordinator plays.
BufferTable instances (like all of Varanus) are orien-tated aroundsub-regions. BufferTable instances distribute buffer families over the VMs within a sub-region in order to store more data than a single host can accommodate. Participants are designated as BufferTable hosts if they are not fully loaded and have less than 75 % memory usage. Preference is given to hosts which have the least load and memory usage. BufferTable instances report their location via the configuration service’s configuration store. A ded-icated directory in the configuration store provides the locations of the BufferTable instances responsible for all collected data. The source id and metric id are used to order the directory structure. This provides the means for collectors to identify where to push state to and from where the analysis service consumes state. Collection ser-vice instances are assigned BufferTable instances to push state to on a least loaded basis.
BufferTable is indexed by a source id which contains the IP address or fully qualified domain name of the host that the metric pertains to and a metric id which identifies metric (e.g. CPUPercent, MemFree, MariaDB-Transactions etc). This facilitates constant time lookup for obtaining all metrics associated with a given host, all metrics associated with a given id and a single metric iden-tified by a source id, metric id pair. The BufferTable does not store single circular buffers, but rather buffer families. A buffer family is a collection of circular buffers which store time series data for a single variable. The variable can either be in the form of a floating point value or a string. The former is used for performance data, resource usage and statistics while the latter is use for representing service check results, logs, events and other non numeric data. In both cases the buffer family consists of a series of buffers appropriate to that data type. The first buffer within the family is the receiving buffer, which stores metrics as they are received from monitored hosts. Sub-sequent buffers in the family are aggregate buffers, these buffers store aggregated metrics representing the value over a given time period. Each aggregate buffer stores data for a given interval with each additional buffer storing aggregate for a greater time period than the previous. The user can provide intervals, via the configuration service, for aggregate buffers on a per metric basis or provide a sin-gle default set of intervals. A typical scheme might be as follows, the receiving buffer followed by aggregate buffers with a 60 s, 5 min, 10 min, 30 min and hour long periods. Values are aggregated from one buffer to another when either a buffer is full or when by a scheduled task running which runs at the frequency of the subsequent buffer. In the eventuality that a buffer has reached its capacity but the time range of data within that buffer does not extend to the interval of the subsequent buffer an interim buffer is
created with an intermediate interval. This interim buffer persists until data can be directly aggregated from one buffer to the next.
In the case of the floating point buffer family aggrega-tion is quite simple. Floating point metrics can be using a mean, median, modal, max, min, last, first or by a user defined method. In the case of string data, aggregation is far less simple and require a user defined method. User defined methods for both types of data are provided by Quince actors, described in the analysis section. The motivation for providing a method to aggregate string data is in order to preserve relevant logs, events and other textual data, which may have future use, beyond the aggre-gation interval of the receiving buffer. Full, unaggregated log storage is beyond the purview of BufferTable as it pri-oritises recent data over older data. Numerous log storage systems including Splunk, Logstash and syslog-ng exist which can store logs indefinitely. Much how BufferTable can push state to a database or flat file, so too can it be configured to commit state to a log storage facility.
Chronologically ordered metrics can be inserted into the ring buffer in constant time. An out of order metric is entered into the ring buffer using a binary search to locate the index which falls within the appropriate time period, separates the buffer into two slices at that index, appends the metric to the lower slice and then appends the upper slice. This results in aO(logn)performance for out of order inserts.
A BufferTable instance is provided with an upper mem-ory bound which it will not exceed. When instantiated the BufferTable is empty. Buffer families are created when metrics are submitted to the the BufferTable. Ini-tially, buffer families are created with an equal share of the BufferTable’s allocated memory. Within a buffer family, memory is allocated to buffers in a logarithmi-cally decreasing manner from the receiving buffer to the final aggregate buffer. If buffers with larger intervals are empty, their capacity is subdivided amongst the preceding buffers. Should a buffer family reach its assigned capacity it will employ a LIFO strategy whereby aggregated metrics from the final buffer will be discarded. To avoid the loss of these metrics, a persistent storage mechanism must be used as timely collection and analysis of monitoring is the primary use case of Varanus and not long term storage.
Varanus analysis service
range of MapReduce and MapReduce-like services which attempt to support real time computation. The most pop-ular of these is Apache Storm. Storm, MapReduce and indeed most other tools of the domain are intended to run over arbitrary clusters and are not indeed to run on shared use hosts. This makes the use of MapReduce and its contemporaries inappropriate in Varanus as it is built around the goals of resource awareness and being sec-ondary to other applications running on VMs. Rather than attempting to develop yet another MapReduce implemen-tation which meets the goals of Varanus it is preferable to instead provide a means to export Varanus state to an existing MapReduce implementation, if MapReduce is indeed required.
In lieu of MapReduce, Varanus exposes an alternative processing framework which is better suited to analysing monitoring data. The primary means of analysing moni-toring state in Varanus is Quince4 an event based
pro-gramming model which in the same vein as other Varanus services, distributed computation over the entire cloud deployment. Quince is intended to allow developers to build upon Varanus and to develop new features and implement autonomic failure detection and correction strategies. The actor model was chosen as it maps well to the underlying Varanus architecture and allows actors to be relocated and message routing to be altered according to resource usage, membership change and other phe-nomena with ease, where as other concurrency models would not support this as easily.
Quince
Quince is an event based programming model to support real time monitoring data analysis and the development of autonomic workflows. Quince expresses computation in terms of events and actors which process those events. The actor model is a well researched model of concur-rent computation which is now seeing application in the cloud domain. Actors provide a high level, location inde-pendent model of concurrent programming which scale out and scale up with relative ease. Actors, therefore make an ideal basis for facilitating various forms of autonomic programming.
Quince exposes three units of computation to end users: sensors, events and actors. The user expresses their com-putation in the form of sensors, which generate events and actors, which consume events. This orchestration is intended to facilitate autonomic programming with the sensor and event-actor chain intended to directly map to the monitor-analyse-plan-execute autonomic pipeline. Additionally, while more batch computational models such as MapReduce support only acyclical workflows, Quince has no such limitation making it a superior choice for real time processing.
Sensors are written by the user and run not as part of the analysis service but rather as part of the storage service. Sensors are associated with values in the storage service and run periodically when values are updated. Should val-ues in the state store meet the conditions specified in a sensor be met an event is generated. Sensors provide a means to regularly check conditions and trigger an event, for use cases where regular checking is not needed events can be generated without a sensor. This allows events to be generated natively within applications, rather than having a sensor check state collected from the application. Not all use cases however require a sensor, nor a complex event. The sensor is, therefore, entirely optional. Actors can be called though a simple API call via any software. Addition-ally events can empty aside from the type field, allowing events to serve as simple messages to call actors.
Once events have been generated they are then dis-tributed. Event distributed occurs in one or more of the following manners:
1. Local handling, the event is passed to an appropriate actor (if one exists) at the local Quince runtime. 2. Direct delivery, the event is sent to one or more
specifically designated hosts. Hosts are designated by the coordination service. By default the least loaded hosts are prioritised for direct distribution.
3. Propagation, the event is propagated to to the entire deployment or logical subgroup via a hierarchical gossip broadcast.
These three distribution mechanisms allow events to be processed locally for efficiency, sent to a dedicated event processing instance for consistency or propagated over the deployment to perform complex, distributed tasks and analysis.
Actors are also written by the end user and are called when a Quince runtime receives an event appropriate to the actor. If an event is received and no appropriate actor is present the Quince runtime will either disregard or for-ward the message according to what is specified in the event. When invoked the matching actor will decode the event, perform their prescribed action and optionally gen-erate an additional event. This allows for the creation of event chains, whereby a string of actors are invoked though the use of intermediate events.
1. Aggregate. The aggregate actor takes two parameters, a delay and a aggregation method (count, max, min, medium, mode or sum). All events received from the initial invocation until he delay has elapsed are aggregated according to the specified method and a single event is produced as a result. 2. Filter. The filter actor takes two parameters, an event
field and a search pattern. If the search pattern does not match the given field the event it is discarded. In addition to regular expressions the pattern can search for the special valueslast and expected which correlate to state store values representing the previously recorded state and the normal state. 3. Redirect. The redirect actor takes an argument
specifying which distribution method (listed above) to redistributed the message on.
By combining actors and preprocessors developers can create powerful event chains which can detect notable states and phenomena and in turn implement corrective action. The primary motivation behind this problem is to provide a scalable, distributed means to execute mon-itoring workflows. Using this programming model it is near trivial to implement basic monitoring practices such as threshold checking and feasible to implement complex autonomic monitoring workflows.
Actors in Quince are not bound to a physical host, Quince actors exist invirtual actor spacean abstraction which maps a sub-region. Individual actors are instan-tiated within the actor space and are identified by 3 values: a type signature, a instance ID and locator, signi-fying the VM currently hosting the actor. In the virtual actor space, at any given time, there can be zero, one or many instance of an actor. Serialised actors are stored as immutable objects within the coordination service config-uration store and are instantiated when necessary. Actors are dynamically loaded when an event handled by a non-instantiated actor is raised. Actors are non-instantiated to hosts according to the least loaded strategy used through-out Varanus. The hosts which act as Quince runtimes and which have instances of each actor in the system are announced via the configuration store.
Computation placement
While most current actor implementations provide loca-tion agnosticism, whereby actors are invoked locally or remotely using the same semantics, most do not decouple the actor from an endpoint. Current actor schemes pre-dominantly rely upon hardcoded URIs or some external lookup service such as DNS or JNDI to provide a URI. This scheme ties actor instances to a specific host and requires all clients to update their URIs in the case of fail-ure or configuration alternation or rely upon some form of indirection. This is non ideal and runs contrary to the
notion of rapid elasticity and simple horizontal scaling. As the hosts which comprise a cloud deployment are prone to rapid (and possibly frequent) change it is not preferable to have actors tied to a specific host. Rather it is prefer-able to have actors prefer-able to move between hosts and sets of hosts transparently and encapsulate this into the existing notion of location agnosticism.
Unlike previous actor implementations actors in Quince are not bound to a physical host. Quince actors exist in a stage otherwise known as a virtual actor space an abstraction which maps to the underlying resources which comprise the cloud deployment. Individual actors are instantiated within the actor space and are identified by 3 values: a type signature, a instance ID and locator, sig-nifying the VM currently hosting the actor. In the virtual actor space, at any given time, there can be zero, one or many instance of an actor. The virtual actor space maps to the underlying resources. Specifically it maps to two locations: an actor store and the Quince runtime.
The actor store is any data store which supports the hosting of packaged code archives (which is virtually all of them). In our implementation the actor store is provided by a Kelips [18] like DHT which is also hosted by the VMs within the deployment. The actor store could, however, be an external database or service such as Amazon S3 or equivalent. Non instantiated orcoldactors reside in the actor store until required. They are dynamically loaded when a request to a cold actor is issued. In our implemen-tation this is achieved through Scala/JVM dynamic class loading which fetches the respective jar file containing the packaged actor front the actor store to an appro-priate VM, instantiates the actor and then handles the incoming request. Instantiated orhotactors are hosted by Quince runtimes which reside upon each VM within the deployment. This scheme could also allows for hot actors, including their state to be serialised to the actor store.
linear regressions to estimate the appropriate number of actors.
As actors can be moved or terminated there is need to maintain knowledge of the location of actors. Quince tracks the location of actors by distributing a lookup map to each runtime which specifies the current loca-tion of each instantiated actor. Each Quince runtime maintains a map (in our implementation this is a Guava multi map) which maps actors to endpoints which host actor instances. New actor instantiations register them-selves with the local runtimes’s map which is then dis-seminated to all other runtimes within the deployment. Similarly actor instances on VMs which are undergoing termination mark themselves in a tombstone state prior to termination and then eventually expunged from each runtime’s lookup map. If the VM fails or is unable to reg-ister the termination it then becomes the prerogative of the failure detector to remove the dead actor from the lookup map.
The lookup map is disseminated and kept consistent between all runtimes either via a pub-sub for client run-times or gossip scheme for actor hosting runrun-times. Both these methods of synchronisation achieve eventual con-sistency, therefore there is the possibility that calls may be made to no longer existing endpoints or runtimes may not yet be aware of newly instantiated endpoints. Again, the circuit breaker mechanism is intended to lessen the significant of this issue.
The mechanism described above affords Quince the mean to instantiate, terminate and move actors on an ad hoc basis. What is required to use this mechanism is a policy that stipulates where actors are placed and when to change their placement. In the current Quince implementation this is achieved through a simple heuris-tic approach. Quince deployments are instantiated with a heuristic map which associates a given condition with an action. This map, by default, contains heuristics to instantiate additional VMs when the actor system has insufficient resource, to terminate VMs when there are excessive resources for a significant period and a series of heuristics to increase and reduce actor instantiations according to demand. This basic approach is not guar-anteed to achieve an optimum solution to the problem of computation placement and can result in sub opti-mal decision making. A constraints or machine learning approach may be superior and can be slotted in as a substitute with relative ease.
Example 1
Consider the problem of concatenating related log entries from a distributed application that are generated within 10 min of each other and then enumerating how many concatenated logs were produced within the 10 min inter-val. Each log is identified by an ID and log entries are
not guaranteed to be causally ordered. Figure 9 provides a Scala implementation of this scheme.
In this example there is a sensor,LogSensorand two actors:joinandreport. LogSensor periodically checks for new log entries, filter the relevant log type and passes it to join.joinextracts the ID from the new log and makes an API call to a document store to ascertain if another log entry with the same ID exits. If it does, it concatenates the two entries and pushes the result to the document store. If not, it commits the partial entry to the document store and awaits the next entry.reportis called in conjunction with the aggregate preprocessor to enumerate and report to a service the number of log entries concatenated within the 10 min window.
Example 2
Consider the problem of detecting high CPU usage then if the rest of thesub-regionis heavily loaded, start addi-tional VMs to compensate for load. The user would write a sensor and actor similar to that in Fig. 10.
In this simple example the sensorCPUSensoris
exe-cuted by the monitoring agent when the local CPU usage is updated in the state store. Should the CPU capacity exceed 90 % the sensor generates acpuEvent, and spec-ifies direct distribution. This will propagate events to a specifically designated host, by default the coordination
[image:18.595.305.539.424.717.2]Fig. 10Detecting and mitigating high CPU usage using Quince Actors
services designates the least loaded host. Prior to invok-ing the actor, the event is first passed to a preprocessor which aggregates the values of all events of the cpuEvent type received over a 60 s period. The aggregate event is
then sent to theCPUactor which uses the value
con-tained in the event (which after the aggregate sub-actor
is the number of loaded hosts). The actor, CPUactor
consumes the aggregate event and establishes what pro-portion of the VM deployment is loaded. If more than half of the VMs within the deployment are at 90 % or greater CPU utilisation, a new VM is started.
Evaluation
Evaluation architecture
Deploying distributed applications is often challenging due to the logical and geographic separation of compo-nents. Scale often exacerbates this problem, producing a volume of work which far surpasses what humans can do in a timely fashion. Common cloud computing best prac-tice stipulates that SSH (or RDP in the case of Windows VMs) is a last resort. That is that a human should only log in to a VM in the event that of some unanticipated behaviour which cannot be handled through automated tools.
The evaluation of Varanus was performed using Ama-zon Web Service, therefore instead of using generic cloud computing terms this paper will use AWS specific nomen-clature. EC2, like most IaaS clouds, allow users to seed an executable script to a VM on instantiation. This is the mechanism which is used to provide the basic configu-ration to each VM, necessary to obtain all the relevant software and to deploy the configuration. This script is transmitted to VMs and once they have finished the boot process, the script is then executed.
The VMs in our evaluation all run Ubuntu 12.04, instan-tiated from the Amazon Machine Image ami-ecda6c84. Each VM instance is seeded a very simple Bash script which installs Puppet and then uses Puppet to install
and configure all subsequent software. Puppet5 is an
Open Source configuration management tool which pro-vides a declarative Ruby based DSL which enables users to buildmanifestswhich describes software installation, commands and configuration which should be performed on clients. Puppet is used to install Varanus and the neces-sary software to collect data and run experiments and give Varanus instances the necessary bootstrap information.
In addition to the deployment which is being evalu-ated, additional VMs are provisioned for services which support the experiments. These are:
The Results Service: a simple message service endpoint which provides a mechanism for clients to push their experimental results. This service is written in Python and uses a ZeroMQ pull socket to act as a sink which waits for results to be pushed. In addition to Varanus, Puppet installs a client which pushes results to the result service once the experiment has completed.
The Events Service: the events service is a mechanism to simulate faults and to terminate and instantiate VMs. The events service takes configuration files written in JSON which specify what events to trigger and when. Events include: terminate an arbitrary number of VMs, termi-nate a specific VM, instantiate a number of VMs, trigger a failure and instruct Puppet to pull down configura-tion to VMs. In order to achieve this, the events service communicates with the EC2 API in order to instantiate and terminate VMs and with a small client on VMs in order to simulate failure and run arbitrary commands. The events service is written in Python and uses ZeroMQ push sockets for messaging.
The Puppet Master: the Puppet master serves and com-piles manifest files which specify the configuration for VMs.
This architecture is described in Fig. 11. When evalu-ating larger numbers of VMs the results service and the Puppet master become overloaded and hamper the exper-iment. Thus when using larger number of VMs they are replicated over multiple VMs which are round-robined between using the Route 53 DNS service in order for them to scale and meet demand.
Comparison against current monitoring tools