CREATING NUMBERS: CARBON AND CAPITAL
INVESTMENT
(Accepted for publication in Accounting, Auditing & Accountability Journal)
Gillian M. Vesty, RMIT University Abby Telgenkamp, University of Melbourne
Philip J. Roscoe, University of St Andrews
Structured Abstract
Purpose -This case study seeks to illustrate the way in which carbon emissions are given calculative agency. We contribute to sociology of quantification with a specific focus on the performativity of the carbon number as it was introduced to the organisation's capital
investment accounts. In following an intangible gas to a physical amount and then to a dollar value, we used categories from the sociology of quantification (Espeland and Stevens, 2008) to explore the persuasive attributes of the newly created number and the way it changed the work of actors, including the way they reacted and viewed authority.
Design/methodology/approach –An empirical case study in a large Australian water utility drawing on insights from the sociology of calculation.
Findings -We present empirics on the calculative appeal of the carbon emissions number, how it came into being and its performative (or reactive) effects. The number disciplined behaviour and acted like a boundary object, while at the same time, enrolled allies through its aesthetic appeal in management accounting system designs. In framing our empirics, we were able to highlight how the carbon number became a visible actor in the newly emergent and evolving carbon market.
Research limitations/implications –This paper provides an empirical framing that continues the project of writing the sociology of calculation into accounting.
Originality/value –This study contributes to the sociology of quantification in accounting with an empirical framing device to reveal the representational work of a number and how it expands as it becomes implicated in broader networks of calculation.
1. A small comment that started things
“Hey, wouldn’t it be interesting”, said the finance manager from a large state-owned water utility. “Now we have this new number in our NPV model, we can go back over past decisions to see if we might have done them differently.” “Yes. What about the over the hill or through the hill dilemma we had last year?” explained the Environment and Technology Manager. “That would be a perfect example to test”. We were in a meeting with senior managers from the state-owned water facility. As part of an industry globally recognised for its high carbon emissions, they had recently decided to introduce a price for carbon emissions in their net present value (NPV) model. For some the dynamic cost function (based on energy consumption, emissions factor and carbon market price) meant they were getting closer to a true economic value of their infrastructure assets. For others it symbolised a lot more. We could feel the enthusiasm of the environmental and sustainability team as they were given the authority to bring carbon emissions to life in capital investment appraisal. The enthusiasm of the sustainability team overflowed to others in the organisation, including the accountants, who were enlisted to the project. We, the researchers became enthused, and we decided to stay and witness the construction of this number as ‘mark’ and ‘representation’.
We commenced our fieldwork, like Briers and Chua, at the ‘start of an accounting controversy’ (2001, p.242). Organisations were gearing up for the carbon market and our research commenced at the beginning of a redesign of the accounting system. In spite of the enthusiasm highlighted in the opening comment, there were debates about other choices that could be taken by the organisation. It might have purchased ‘green’ energy to save the separate line item calculation in the NPV model. Carbon emissions could have been reported according to regulatory enforcement and left out of internal management accounting system designs. However, sustainability leadership, at a global level, was central to this debate and arguably extended to internal accounting change mechanisms1. As such, managers of the government owned water utility intended that the carbon emissions number would be used by the organisation in decision-making and in asset valuation for their long-term infrastructure investments. As the carbon number became central to the organization’s accounts, so it became the focus of our accounts of the organization.
In this paper we show how a carbon number (a dollar value derived from physical units) is elevated to become a pivotal actor in organisational practice. We demonstrate the multiple attributes of the carbon emissions calculation and its capacity to act as a ‘representative’ for the ideals associated with the broader carbon market. As representations, numbers acquire multiple characters (Vollmer et al., 2009); we contrast the carbon number’s ordering capacities with its valuing capacities. Numbers reflect economic reality, and more: through active involvement in social and institutional practices, they are implicated in the creation of new market realities (Hopwood and Miller, 1994). Recognizing that the carbon number is a representative of corporate engagement with the ideals of the market for climate change, prevents it from being ‘black-boxed’ as an accounting line item, or alternatively, viewed in isolation of the community in which it engages (Cuckston, 2013). Instead the ‘rational’ number represents multiple possibilities (Macintosh and Baker, 2002; Macintosh and Quattrone, 2010) and the potential for achieving a particular accounting reality (Roberts,
1According to a study conducted by the Water Research Foundation the most common drivers for water utilities
2009). It stands for social order, providing a way to represent climate change concerns, and it represents a value that will engage market participants (Mackenzie, 2009).
We draw on Espeland and Stevens’ (2008; 1998) sociology of quantification to highlight the influential power of numbers in organizing social action. The sociology of quantification, already employed in studies of carbon accounting, is used to show the attributes numbers might hold: they make people ‘work’ and ‘react’ in certain ways (Espeland and Saunder, 2007). A number has ‘authority’, it ‘disciplines’ while at the same time has an ‘aesthetic’ appeal that contributes to our recognition of accounting as a visible technique (Burchellet al., 1980; Bloomfield and Vurdabakis, 1997; Thomson, 1998; Suzuki, 2003; Davison, 2009). With this focus on action, accounting numbers can be understood as participants in pragmatic efforts to facilitate a discourse around sustainability governance, implicated in roles that stretch beyond providing information (Vollmer, 2007). In coordinating corporate activity, numbers enable action at a distance (Miller and Rose, 1990; Robson, 1991) and serve to embed the notion of sustainability governance by providing a form of disciplinary architecture (Foucault, 1991). As such, numbers engage different themes in different social situations with a laminating power that requires further exploration. Vollmer explains: “… much more might be done with numbers than could be achieved by words, and the sociological understanding of this “more” might just require to focus still more on pragmatic, dynamic and situational achievements of using numbers, even at the cost of more traditional concerns with information any given number might or might not, should or should not provide” (2007, p.597).
Our contribution extends the accounting literature highlighting the performativity of calculation (Preston et al., 1992; Briers and Chua, 2001; Andon et al., 2007; MacKenzie, 2007; 2009; Quattrone, 2009; Boedker, 2010) and continues the project of writing the sociology of quantification into accounting. The calculative appeal of the carbon emissions number is central to this discussion (Espeland and Stevens, 2008; Verran, 2011), and we present a much-needed critical account of its role in carbon management accounting (Hopwood, 2009; Ascui, 2014).
Our analysis is presented as follows: Firstly, we consider the ways accounting numbers have become visible actors in the newly emergent and evolving carbon market. We follow with discussion on the attributes of number through a sociological framing and draw on Espeland and Stevens’ (1998; 2008) sociology of quantification to develop our research questions. We proceed with discussion of our case site, in which we follow the carbon number and describe how it moves through the organisational accounts and control system design. We conclude with discussion on the performative (or reactive) attributes of the carbon number. We bring to light the pragmatic, dynamic and situational achievements of the number as it moves between valuing and ordering roles.
2. Accounting numbers at work: making carbon visible
Carbon accounting has emerged from the implementation of carbon markets (Bebbington and Larrinaga-González 2008), which are themselves part of a broader effort to make sustainability issues visible and accountable (Bebbington, 2007). Carbon markets are a response to perceived market failure, and the ability of firms to externalise costs (Stern, 2006). As MacKenzie points out:
direct cost (because allowances to emit greenhouse gases need to be purchased), or an opportunity cost (because allowances that are not used to cover emissions can be sold, or because credits can be earned if emissions are reduced below ‘business as usual’). A carbon market is thus an attempt to change the construction of capitalism’s central economic metric: profit and loss, the ‘bottom line’ (2009, p.x).
Connecting an economic value that has been ‘visible’ in the electricity sector for some time, with a carbon market value is not an easy task (MacKenzie, 2009). MacKenzie talks of ‘inherently flawed’ carbon markets and the risks associated with incentivising emissions reductions, the impact of allowances and tax liabilities, market pricing impacts through delayed sale of permits, passing of opportunity costs and issues associated with ‘leakage’ beyond the boundaries defined by the carbon market (2009, p. 450). Equally difficult is the development of carbon accounting, a technology that is still ‘hot’ – in its infancy and unsettled, as traditional technologies of cost-benefit struggle to come to terms with the novelties of carbon (Lohmann, 2009). In fact, it appears that the ‘net effect of financial accounting has been to obscure the passage of emission allowances in and out of balance sheets’ (Lovell et al., 2013, p.744). Within the organisation, considerations have been given to ensure a multi criteria approach to resource allocation is taken (Baxter et al., 2004; Bebbington, 2007; Bebbington, et al., 2007). In practice, Frame and Cavanagh (2009) highlight difficulties with available monetised data to include in the sustainability assessment models, in particular data on social impacts. The ‘Frontiers of (non) Monetisation’ literature highlights the reasoning by which effective environmental policy relies on trade-offs between environmental information translated into monetary terms and those left in non-monetary arrangements (O’Connor and Spash, 1999; O’Connor, 2000). It exposes the difficulties for accountants in the commensuration of data to a single common and understandable measure for decision making, with inherent issues around time horizons, underlying plurality of value systems and domains for which a single economic value is controversial (O’Connor and Frame, 2008)
(2011) also conceptualise carbon accounting as a meeting of different calculative ‘framings’ (Callon, 1998), including hot (unsettled) political commitments on carbon markets, and cool (settled) technologies of physical carbon accounting, financial accounting and social and environmental accounting.
Much of the non-positivist work on carbon accounting is informed by the sociological literature of standards (Bowker and Starr, 1999) and quantification (Espeland and Stevens, 1998; 2008). Standards are embedded in expertise, and accountants represent a grouping of professional experts central to all of these discussions (Lovell, 2013), while accounting numbers, including the emergent carbon emissions number, represent a common language of our capitalist society (Miller, 2005; Timmermans and Epstein, 2010). Standards are ubiquitous in the modern world, becoming invisible as they become more taken for granted, long-standing and extensive (Bowker and Starr, 1999). They occupy a hallowed position in public discourse, where, perceived as objective and above the intrigues of politics, they help create trust in public bodies and administration (Porter, 1995). Standards, classifications (Espeland and Stevens, 2008) and numbers (Vollmer, 2003; 2007) are performative: theyact in the world. They help us identify the nature of things: what things are, how we should respond to them, and how they should be treated (Bowker and Starr, 1999). The challenge for research, then, is to unpack the social and organizational work involved in the process of standardizing and quantifying, of making things ‘commensurable’ through metrics and measurements (Espeland and Stevens, 1998; Vollmer, 2007). In the field of carbon accounting Lohmann, for example, finds the notion of commensuration a powerful tool in understanding the work done by carbon accounts in bridging the ‘huge figurative distances between traders’ conceptual, largely electronic universe of ‘abstract’, simplified, fungible carbon credit numbers and the universe of the ‘concrete’, diverse, particular, highly complex, often obscure local projects that produced them, together with the tangled chains of physical and social relationships that connected them to the ongoing history of the atmosphere’ (2009, p.506).
The processes of standardization and classification which we describe are embedded in the accounting systems of the public utility that forms our case. Organizations rely on inscriptions that are both stable and mobile (Qu and Cooper, 2011), to achieve control ‘by substituting symbols, paper inscriptions and other devices…for direct involvement of the human body and its senses’ (Lowe and Koh, 2007, p.953). Accounting numbers render space and time malleable (Quattrone and Hopper, 2005) and become ‘mediating instruments’ (Miller and O’Leary, 2007) between organizations and markets, or between organizations and quantitative productions of the future, in the form of risk (Miller et al., 2008). Pursuing the notion of mediation further, we see that numbers hold different representational ontologies (Vollmer, 2007; Verran, 2011). For example, we can readily identify numbers that “mark” (identify), such as telephone numbers and account codes. Numbers can represent economic realities, other numbers or participants in social situations (Vollmer, 2007, p.593). As the work of representation multiplies, so the numbers develop an ‘indexical space’ (Verran 2011), multiple existential qualities driven by use and never fully invisible:
In this paper, we expand the reach of the sociology of classification within carbon accounting. We use Espeland and Stevens’ (2008) five analytic dimensions of quantification to connect representation with the network of agents and calculations involved in creating and maintaining visibility for the carbon emissions number. We have developed the five dimensions into a series of research questions relevant to the analysis of carbon accounting:
1. Work: What is the work performed to create a system of measurement?
2. Reactivity: How does the carbon emissions number cause individuals to think and act differently?
3. Authority: Is there evidence of the creation of a network of standardised procedures, of carbon emission calculations being embedded in techniques and routines? Does the carbon emissions calculation connect individuals within the organisation? Is there an authority being established throughout the organisation, based on the perceived trustworthiness of this number?
4. Discipline: What is the capacity of the carbon emissions number to act like a boundary control in evaluating and managing behaviour? Is there greater accountability through this visibility? Is there evidence of heightened transparency in decision-making?
5. Aesthetics: The numerical representations of social phenomenon through diagrammatic form, a performative role giving self-fulfilling agency.
We will consider, by means of these five questions, the multiple ontologies of the carbon number. In doing so we discover the ‘indexical space’ revealed as the number serves to establish meaning and produce arithmetic results: the space that opens up between ordering and valuing, as the number marks, commensurates, and connects.
3. Research context: a water utility
We arrived at our research case site just as managers had decided to embed a carbon emissions number in their NPV model. The rationale was that they could improve valuing (and re-valuing) techniques for existing infrastructure assets. They could also better evaluate new investment proposals. Our empirical data are based on a case study of the newly created carbon emissions number over a period of twelve months, at a large water utility.
The use of a case site offers the opportunity to engage with a social setting in order to follow the carbon number at the micro-level. The central focus of this research is to get close to the participants operating in the field, to engage with the numbers that circulate as a “social and institutional practice” (Hopwood and Miller, 1994; Preston, 1986; Chua, 1988; Dent, 1991; Power, 1991; Jonsson and Macintosh, 1997; Miller, 1991). Our case focuses on the emergence and translation of an accounting number in practice (Mouritsenet al., 2009) and views the theoretical, technical and aesthetic components as emergent categories (Miyazaki, 2013). The sociology of quantification provides a set of categories and a means to make sense of the empirical details as it unfolds. The aim is to highlight how the persuasive attributes of number emerge in this particular setting, and to follow the number through the development of the NPV model and associated accounting decisions.
“The water industry is focusing efforts on optimizing water usage with minimal energy inputs. This shift toward more sustainable options is in response to the need to mitigate climate change and to manage associated regulatory, operational and cost challenges. Available energy management and greenhouse gas (GHG) accounting tools are proliferating in response to differing location and sector specific needs for reporting, carbon trading, and facility optimization strategies” (2013, p.xvii).
In Australia, there is currently an oligopoly in water distribution. As decentralised government agencies, water utilities have a guaranteed customer base and one that is potentially growing with geographical dispersion. In somewhat conflicting strategies, revenue growth is impacted by water shortages and environmental best management practices, with water companies actively discouraging increased consumption by businesses and households. Along with societal expectations and political regulation and reputation, water companies have difficulty increasing prices to their ‘average’ consumers. At the same time delivery to all customers is essential requiring contested supply sources, such as desalination plants. As pseudo cost centres for governments a water utility’s costs and cost management practices are both important but politically controversial in the efficient and effective provision of high quality water and waste removal. This case setting thereby provides an interesting juxtaposition of demands associated with the management and delivery of water and sewerage services.
The unfolding case
Immersed in organisational practices and decision-making processes around the integration of carbon emissions in the capital investment model, we found the employees willing to share their views, thoughts processes and practical actions with us. Over a period of one year, we attended meetings and interviewed a range of water utility managers. We had a repertoire of questions to best represent the field of enquiry and adapted these to the position the manager held within the setting (for example, accounting, sustainability, engineering perspective etc.). We also had morning coffees and lunch with the employees. Given case interviews were staggered over time and we had permission to follow the E&T team as they developed the NPV model, we were given access passes and a work station in the open plan setting that enabled us to freely come and go. We chatted informally about work, research, holidays and life in general. An important part of this informal discussion related to the presentation of the emissions calculation in the NPV and allowed us to follow the number as it enrolled allies into a growing network of humans and non-humans.
In the following Tables 1 and 2 we highlight the key actors involved in this study. Overall, our focus was directed on the accounting number and its persuasive attributes that contributed to maintaining its position in the network. We observed practices and interrelationships between the human and non-human actors in order to understand and to tell the carbon emissions story. Appendix 1 includes a further details of the mostly formal interviews held with key actors identified in Table 1 below.
[Insert Table 1 about here] [Insert Table 2 about here]
With access to documents and intranet sites, we were able to review externally reported data, such as the annual report and legislative guidelines as well as internal procedure documentation, corporate and divisional strategic plans.
Most importantly we were generously provided with stories of past practices and events about how sustainability impacts are valued and crystallised in this organisation’s capital appraisals. We transcribed recordings, and coded all data according to the analytic themes we were following. This enabled us to follow the translation of the carbon emission into practice. The level of access in the company provided us with the ability to corroborate any queries we had with our analysis. We sought to make sense of the negotiation of interests through the ideals or possibilities provided by the process of accounting for the carbon emissions number.
Introducing the numbers: The Carbon number in SAS, MCA and NPV
A multi-criteria performance measurement tool called a Sustainability Assessment Scorecard (SAS) had previously been developed to monitor key performance indicators of the utility (Appendix 2). The three categories: “Financial”, “Social” and “Environmental” consider greenhouse gas emissions numerically, as a physical flow and then a dollar value. The physical flow was an important measure in the scorecard and the precursor to the calculated carbon emission accounting number.
In the “Environmental” section carbon emissions were counted as physical units called ‘greenhouse gas emissions’ and designated Scope 1; Scope 2 or Scope 3 (Appendix 3). In the “Social” dimension carbon emissions were used qualitatively to express risk and reputation cost/benefit. This aspect was considered too complex to convert to numeric. In the ‘energy consumption’ category carbon emissions were represented as a physical flow for drinking water and wastewater facilitation (further highlighted in Appendix 3).
The NPV dominates the “Financial” section of the SAS, which converts the physical flow to an accounting number. The social and environmental dimensions contributed to the elevation of the carbon emissions number to the financial segment and made visible the zero greenhouse gas emissions goal. The carbon emissions number became a means to address potential business and reputation risks: “carbon emissions are actually a business risk for us … reputation is priceless to us as a company” (E&T Manager). It was anticipated that future market-based competition requires proactive efficiency and accountability.
While the SAS model provides the measures to be included, multi criteria analysis (MCA) dictates the valuing decisions. The multi-criteria approach tests the viability of potential investment opportunities and helps balance the regulated quantitative NPV analysis with local qualitative risk attributes and sustainability evaluation.
MCA evaluation involves ordinal assessment (that is, ranking on a scale of 1-5) and weighting of factors (economic 32%; social 34% and environmental 34% to a a total score out of 100). This ordinal form of assessment is used in the majority of investment decisions. The weighted categories combined form a single cost-benefit measure and engender overall value of the project. We had comments about requisite subjectivity of this model but surprisingly there were no major concerns. It was argued that the ideas and measures behind the tool’s design were well rehearsed and practiced, even prior to the formalised MCA approach.
Capital investment proposals generally originated from project managers involved with construction and large infrastructure projects. Treasury, the overseeing Essential Services Commission of the Australian Government, regulates the input data for NPV determination. Firstly, they mandate the use of NPV for all capital expenditures of fifteen million dollars or more. Secondly, the government discount rate is used for all capital project evaluations. The E&T Manager explained that this rate reflects Government’s required rate of return and “is set by Treasury, so we have no scope to change it”. Likewise, Treasury caps time horizons of infrastructure projects at twenty-five years, even though existing infrastructure is frequently far, far older than this. Treasury does, however, give the water utilities autonomy to determine their individual cash flows, thus decisions about the treatment of carbon emissions. Hence the cash forecasts estimated by the engineers, determined by the method of construction and materials used when delivering new infrastructure to customers, have largely been considered as historically accurate.
one hundred thousand dollars and fifteen million dollars and informally used for all other projects valued at less than one hundred thousand dollars. For the projects valued at less than fifteen million dollars, the proposer would decide the requisite precision of cash flow estimates.
For competing options the Infrastructure Department would either outsource calculations to the Finance Department, or would rely on proposer estimates depending on consistency with previous projects and/or level of accuracy required. If operating expenses over the life of the project were considered to be insignificant to outlay, a rule of thumb methodology was generally applied. As the Treasury and Financial Analysis manager explained: “We use a sort of pretty simplistic approach to the way we factor in electricity costs into the NPV analysis…when we don’t have accurate electricity forecasts, we just use a percentage of capital investment as the ongoing cost. … NPV analysis is done at a fairly high level”. We were provided examples of NPV model documentation, which highlighted that as the operating expenses of the project increased, the requisite level of accuracy also increased. Ultimate decision-making was based on the combined evaluation of the NPV model and the MCA weightings, as well as consistency and accuracy according to the importance of the project. Where the project is perceived to be low in importance, the same person may prepare the analysis and make the final decision between the alternatives. In these projects decision-makers would generally only consider the total capital outlays of the competing projects ignoring cash flows, as well as additional social and environmental impacts that are required by formal MCA analysis. This approach was a concern for the E&T Manager mainly for the reason that the carbon emissions impact would be visible in all decisions.
The over the hill or under the hill decision
We commenced this paper with management concerns that display of environmental leadership should be found inallaspects of operations, not just the large projects dictated by treasury or those driven by internal rules on project values. They decided to revisit their over the hill or under the hill investment appraisal to see if their new MCA model and NPV (with carbon emissions included) would have altered their original decision.
At the time, the initial outlay costs to tunnel under the hill were far higher than those of going over. The long run electricity cost estimates for pumping water up the hill, somewhat mitigated the initial outlay, but not entirely. The current question was: if carbon emissions were factored into this cost would the tunnelling project be seen as more worthwhile project? Management had not originally performed such an exercise but thought it interesting to recognise the impact now carbon was in the NPV calculations. Likewise, MCA provided additional visibility and weighting of supplemental qualitative data including impacts on the local community and ecosystem biodiversity. Given regulated infrastructure investment projects always generated negative NPV figures, the decision alternatives for social infrastructure was generally based on the ‘least negative’ option and qualitative assessment provides important grounds for decision-making. Treasury caveats were noted in the following comment:
that was vastly more expensive, but it were much better for the environment, we’d need a very good case behind why that was acceptable”.(IT Operations manager) In the original decision, the qualitative benefits of the project, although not formalised in an MCA model, were still successful in outweighing the costs – and the original decision was made to drill through the hill to preserve community relations. In other words, trust in management decisions appeared to overcome any concerns of subjectivity in the model. The inclusion of carbon emissions in the NPV tool was seen by some as getting closer to an accounting reality, providing better visibility through calculation, even if decisions were enhanced/over-ridden by qualitative viewpoints. The E&T team believed the quantification of carbon emissions within the NPV model would function as a form of sustainability ‘sensitivity analysis’ as readily quantified electricity and carbon emissions costs are made visible for management decisions. Explicit support is thus given to less energy intensive projects, like the under-the-hill option.
4. Discussion: Persuading and enlisting, the carbon number at work
The sociology of quantification (Espeland and Stevens, 1998; 2008) provides a powerful framework for the analysis of developments in carbon accounting (Lohmann 2009). In this paper we make use of Espelend and Stevens’ (2008) analytic dimensions of quantification to examine the development of the carbon number’s representative and linking, or indexical (Verran 2011) capacities. As the number persuades managers, enlists more allies, both human and non-human, and elaborates its network, so the ontological weight that it bears develops (Vollmer 2007). The five dimensions are as follows: work, reactivity, authority, discipline, and aesthetics. We treat each in turn.
Work is defined as the effort in creating a system of measurement (Espeland and Stevens, 2008). Through the conversion of carbon emissions (a previous externality), a tangible number is internalised within the company’s operational activities and debated by stakeholders. From determination of the electricity consumption (in megawatt hours), combined with an emissions factor (that converts electricity to in kilograms per kilowatt hours, equivalent to tonnes per megawatt hours), multiplied by the price of carbon emissions (per tonne of carbon dioxide equivalent units) as set by the market (mandatory or voluntary) for those wanting to offset emissions – the defined project is attributed a number, then reconciled with the accounting control system.
Engineers knew the capacity of the pumps and the average amount of energy used by each pump. Their energy consumption figures (estimated standards) were well rehearsed and trusted by the accountants. In-depth Skype conversations with senior engineers in the field provided details of typical pumps used, suppliers, contractors and equipment reliability, extent of innovation as well as accuracy of energy measurements. As such, work elevated number to a central actor in the organizational process through its ability to:
1. Define the boundary around the project so energy (greenhouse gas emissions) can be accurately counted;
2. Calculate the number of carbon equivalent units (in tonnes) from a project’s energy consumption (multiply electricity consumption (in megawatt hours) by the state emissions factor of 1.22);
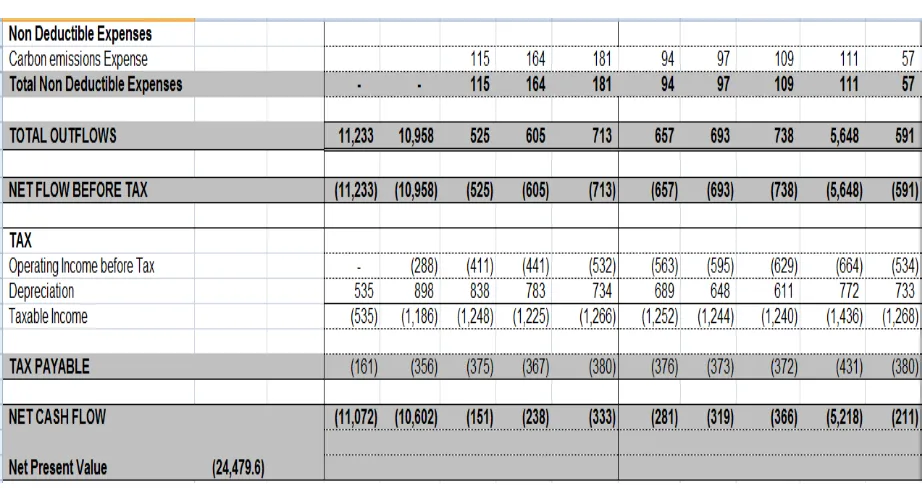
4. Insert this cost into the current NPV model as a line item categorised as a Non Deductible Operating Expense.
The E&T Management team’s work was to develop the model highlighted in Figure 1 below, while the accounting team’s work was to use the data. Not required for regulatory reasons the model was considered valuable and put to immediate use. In the ability to chart a history of energy consumption, past investment decisions were used to compare planned future performance.
[Insert Figure 1 here]
Originally the E&T team played around with ideas about how to best include the interim carbon emissions figure. Rather than calculate separately for every investment proposal, they wanted a dynamic NPV template to ensure carbon emissions maintained visibility and generated attention. The outcome is demonstrated in Figure 2 below.
[Insert Figure 2 here]
Reactivity. As the carbon emissions came to life we observed the ways employees began think, behave and react in different ways. We showed managers the spreadsheet designs (Figures 1 and 2) and asked for comments. Some were quite relieved that the company was taking sustainability impacts seriously and reacted positively to the visibility the spreadsheet generated). Some had a real environmental concern. They lived and acted their deeper philosophical beliefs both within and outside paid work hours (we talked about cycling to work and holidaying in nature). One team member had decided to develop an “APP” for an internal work competition (to enhance employee engagement in innovation) so customers could track their household carbon emission usage.
Different responses, such as the Finance Manager’s reaction to the new business model suggested the potential for generating energy efficiencies: “This [pointing to the NPV carbon emission modification] will force them [project proposers] to do a lot more analysis of the operating expenditure, and we’ll get some consistency there.” Taking the business case, this manager benchmarked activities with other utilities to make sure that their calculations were not too different from other peers in the network.
The IT Operations manager’s commented on the potential infiltration of the new model to administrative choices: “if the NPV is used for non-operational, support department capital expenditure, we may end up making different decisions … if [x project] is going to be x amount of tonnes of greenhouse gas emissions, then later on down the track if we had to start paying out of your department to offset those carbon emissions….”
Authority. The power and influence a number can hold was noted in the standardising procedures. The carbon emission number as a central figure, engendered authority. The E&T Manager, as owner of the number, held this transferred authority. She was able to gather and connect a network of managers, including finance, around the proposed NPV adaptation.
better analysis… we would like to get a bit more rigour around those, particularly the operating costs.” (Treasury and Financial Analysis Manager). Discussion was referred back to our earlier example of pumping the water over the hill or cutting through the hill. With the new model, they could revisit this, and other decisions to see if they had made an optimal choice at the time.
Discipline. The persuasive attributes of the carbon number emerged through the ability to discipline, or the capacity of the number to act like a boundary object to evaluate and control behaviour. Initially generated to meet changing regulatory requirements (carbon market creation), the carbon emissions number was more than a regulation device. The number disciplined, but in different ways. For the accountants, the number generated a trail of accountability, acceptable behaviour and sustainable decisions: “We’ll go through the financials, make sure they’re ok [and] put forward our recommendation. The business case will sit on top of that and all the work papers will be behind there, so the NPV spreadsheets will be there and they can see all the costs of inputs and things like that which form the final NPV result.”(Treasury and Financial Analysis Manager).
For the E&T Manager, the SAS and MCA, the calculation provided a boundary for evaluating decisions. It was a separate cash flow that could stand for a value – such as ‘acceptable’ or ‘too much’ energy consumption and let’s see what we can do to reduce this. It acted as both a number (a $ amount, a mark) and a value (how responsible the company is with the management of their assets and shareholder funds?). The IT operations manager reinforced this view when he explained how the number would further assist in decisions to override, or not, the NPV financial analysis:
“It wasn’t criteria in the NPV calculations, but more a recommendation in our business case, reflecting back on the five most expensive purchases that we’ve made in the last three and a half years. Using the history that we’ve always extended that, so we weighted that. So we had the NPV calculations which definitely said lease, but we decided, based on track record, the equipment that we’re buying, it’s designed in such a way that it’s modular, we can upgrade components of it to increase the life….we’re now in the process of purchasing rather than leasing.”
“[…prior to this we didn't] have a good visibility for sustainability and what it means within the organisation. You ask anyone in the organisation, well what have you done in the areas of sustainability in the last couple of years, and people would struggle. They might say a few minor projects, but they would struggle to actually tell you what sustainability is for us, and how it works, cause that’s not visible. … […with this model] you are forced to consider sustainability, and you are forced to have shown that you’ve looked at all these different options. And if you haven’t, you’ve got to justify why not. That really starts to change the thinking.”
When pointing to the diagrammatic representation the Greenhouse and Energy Specialist explained the spreadsheet as a way to communicate more broadly how the carbon emissions impact is measured “… If they can price it, and see it as a tangible, realistic thing, it’s going to be an extra risk to the business that needs to be managed.”
In summary, the five categories offered by Espeland and Stevens (2008) have provided us with a means of untangling the negotiations and contests involved as the carbon number persuades managers and enlists allies – not least the scorecards, SAS and MCA calculations – and in doing so becomes a central organisational actor. Soon enough, the number can force changes and discipline recalcitrant managers. The complexities of its construction are washed away, simplified into diagrammatic forms, and the carbon number becomes an organisational icon (Verran, 2011). Our discussion has shown how the “existential qualities of numbers [here, the carbon number] are constituted by the full range of problems which participants try to come to terms with by the numbers” (Vollmer 2007, p. 593). As the carbon number circulates in the organisation, it accrues layers of meaning, from the environmental concerns of the manager who cycles to work, to the business case demands of “the accountants”. Far from being a naive reflection of a simple reality, the carbon number displays an ever larger ‘indexical space’ (Verran 2011) as it ties a heterogeneous network of participants together.
5.
Conclusion: Representational practices
Our case details the implementation of the carbon number in a national water utility. The process had been driven by a desire to show environmental leadership across the whole of the organisation. We have examined how the representational work of the number expanded as the number became implicated in broader networks of calculation. For some it provided an objective viewpoint nested within the NPV. For others, the subjectivity around the MCA model called for greater network collaboration. Viewed in this way, the number opened, rather than narrowed the environmental leadership viewpoint. Utopian ideals and efficiency views were linked with a cause-and-effect view of accounting system design, or more uncertain, and even relativists, viewpoints became manifest in demands for changes in accounting system. The debates in the organisation were about effecting closure in a way that all financial, non-financial and governance needs could be met.
actors in these new networks were human: the carbon number was supported and elevated by the MCA tools and the Sustainability Assessment Scorecard. The qualitative attributes of the other models contributed to the usefulness of carbon emissions number, and the carbon number developed, or at least was perceived to possess, a higher authority in accounting system design. The carbon emissions number in the NPV framed and objectified a form of accountability – an accounting contract – while at the same time, through its representational and qualitative attributes, multiplied and engendered further debate within the organisation. Authority was evident in the accounting controls that were developed around the number’s emergent iconic status. The spreadsheet exercise provided visibility for the carbon emissions number as a standardised, accepted value, which in turn effected greater trust in the accounting system. The hierarchical assemblage of the SAS/MCA further reinforced the trust in new techniques and practices. The number’s growing authority is demonstrated when sustainability experts within the organisation debate the NPV results, or provide particular specifics about capital investment appraisal. On the other hand, when quantification fails to accurately capture environmental impacts, intervention by experts ensures the number continues to meet the objectives of environmental leadership in a consistent way.
We make a distinction between the number’s authority through its valuing capabilities and the capacity for the carbon number todiscipline by representing order. In turn, the number’s ordering capacities, the tallying or ranking of importance between the NPV and the broader MCA/SAS model are achieved through its elevation to the central organisational actor. Newly achieved internal transparency ensured governance was systematised through network routines, while broader societal concerns about environmental impact leadership were given a voice in the model. We are showing that the underlying value of the quantification process was achieved through the continual interplay and juxtaposing of the quantitative carbon number with the qualitative narrative by well-informed experts.
6. References
Andon, P., Baxter, J. and Chua, W.F. (2007), “Accounting change as relational drifting: a field study of experiments with performance measurement”,Management Accounting Research, Vol. 18 No. 2, pp. 273-308.
Ascui, F. (2014), "A Review of Carbon Accounting in the Social and Environmental Accounting Literature: What Can it Contribute to the Debate?"Social and Environmental Accountability Journal, Vol. 34 No. 1, pp. 6-28.
Ascui, F, and Lovell, H. (2011), "As frames collide: making sense of carbon accounting." Accounting, Auditing & Accountability Journal, Vol. 24 No. 8, pp. 978-999.
Baxter, T., Bebbington, K. J. and Cutteridge, D. (2004), “Sustainability Assessment Model: Modelling Economic, Resource, Environmental and Social Flows of a Project” inThe Triple Bottom Line: does it all add up?.Henriques, A. and Richardson, J. (eds.). Earthscan, pp. 113-120.
Bebbington, J. (2007),Accounting for Sustainable Development Performance,1sted., Oxford, UK, Elsevier.
Bebbington, K. J., Brown, J., Frame, B. & Thomson, I. (2007), “Theorizing engagement: the potential of a critical dialogic approach”,Accounting, Auditing & Accountability Journal, Vol. 20 No. 3, pp. 356-381.
Bebbington, J., and Larrinaga-González, C. (2008), "Carbon Trading: Accounting and Reporting Issues",European Accounting ReviewVol. 17 No. 4, pp. 697-717.
Bowen, F. and Wittneben, B. (2011), "Carbon accounting: Negotiating accuracy, consistency and certainty across organisational fields", Accounting, Auditing & Accountability Journal, Vol. 24 No. 8, pp.1022-1036.
Bowker, G. C. and Starr, S.L. (1999), Sorting Things Out, Cambridge, Massachusetts, MIT Press.
Bloomfield, B.P. and Verdubakis, T. (1997), “Visions of organization and organizations of vision: The representational practices of information systems “Accounting, Organizations and Society, Vol. 22 No 7 pp. 639-668.
Boedker, C. (2010), “Ostensive versus performative approaches for theorising accounting-strategy “,Accounting, Auditing & Accountability Journal, Vol. 23 No. 5, pp.595 – 625. Briers, M. & Chua, W.F. (2001), “The role of actor-networks and boundary objects in
management accounting change: a field-study of an implementation of activity-based costing”,Accounting, Organizations and Society, Vol. 26 No. 3, pp. 237-269.
Burchell, S., Clubb, C., Hopwood, A., Hughes, J., and Nahapiet, C. (1980), ’The roles of
accounting in organizations and society’,Accounting, Organizations and Society, Vol. 5 No. 1, pp.5-27.
Chua, W. F. (1988), “Interpretive sociology and management accounting research – A critical review”,Accounting, Auditing and Accountability Journal, Vol. 1 No. 2, pp. 59-79. Cuckston, T. (2013), “Bringing tropical forest biodiversity conservation into financial
accounting calculation”,Accounting, Auditing & Accountability Journal, Vol. 26. No. 5, pp.688-714.
Davison, J. (2009). “Icon, iconography, iconology: visual branding, banking and the case of the bowler-hay”,Accounting, Auditing & Accountability Journal, Vol. 22, No. 6, pp.791-826.
Dent, J.F. (1991), “Accounting and organizational cultures: A field study of the emergence of a new organizational reality”,Accounting, Organizations and Society, Vol. 16, pp. 705-732.
Department of Climate Change and Energy Efficiency (2010); 1. Australian Government. Kyoto Protocol. Retrieved July 12, 2010 from
http://www.climatechange.gov.au/government/initiatives/kyoto.aspx
Engels, A. (2009), "The European Emissions Trading Scheme: An exploratory study of how companies learn to account for carbon."Accounting, Organizations and Society, Vol. 34, No. 3–4, pp. 488-498.
Espeland, W.N. and Stevens, M.L. (1998), "Commensuration as a Social Process." Annual Review of Sociology,Vol. 24 No. 1, pp. 313-343.
Espeland, W. N. and Sauder, M. (2007), "Rankings and Reactivity: How Public Measures Recreate Social Worlds."American Journal of Sociology, Vol. 113, No. 1, pp. 1-40. Espeland, W. N. and Stevens, M. L. (2008), “A Sociology of Quantification”,European
Journal of Sociology,Vol.3, pp. 401-436.
Foucault, M. (1991), “Governmentality”, in Burchell, G., Gordon, C. and Miller, P. (eds.), The Foucault Effect: Studies in Governmentality, Hemel Hempstead, Harvester Wheatsheaf, pp. 87-104.
Fraser, M. (2012), "“Fleshing out” an engagement with a social accounting technology", Accounting, Auditing & Accountability Journal, Vol. 25 No. 3, pp.508 - 534
Frame, B. and Cavanagh, J. (2009), “Experiences of sustainability assessment: an awkward adolescence”,Accounting Forum, Vol. 33 No. 3, pp. 195-208.
Hopwood, A. G. (2009), “Accounting and the environment”,Accounting, Organizations and Society,Vol. 34, pp. 433-439.
Hopwood, A.G. and Miller, P. (1994),Accounting as Social and Institutional Practice, Cambridge University Press, Cambridge.
Lohmann, L. (2009), "Toward a different debate in environmental accounting: The cases of carbon and cost-benefit."Accounting, Organizations and SocietyVol. 34 No. 3-4, pp. 499-534.
Lovell, H., J. Bebbington, C. Larrinaga, and Sales de Aguiar, T. R. (2013), "Putting carbon markets into practice: a case study of financial accounting in Europe", Environment and Planning C: Government and Policy, Vol. 31 No. 4, pp. 741-757.
Lovell, H. (2013), "Climate change, markets and standards: the case of financial accounting", Economy and Society,accessed online at DOI:10.1080/03085147.2013.812830
Lowe, A. and Koh, B. (2007), "Inscribing the organization: representations in dispute between accounting and production." Critical Perspectives on Accounting, Vol. 18, pp. 952-974.
MacIntosh, N. and Baker, R. C. (2002), “A literary theory perspective on accounting: Toward heteroglossic accounting reports”, Accounting, Auditing & Accountability Journal, Vol. 15 No. 2, pp,184-222.
MacIntosh, N. and Quattrone, P. (2010), Management Accounting and Control Systems: An Organizational and Sociological Approach, John Wiley & Sons.
Mackenzie, D. (2007), “Is Economics Performative? Option Theory and the Construction of Derivatives Markets” in MacKenzie, D. Munisa F., and Siu, L. (2007). Eds.Do Economists Make Markets?Princeton University Press, Princeton and Oxford, pp. 54-87.
MacKenzie, D. (2009), “Making things the same: gases, emission rights and the politics of carbon markets”,Accounting, Organizations and Society, Vol. 33, No. 4-5, pp.384-414.
Miller, P. (1991), “Accounting innovation beyond the enterprise: problematizing investment decision and programming economic growth in the UK in the 1960’s”,Accounting, Organisations and Society,Vol 16, No. 8, pp.733-62.
Miller, C. A. (2005), “New Civic Epistemologies: Making Sense of Indicators of Local and Global Sustainability”,Science, Technology & Human Values, Vol. 30 No. 3, pp. 403-432.
Miller, P., Kurunmäki, L. and O’Leary, T. (2008), "Accounting, hybrids and the management of risk",Accounting, Organizations and SocietyVol. 33 No. 7–8, pp. 942-967.
Miller, P. and O'Leary, T. (2007), "Mediating instruments and making markets: Capital budgeting, science and the economy", Accounting, Organizations and SocietyVol.32 No. 7-8, pp. 701-734.
Miller, P. and Rose, N. (1990). “Governing economic life”,Economy and Society, pp.1-31. Milne, M, and Grubnic, S. (2011), "Climate change accounting research: keeping it
interesting and different." Accounting, Auditing & Accountability Journal, Vol. 24 No. 8, pp. 948-977.
Mouritsen, J., Hansen, A., and Hansen C. (2009), “Short and long translations: Management accounting calculations and innovation management”,Accounting, Organisations and Society, Vol 34 No. 6-7 pp. 738-754.
O’Connor, M. and Spash, C. L. (1999),Valuation and the Environment: Theory, Methods and Practice,Edward Elgar, Cheltenham.
O’Connor, M. (2000), “Pathways for environmental valuation: A walk in the (hanging) gardens of Babylon”, Ecological Economics Vol. 34 No. 2, pp. 175–194.
O’Connor, M. and Frame, B. (2008), “In a wilderness of mirrors: Complexity, sustainability assessment and confounded meta-narratives”, Landcare paper Available at:
http://www.landcareresearch.co.nz/publications/researchpubs/IAJ_Wilderness_of_-Mirrors_Submission.pdf
Power, M. K. (1991), “Educating accountants: Towards a critical ethnography”,Accounting, Organizations and Society, Vol. 16, pp. 333-354.
Porter, T. (1995),Trust in Numbers. Princeton: Princeton University Press.
Preston, A., Cooper, D., and Coombs, R. (1992), “Fabricating budgets: a study of the production of management budgeting in the National Health Service”,Accounting, Organizations and Society, Vol. 17, pp.561–593.
Preston, A. (1986). “Interactions and arrangements in the process of informing”,Accounting, Organizations and Society, Vol. 11, pp. 521-540.
Quattrone, P. and Hopper, T. (2005). “A ‘time-space odyssey’: Management control systems in two multinational organisations”,Accounting, Organizations and Society, Vol. 30 No. 7-8, pp. 735-764.
Quattrone, P. (2009), “Books to be practiced: Memory, the power of the visual, and the success of accounting’,Accounting, Organizations and Society” Vol. 34, pp.85-118.
Qu, S.Q. and Cooper, D. J. (2011), "The role of inscriptions in producing a balanced scorecard."Accounting, Organizations and Society, Vol. 36 No. 6, pp. 344-362. Roberts, J. (2009), “No-one is perfect: the limits of transparency and an ethic for ‘intelligent’
accountability”, Accounting, Organizations and Society, Vol. 34 No. 8, pp. 957-970. Robson, K. (1991), “On the arenas of accounting change: the process of translation”,
Accounting, Organizations and Society, Vol. 16 No. 4, pp.547–570.
Stern, N. (2006).The Stern Review on the Economics of Climate Change, Cambridge University Press
Suzuki, T. (2003), "The accounting figuration of business statistics as a foundation for the spread of economic ideas", Accounting, Organizations and Society, Vol. 28 No.1, pp. 65-95.
Thompson, G. (1998), “Encountering economics and accounting: some skirmishes and engagementsa”,Accounting, Organizations and Society, Vol. 23 No.2, pp. 283-323. Timmermans, S. and Epstein, S. (2010). “A World of Standards but not a Standard World:
Toward a Sociology of Standards and Standardization”,Annual Review of Sociology, Vol. 36, pp. 69-89.
Ugarelli, R., Venkatesh, G., Brattebo, H., Di Federico, V. & Saegrov, S. (2010), “Asset Management for Urban Wastewater Pipeline Networks”,Journal of Infrastructure Systems,Vol. 16 No. 2, pp. 112-121.
Verran, H. (2011), “Number as Generative Device: Ordering and Valuing our Relations with Nature” in Lury, C. & Wakefield, N. (Eds).Inventive Methods: The Happening of the Social, Routledge, London.
Vollmer, H. (2003), “Bookkeeping, accounting, calculative practice: sociological suspense of calculation”,Critical Perspectives on Accounting, Vol. 3, pp. 353-381.
Vollmer, H. (2007), “How to do more with numbers: Elementary stakes, framing, keying, and the three-dimensional character of numerical signs”,Accounting, Organizations and Society, Vol. 32 No. 6, pp.577-600.
Vollmer, H., Mennicken, A. and Preda, A. (2009), “Tracking the numbers: Across accounting and finance, organizations and markets”,Accounting, Organisations and Society, Vol. 34, pp.619-737.
Water Research Foundation (2013), “Toolbox for Water Utility Energy and Greenhouse Gas Emission Management”, accessed online on 28 May, 2013 at:
Appendix 1: Summary of Research Participants and Formal Participation
Interviewee Position Formal
Participation
Duration of Participation
1. Environment and Technology Manager Interview Informal/adhoc
36 mins
~ 10 hours over 1 yr
2. Environment Manager Introductory
Meeting Meeting Meeting
2 hours 2.5 hours 0.5 hour 0.5 hour 3. Greenhouse and Energy Specialist Introductory
Meeting Meeting Meeting Meeting Meeting Interview Informal/adhoc
2 hours 1.5 hours 0.5 hours 0.5 hours 1 hour 50 mins 36 mins
~ 5 hours over 1 yr 4. Project Officer (within the Environment and
Technology division)
Introductory Meeting Meeting Informal/adhoc
2 hours 2.5 hours 50 mins
~ 5 hours over 1 yr 5. Treasury and Financial Analysis Manager Meeting
Interview
40 mins 18 mins
6. Finance Manager Introductory
Meeting Meeting
2.5 hours 40 mins 50 mins
7. IT Operations Manager Interview 20 mins
8. Senior Engineer Interview 18 mins
9. Design Leader Interview 30 mins
Appendix 2: Summary of the Sustainability Assessment Scorecard
Business objective Factors
Economic Weighting = 32%
Ensure long term economic viability Net Present Value
Contribution to business growth Adaptability
Local economic benefit
Social Factors Weighting = 34%
Provide value to customers
Community responsibility
Grow our people
Customer expectations during construction
Customer expectations during operation
Public health, safety and amenity during construction
Public health, safety and amenity during operation
Cultural heritage Community outcomes
Build capacity and well being Occupational health and safety
Environmental Weighting = 34%
Protect the environment
Manage our natural resources
Air quality (excluding greenhouse gas emissions)
Greenhouse gas emissions Land and soil
Watercourse quality Water consumption Energy consumption
Appendix 3: Sources and types of GHG emissions from Water Utilities
Universally accepted scope definitions (WRI/WBCSD 2005) Scope
Designation
Ownership Level
Contributing Sources
1
2
3
Direct
Indirect
Indirect
Fuel combustion Process emissions Facility owned vehicles HVAC & Refrigeration
Purchased electricity or steam for owner use
Production of purchased materials Employee business travel
Waste disposal Outsourced activities Contractor owned vehicles Product use
Example of Sources of Greenhouse Gas Emissions from a water utility
Drinking Water Facilities Wastewater Facilities
Conveyance (pumping) Storage (pumping) Extraction (pumping)
Treatment (varying methods – chemical/other) Sludge (landfill or land)
Distribution
Collection system (pumping) Treatment (varying methods) Distribution
Biosolids (landfill; incinerated; fertilizer; other)
If on-site fuel is used/company owned vehicle usage – scope 1
Methane release from sewer – scope 1
Methane released from untreated water – scope 1
Fugitive emissions from biosolid incineration/disposal – scope 1
Ozone generation of nitrous oxide – scope 1
If power is used in activity – scope 2
Facility construction and maintenance – scope 3
Waste disposal – scope 3
Table 1: Key human actors followed
1. Environment and Technology Manager 2. Environment Manager
3. Greenhouse and Energy Specialist
4. Project Officer (within the Environment and Technology Division) 5. Treasury and Financial Analysis Manager
6. Finance Manager 7. IT Operations Manager 8. Senior Engineer
9. Design Leader 10. Feasibility Manager
Table 2: Key non-human actors followed 1. Carbon Emissions Number
2. Sustainability Assessment Scorecard 3. The Net Present Value (NPV) Model 4. Multi-criteria Analysis (MCA)
Figure 1: A screen capture of a Carbon Emissions Expense excel calculation
[image:25.595.72.533.260.504.2]