Analytical Methods
Development and validation of an APCI-MS/GC–MS approach
for the classification and prediction of Cheddar cheese maturity
Heng Hui Gan, Bingnan Yan, Robert S.T. Linforth, Ian D. Fisk
⇑Division of Food Sciences, School of Biosciences, University of Nottingham, Sutton Bonington Campus, Loughborough, Leicestershire LE12 5RD, United Kingdom
a r t i c l e
i n f o
Article history:
Received 1 February 2015
Received in revised form 16 May 2015 Accepted 19 May 2015
Available online 21 May 2015
Keywords:
Chemometric techniques Cheddar cheese Cheese maturity APCI-MS PLS-DA
Volatile aroma compounds
a b s t r a c t
Headspace techniques have been extensively employed in food analysis to measure volatile compounds, which play a central role in the perceived quality of food. In this study atmospheric pressure chemical ionisation-mass spectrometry (APCI-MS), coupled with gas chromatography–mass spectrometry (GC– MS), was used to investigate the complex mix of volatile compounds present in Cheddar cheeses of dif-ferent maturity, processing and recipes to enable characterisation of the cheeses based on their ripening stages. Partial least squares-linear discriminant analysis (PLS-DA) provided a 70% success rate in correct prediction of the age of the cheeses based on their key headspace volatile profiles. In addition to predict-ing maturity, the analytical results coupled with chemometrics offered a rapid and detailed profilpredict-ing of the volatile component of Cheddar cheeses, which could offer a new tool for quality assessment and accelerate product development.
Ó2015 The Authors. Published by Elsevier Ltd. This is an open access article under the CC BY license (http:// creativecommons.org/licenses/by/4.0/).
1. Introduction
The flavour of Cheddar cheese flavour is composed of a complex mixture of at least 180 compounds, including alcohols, aldehydes, ketones, esters, lactones, sulphides, free fatty acids and pyrazines (Curioni & Bosset, 2002), with diacetyl, (Z)-4-heptenal, methional, 2-acetyl-1-pyrroline, dimethyltrisulfide, 1-octen-3-one, (Z)-1,5-octadien-3-one, furaneol, (Z)-2-nonenal and (E)-2-nonenal, homofuraneol, acetic acid, and butyric acid identi-fied as the most potent odorants (Milo & Reineccius, 1997; Zehentbauer & Reineccius, 2002). Throughout manufacture, cheese production represents a series of finely coordinated biochemical events, which, if synchronised and balanced, leads to products with highly desirable aromas and flavours, but if not balanced, off-tastes and off-aromas will result. Cheddar cheese requires an extended period of time to mature and develop the full flavour and texture of ripened cheese.
During maturation or ripening, microbiological and biochemical changes occur; bacteria and enzymes act on the fat, protein and carbohydrate in the cheese to produce the characteristic body, tex-ture and flavour of the variety. The biochemical changes during ripening may be grouped into primary (proteolysis, lipolysis and metabolism of residual lactose, lactate and citrate) or secondary (metabolism of fatty acids and amino acids) events. It is these
secondary reactions that result in the production of volatile flavour compounds that play a significant role in the flavour of cheese (McSweeney, Ottogalli, & Fox, 2004).
1.1. Proteolysis and lipolysis in Cheddar
Cheddar cheese ripening is mainly affected by the rate and extent of proteolysis. Proteolysis involves the hydrolysis of caseins to progressively smaller peptides and free amino acids by prote-olytic enzymes such as rennet (Coker, 2003). Lactic acid bacteria (LAB) are also a major source of proteolytic enzymes in a wide vari-ety of cheeses (De Wit, Osthoff, Viljoen, & Hugo, 2005). During cheese ripening, the enzymatic degradations of proteins and pep-tides lead ultimately to the formation of flavour-impact volatiles (Papetti & Carelli, 2013).
Cheese fat affects cheese flavour in several ways: firstly by act-ing as a source of aromatic compounds or precursors and secondly as a solvent for lipophilic flavour compounds produced from cheese lipids. Lipolysis results in the formation of free fatty acids (FFA), which are key constituents of Cheddar cheese flavour and can also be precursors of flavour compounds such as methyl ketones, alcohols and lactones (Smit, Vileg, Smit, Ayad, & Engels, 2002). Fatty acids are important and are often the predominant fla-vour components of many cheese types. During ripening, free fatty acids containing four or more carbon atoms may originate from milk fat lipolysis, due to the action of the endogenous milk lipases; lactic acid bacteria, present in starter cultures, are generally only
http://dx.doi.org/10.1016/j.foodchem.2015.05.096 0308-8146/Ó2015 The Authors. Published by Elsevier Ltd.
This is an open access article under the CC BY license (http://creativecommons.org/licenses/by/4.0/). ⇑Corresponding author.
E-mail address:[email protected](I.D. Fisk).
Contents lists available atScienceDirect
Food Chemistry
weakly lipolytic. Short and moderate-chain, even numbered fatty acids significantly contribute to the characteristic note of Cheddar (Curioni & Bosset, 2002); the principal volatile fatty acids present during maturation include acetic, propanoic, butanoic, pentanoic, and hexanoic (De Wit et al., 2005). In general, much of cheese flavour is generated during lipolysis and proteolysis in addition to the catabolism of lactose and citrate by cheese micro flora.
Cheese maturation is a continuous process whereby cheese tex-ture, flavour and aroma develop further over a period of time. For some cheese types the length of time of ripening is regulated by the development of certain attributes such as aroma and texture which are used to categorise the cheese prior to sale as mild, med-ium, mature, extra mature or vintage.
1.2. Chemometrics for dairy classification
There are manufacturing processes (e.g., addition of adjunct cul-tures) that can be applied to accelerate the rate of ripening. In these circumstances, methods for determining or predicting matu-rity are particularly useful (Coker, Crawford, Johnston, Singh, & Creamer, 2005). Reverse phase high-performance liquid chro-matography (RP-HPLC) has been previously used to match cheeses to their maturity categories (Pham & Nakai, 1984). Various authors have also published studies on the classification of Cheddar cheese on the basis of maturity and quality.O’Shea, Uniacke-Lowe, and Fox (1996)used RP-HPLC to analyse the retentate and permeate of the water-soluble fractions (WSF) of 60 Cheddar cheese samples that varied in age and quality as determined by cheese graders but received poor differentiation of maturity. In addition there have been recent attempts using casein, peptide and amino acid profiles produced via electrophoretic and chromatographic methods to show correlations between sensory and instrumental textural information. Multivariate statistics have been applied to determine the influence of different manufacturing processes, types of raw
milk and the incorporation of adventitious non-starter lactic acid bacteria strains on proteolysis and maturation (Ardo, Thage, & Madsen, 2002; Furtula, Nakai, Amantea, & Laleye, 1994; Skeie, Lindberg, & Narvhus, 2001), to provide information on the charac-teristics of the specific Cheddar cheese.
A rapid, simple, and reliable sample preparation method and FT-IR technique was developed for analysis of Cheddar cheese fla-vour quality. The infrared spectra could be correlated to specific flavour notes, such as fermented, sour, and unclean, and differenti-ated using multivariate classification models. This technique could then be used for the detection of flavour quality defects in Cheddar cheese and showed great promise as a rapid and simple tool for cheese analysis. Fourier-transform infrared microspectroscopy combined with multivariate analysis has also been employed to monitor the effect of adjunct cultures during Swiss cheese ripening.
Changes in sensory properties of Cheddar cheese during matu-ration were profiled by Muir, Hunter, Williams, and Brennan (1998)to give manufacturers an understanding of the quality of their individual cheeses. However there is no ‘best’ combination of analytical and statistical methods that can be used for every situation.
The aim of this research was to evaluate direct injection atmo-spheric pressure chemical ionisation-mass spectrometry (APCI-MS) coupled with gas chromatography–mass spectrometry (GC–MS) for its ability to identify and characterise the aroma vola-tiles of commercial Cheddar cheese manufactured in UK and pre-dict the labelled age of Cheddar cheese using PLS-DA (partial least square-linear discriminant analysis) models. This will serve to complement sensory derived data sourced from trained panel-lists or experienced cheese graders.
2. Materials and methods
Five different commercial Cheddar cheese brands (coded V, W, X, Y, Z) comprising of five maturity grades: mild (MI), medium (ME), mature (M), extra mature (EM) and vintage (V) were ripened at 3–4 months, 10–12 months, 14 months and 18–36 months respectively. Cheeses were grated and about a gram of cheese alone was placed into glass bottles for headspace analysis. A total of 52 Cheddar cheese samples (with triplicates) was prepared and stored at 4°C until analysed; samples were selected to cover the breadth of the UK Cheddar market and included major UK Cheddar brands.
2.1. GC–MS analysis
[image:2.595.43.293.485.734.2]Headspace solid phase microextraction (HS-SPME) coupled to gas chromatography–mass spectrometry (GC–MS) was applied to analyse the volatile compounds of Cheddar cheese samples. An automated SPME sampling unit (CombiPal. Zwingen, Switzerland) was used with a 2-cm length StableFlex SPME fibre with 50/30
lm divinylbenzene/Carboxen on polydimethylsiloxane
coat-ing (DVB/CAR/PDMS), purchased from Supelco (Bellefonte, PA). This was exposed to the headspace for 30 min. The cheese samples were stirred for 30 min at 60°C to accelerate the equilibrium of headspace volatile compounds between the cheese matrix and the headspace. Analysis of the volatiles was performed on a Trace GC Ultra (Thermo Scientific, Waltham, MA) that was attached to an ISQ series mass spectrometer (Thermo Scientific), carried out in electron ionisation mode with an ion source temperature of 200°C, and a scanned mass range of m/z15–200. The gas chro-matograph was equipped with a ZB-Wax fused silica capillary col-umn (100% polyethylene glycol phase, 30 m0.25 mm1.0lm;
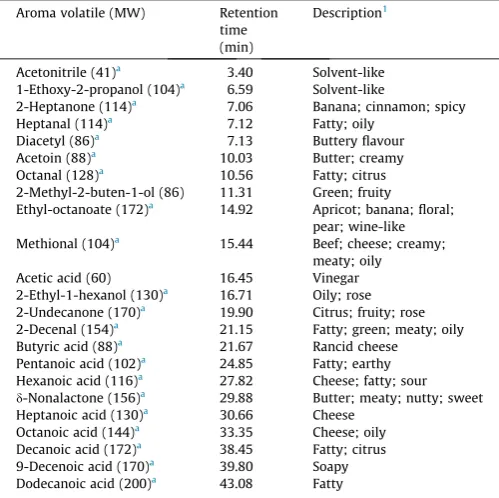
Phenomenex, Torrance, CA). The GC oven was held at 40°C forTable 1
Volatile compounds (MW, molecular weight) identified in the headspace above grated Cheddar cheese using SPME-GC–MS.
Aroma volatile (MW) Retention time (min)
Description1
Acetonitrile (41)a
3.40 Solvent-like 1-Ethoxy-2-propanol (104)a 6.59 Solvent-like
2-Heptanone (114)a 7.06 Banana; cinnamon; spicy
Heptanal (114)a
7.12 Fatty; oily Diacetyl (86)a
7.13 Buttery flavour
Acetoin (88)a
10.03 Butter; creamy Octanal (128)a
10.56 Fatty; citrus 2-Methyl-2-buten-1-ol (86) 11.31 Green; fruity Ethyl-octanoate (172)a 14.92 Apricot; banana; floral;
pear; wine-like Methional (104)a
15.44 Beef; cheese; creamy; meaty; oily
Acetic acid (60) 16.45 Vinegar
2-Ethyl-1-hexanol (130)a
16.71 Oily; rose
2-Undecanone (170)a
19.90 Citrus; fruity; rose 2-Decenal (154)a 21.15 Fatty; green; meaty; oily
Butyric acid (88)a 21.67 Rancid cheese
Pentanoic acid (102)a
24.85 Fatty; earthy Hexanoic acid (116)a
27.82 Cheese; fatty; sour
d-Nonalactone (156)a
29.88 Butter; meaty; nutty; sweet Heptanoic acid (130)a
30.66 Cheese
Octanoic acid (144)a
33.35 Cheese; oily
Decanoic acid (172)a 38.45 Fatty; citrus
9-Decenoic acid (170)a
39.80 Soapy
Dodecanoic acid (200)a
43.08 Fatty
1
Whetstine et al. (2006). a
2 min then heated to 250°C at 4°C/min. The GC to MS transfer line was maintained at 250°C. Helium was the carrier gas with a con-stant flow rate of 1.0 mL/min in splitless mode. Cheddar cheeses were analysed in triplicate. Aroma compounds were identified by comparison of their retention times with authentic standards and validated against a mass spectral library (NIST/EPA/NIH).
2.2. APCI-MS
The cheese samples were analysed in full scan mode, using the MS Nose interface (Micromass, Manchester, UK) fitted to a Quattro Ultima mass spectrometer (Waters Corporation, Milford, MA) (Fe rnández-Vázquez et al., 2013). Following the method described byGan, Soukoulis, and Fisk (2014), ions of mass to charge (m/z) ratios from 40–200 were monitored. The intensity of these ions was measured at a cone voltage of 20 V, source temperature of 75°C and dwell time of 0.5 s. All analyses were run in triplicate (Ashraf, Linforth, Bealin-Kelly, Smart, & Taylor, 2010).
2.3. Statistical analysis
Data from MS Nose were exported using Waters Masslynx™ Software version 4.1, whereas data from GC–MS were processed with Thermo Scientific™ Xcalibur™ Software prior to chemometric analysis using The Unscrambler software (version 9.7, CAMO AS, Norway). The chemometric approach composed of principal com-ponent analysis (PCA) and partial least squares regression (PLS) performed with full cross validation to classify the maturity of the cheese. Full cross validation is an evaluation tool to check cal-ibration models, based on systematically removing samples in the model and testing the performance of the model using the remain-ing data set. The maximum number of factors in both PCA and PLS models were selected by the criterion of the lowest number of fac-tors that gave the closest to minimum value of predicted residual error sum of squares function, in order to avoid over fitting of the data (Cozzolino et al., 2008). All variables were weighted (1/standard deviation) prior to chemometrics application, so that drifts and baseline effects were removed. PLS regression was used to determine the relationship between multiple dependent predictor variables (GC and APCI data) and the maturity/age of
cheese. Furthermore it was used as an exploratory analysis tool to select suitable predictor variables for predictive linear modelling. PLS was applied to model the maturity/ age of cheese using those aroma volatiles with predictive ability.
3. Results and discussion
3.1. Headspace analysis by GC–MS and APCI-MS
Twenty-three volatile aroma compounds were detected and identified in the headspace of the grated Cheddar cheeses (Table 1) by SPME-GC–MS. These compounds were mainly aldehy-des, ketones and carboxylic acids, which were found to be similar to previously published data for the characteristic flavour profile of aged cheeses (Biasioli et al., 2006; Coker et al., 2005; Milo & Reineccius, 1997; Whetstine, Drake, Nelson, & Barbano, 2006; Zehentbauer & Reineccius, 2002).
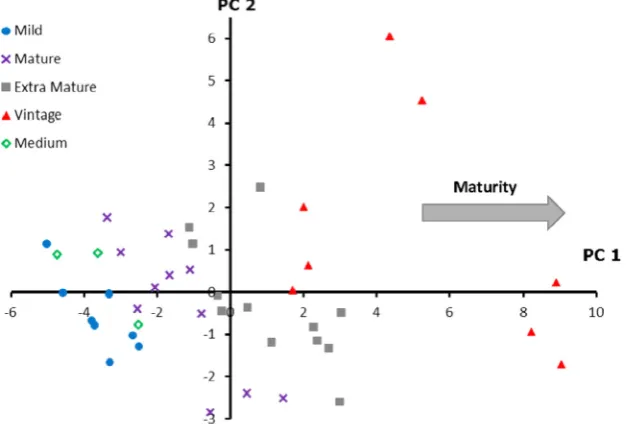
Principal component analysis (PCA) was performed to evaluate the variance associated with the samples as described by the GC– MS and APCI-MS data. Forty-two calibration Cheddar cheese sam-ples and a total of 47 key volatiles (both GC–MS and APCI-MS) that exhibited significance in classifying Cheddar maturity were used. Interpretation of the dimensions of the PCA was facilitated by inspection of the vector loadings and the correlation coefficients of the scores of the cheese samples to avoid overfitting. As shown inFig. 1, the first principal component (PC1) accounted for 28% of the aroma compounds and was mainly associated with maturity. PC1 and PC2 accounted for 35% of total variance of the spectral data. The lowest residual variance was found with 7 PCs, however the model using 2 PCs appeared sufficiently robust and explicit, containing variables from GC–MS and APCI-MS to illustrate the maturity of the cheeses.
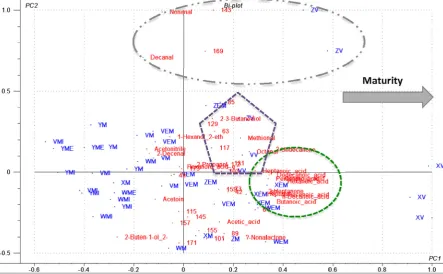
[image:3.595.135.450.511.723.2]As the Cheddar matures, more aroma volatiles, especially acids (such as butanoic, pentanoic, hexanoic acids) and ketones, like 2-heptanone, 2-undecanone, were produced (indicated by the smaller oval inFig. 2). The more mature cheeses also displayed an apparent cheesier, meatier and more fatty profile with higher concentrations of characteristic aromas, such as 2,3-butanediol, octanal and methional (a common sulphur-compound in cheese marked by the pentagon inFig. 2). This corresponds to previously
published work identifying the potent aroma compounds in Cheddar cheese, in which methional was shown to be a potent aroma compound. The apparent lack of other potent aroma com-pounds previously identified is of interest and probably illustrates the variation in abundance in natural products, this is further sup-ported by the disparity in potent aroma compounds identified by different groups on different Cheddar cheeses (Milo & Reineccius, 1997; Zehentbauer & Reineccius, 2002); interestingly both papers herein cited found methional as a potent aroma compound in addi-tion to a number of other compounds, most of which were differ-ent between the papers.
The biplot shown in Fig. 2provides an insight into the role played by the raw APCI-MS data. It shows a positive relationship for the ester peaks (m/z= 117,m/z= 131,m/z= 85,m/z= 103) with the vintage series (V) (marked by the pentagon in Fig. 2). Even though APCI-MS could not provide unambiguous identification of aroma compounds, literature data and comparison with other data enabled the tentative identification of many peaks. The protonated masses m/z= 89 (butanoic acid), m/z= 101 (2-hexanone), m/z= 155 (decanoic acid) and m/z= 157 (2-decanone) appeared to be important volatiles that contribute to cheese profiles (Biasioli et al., 2006). Overall ripening resulted in a progressive increase in aroma in the headspace of the Cheddar cheeses.
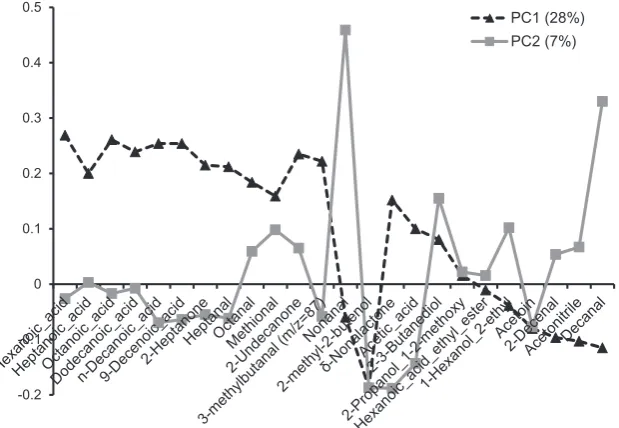
Alignment to PC1 and PC2 provided evidence of the relative importance of each of the aroma volatile to the groups of Cheddar cheese samples. Increasing levels of butanoic, pentanoic, hexanoic, heptanoic, octanoic, decanoic, 9-decenoic, dodecanoic acids, 2-heptanone, heptanal, octanal, methional, 2-undecanone and 3-methylbutanal (m/z= 87) were correlated with PC1; whereas nonanal and 2-methyl-2-buten-1-ol were aligned with PC2 (Fig. 3). Whilst there were some brand-specific differences (ZV cheeses were rich in nonanal), there was a general consensus across the brands and a strong correlation of PC1 with maturity.
Whetstine et al. (2006)had also identified these acids as predom-inant odorants in aged Cheddar,Christensen and Reineccius (1995)
identified 3-methyl-butanal, ethyl butyrate (m/z= 117) and 1-octen-3-ol (m/z= 129) as 3 of the 25 potent odorants in aged Cheddar; these aromas were seen to have strong relationships with the vintage Cheddar group. 2-Methyl-2-buten-1-ol and d-nonalactone on PC2 were also significant, but more associated with the mature (M) categories of cheese.
Acetoin is the major volatile compound in the headspace of fresh milk which was seen to decrease with ripening, presumably due to its reduction to 2-propanol and 2,3-butanediol, as a result of fermentation by adventitious bacteria (Dimos, Urbach, & Miller, 1996). Keen, Walker, & Pederby, 1974also showed that diacetyl (2,3-butanedione), with a protonated mass of 87, is a nat-ural by-product of fermentation, which was dominant in the more mature Cheddar cheeses, especially the Extra Mature ones (marked by small oval) on the right hand side of the PCA biplot (Fig. 2).
Acetic acid is the major free alkanoic acid in Cheddar. A steady increase in the level of acetic acid over the whole period of matu-ration was discovered previously by two groups (Dimos et al., 1996; Urbach, 1993). This was depicted inFig. 2where acetic acid was correlated to Cheddar of mature grade. Diacetyl formed from the dehydration of 2,3-butanediol, is a common volatile present in dairy products and showed a close association with the mild Cheddar cheese; 2,3-butanediol had a positive correlation with the more matured Cheddar ‘ZV’ (Fig. 2).
3.2. Prediction of Cheddar cheese maturity
[image:4.595.80.524.71.345.2]GC–MS and APCI-MS were able to successfully build a predic-tive model for maturity across the broad range of samples used within the model. Hence, PLS regression models were built to interpret and predict the age of Cheddar cheese using headspace
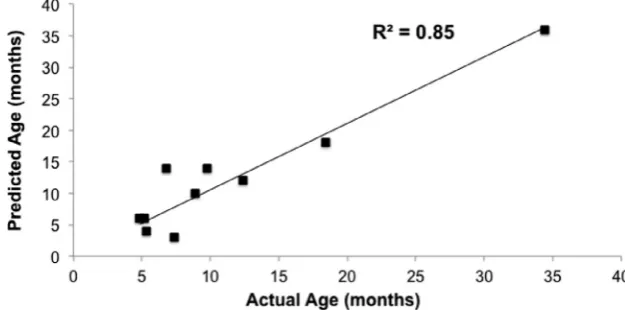
data from GC–MS and APCI-MS. PLS combines the properties of multiple linear regression and PCA to make linear combinations in the dependent matrix. By means of these regression models, the relationships between aroma compounds and the age/maturity of Cheddar cheese were established. Parameters used to evaluate the models prediction ability were: root mean square error predic-tion (RMSEP) and coefficient of determinapredic-tion (r2) for the derived model between actual and predicted Y-variables (Capone et al., 2013). RMSEP indicates the absolute fit of the model to the data and is a good measure of how accurately the model predicts the response. The RMSEP andr2values for the prediction model were 3.94 and 0.85 respectively.
2-methyl-2-buten-1-ol, hexanoic acid, heptanoic acid, octanoic acid, 9-decenoic acid, acetoin and 2-decenal were statistically sig-nificant in predicting the age/maturity of Cheddar cheese in the predictive model. The development of acids in extra mature and vintage cheeses seems to be the main driver that differentiates the classified age of the cheese. Furthermore, 2-decenal and
acetoin distinguished the mature cheeses from the mild and med-ium ones (Fig. 2). Lipolysis, during maturation, results in the for-mation of free fatty acids (FFA), which are key constituents of Cheddar cheese flavour. The estimates of Cheddar cheese age sup-plied by the manufacturers, compared to those predicted by the PLS model for the 10 prediction samples used, are shown in
Fig. 4, where the age of the Cheddar was 70% correctly predicted. For the validation of the method for cheese graders and its poten-tial use as a rapid screening tool within new product development, the predictive power of the herein constructed model was satisfac-tory, but we recommend further validation prior to commercial use.
It is well known that there are several environmental factors in addition to processing strategies and production practices, which contribute to the final free fatty acids (FFA) content within cheeses. These include the milk quality, seasonal variation, heat treatment, lactic acid starters used, ripening and storage temperature, brine concentration and enzymes found in rennet. It is therefore very -0.2
-0.1 0 0.1 0.2 0.3 0.4 0.5
[image:5.595.139.449.68.282.2]PC1 (28%) PC2 (7%)
Fig. 3.PLS-DA loadings for the first two factors of the classification models based on both the GC–MS and APCI-MS data obtained by the static headspace analysis of the Cheddar cheeses.
0 5 10 15 20 25 30 35 40
0 5 10 15 20 25 30 35 40
VEM VMI WME WMI XM YM YME ZEM ZM ZV
Indicated
[image:5.595.117.467.333.520.2]Predicted
promising that despite not knowing the manufacturing conditions for the cheeses, a model could be developed with a prediction coef-ficient of determination (r2) of 0.85 for predictive age against actual storage (Fig. 5).
4. Conclusion
GC–MS and APCI-MS headspace analysis were fast (200–500 samples per day) and effective techniques for determining aroma compounds relevant to Cheddar cheese. Characterisation of Cheddar cheese maturity based on headspace measurements using GC–MS and/ or APCI-MS combined with chemometric treatment of data was shown to be effective when presented within a PCA for-mat. With the PLS-DA chemometric approach, it was possible to classify and predict the age of the Cheddar cheeses on the basis of their headspace aroma. The PLS model generated was robust enough to accurately predict 70% of the Cheddar cheeses using the aroma compounds from the headspace data alone. This further established the applicability of this multivariate statistical tech-nique as a tool to monitor the quality of foodstuffs.
Acknowledgements
Some of the methods utilised were developed under the BBSRC Doctoral Training Partnership BB/F017014/1.
References
Ardo, Y., Thage, B. V., & Madsen, J. S. (2002). Dynamics of free amino acid composition in cheese ripening.Australian Journal of Dairy Technology, 57, 109–115.
Ashraf, N., Linforth, R. S. T., Bealin-Kelly, F., Smart, K., & Taylor, A. J. (2010). Rapid analysis of selected beer volatiles by atmospheric pressure chemical ionisation-mass spectrometry.International Journal of Mass Spectrometry, 294, 47–53. Biasioli, F., Gasperi, F., Aprea, E., Endrizzi, I., Framondino, V., Marini, F., Mott, D., &
Mark, T. D. (2006). Correlation of PTR-MS spectral fingerprints with sensory characterisation of flavour and odour profile of ‘Trentingrana’ cheese.Food Quality and Preference, 17, 63–75.
Capone, S., Tufariello, M., Francioso, L., Montagna, G., Casino, F., Leone, A., & Siciliano, P. (2013). Aroma analysis by GC/MS and electronic nose dedicated to Negroamaro and Primitivo typical Italian Apulian wines.Sensors and Actuators B: Chemical, 179, 259–269.
Christensen, K. R., & Reineccius, G. A. (1995). Aroma extract dilution analysis of aged Cheddar cheese.Journal of Food Science, 60(2), 218–220.
Coker, C. (2003).Objective differentiation of cheese type and maturity. New Zealand: Massey University.
Coker, C., Crawford, R., Johnston, K., Singh, H., & Creamer, L. (2005). Towards the classification of cheese variety and maturity on the basis of statistical analysis of proteolysis data – A review.International Dairy Journal, 15, 631–643. Cozzolino, D., Smyth, H. E., Cynkar, W., Janik, L., Dambergs, R. G., & Gishen, M.
(2008). Use of direct headspace-mass spectrometry coupled with chemometrics
to predict aroma properties in Australian Riesling wine.Analytica Chimica Acta, 621, 2–7.
Curioni, P. M. G., & Bosset, J. O. (2002). Key odorants in various cheese types as determined by gas chromatography-olfactometry.International Dairy Journal, 12(12), 959–984.
De Wit, M., Osthoff, G., Viljoen, B. C., & Hugo, A. (2005). A cpmparative study of lipolysis and proteolysis in Cheddar cheese and yeast-innoculated Cheddar cheeses during ripening.Enzyme and Microbial Technology, 606–616. Dimos, A., Urbach, G. E., & Miller, A. J. (1996). Changes in flavour ad volatiles of
full-fat and reduced-full-fat Cheddar cheeses during maturation.International Dairy Journal, 6, 981–995.
Fernández-Vázquez, R., Linforth, R., Hort, J., Hewson, L., Vila, D. H., Heredia Mira, F. J., Vicario, I. M., & Fisk, I. (2013). Headspace delivery of limonene from the serum and non-serum fractions of orange juice in-vitro and in-vivo.LWT – Food Science and Technology, 51(1), 65–72.
Furtula, V., Nakai, S., Amantea, G. F., & Laleye, L. (1994). Reverse-phase HPLC analysis of reference Cheddar cheese samples for assessing accelerated cheese ripening.Journal of Food Science, 59, 533–538.
Gan, H. H., Soukoulis, C., & Fisk, I. (2014). Atmospheric pressure chemical ionisation mass spectrometry analysis linked with chemometrics for food classification – A case study: Geographical provenance and cultivar classification of monovarietal clarified apple juices.Food Chemistry, 146, 149–156.
Keen, A. R., Walker, N. J., & Pederby, M. F. (1974). The formation of 2-butanone and 2-butanol in Cheddar cheese.Journal of Dairy Research, 41, 249–257. McSweeney, P. L. H., Ottogalli, G., & Fox, P. F. (2004). Diversity of cheese
varieties: An overview. In P. L. H. M. T. M. C. Patrick F. Fox & P. G. Timothy (Eds.), Cheese: Chemistry, Physics and Microbiology, vol. 2 (pp. 1–23): Academic Press.
Milo, C., & Reineccius, G. A. (1997). Identification and quantification of potent odorants in regular-fat and low-fat mild Cheddar cheese.Journal of Agricultural and Food Chemistry, 45(9), 3590–3594.
Muir, D. D., Hunter, E. A., Williams, S. A. R., & Brennan, R. M. (1998). Sensory profiles of commercial fruit juice drinks: Influence of sweetener type.Journal of the Science of Food and Agriculture, 77(4), 559–565.
O’Shea, B. A., Uniacke-Lowe, T., & Fox, P. F. (1996). Objective assessment of Cheddar cheese quality.International Dairy Federation Bulletin, 6, 1135–1147. Papetti, P., & Carelli, A. (2013). Composition and sensory analysis for quality
evaluation of a typical Italian cheese: Influence of ripening period.Czech Journal of Food Science, 31(5), 438–444.
Pham, A.-M., & Nakai, S. (1984). Application of stepwise discriminant analysis to high pressure liquid chromatography profiles of water extract for judging ripening of Cheddar cheese.Journal of Dairy Science, 67(7), 1390–1396. Skeie, S., Lindberg, C., & Narvhus, J. (2001). Development of amino acids and organic acids in Norvegia, influence of milk treatment and adjunct Lactobacillus. International Dairy Journal, 11, 399–411.
Smit, G., Vileg, J. E. T. V. H., Smit, B. A., Ayad, E. H. E., & Engels, W. J. M. (2002). Fermentative formation of flavor compounds by lactic acid bacteria.Australian Journal of Dairy Technology, 57, 61–68.
Urbach, G. (1993). Relations between cheese flavour and chemical composition. International Dairy Journal, 3, 389–422.
Whetstine, M. E. C., Drake, M. A., Nelson, B. K., & Barbano, D. M. (2006). Flavour profiles of full-fat and reduced-fat cheese and cheese fat made from aged Cheddar with the fat removed using a novel process.Journal of Dairy Science, 89, 505–517.
[image:6.595.141.454.69.224.2]Zehentbauer, G., & Reineccius, G. A. (2002). Determination of key aroma components of Cheddar cheese using dynamic headspace dilution assay. Flavour and Fragrance Journal, 17(4), 300–305.