ORIGINAL ARTICLE
Characterization of shape and dimensional accuracy
of incrementally formed titanium sheet parts with intermediate
curvatures between two feature types
Amar Kumar Behera1&Bin Lu2,3&Hengan Ou1
Received: 24 May 2015 / Accepted: 22 July 2015 / Published online: 6 August 2015 #Springer-Verlag London 2015
Abstract Single point incremental forming (SPIF) is a rela-tively new manufacturing process that has been recently used to form medical grade titanium sheets for implant devices. However, one limitation of the SPIF process may be character-ized by dimensional inaccuracies of the final part as compared with the original designed part model. Elimination of these inaccuracies is critical to forming medical implants to meet required tolerances. Prior work on accuracy characterization has shown that feature behavior is important in predicting ac-curacy. In this study, a set of basic geometric shapes consisting of ruled and freeform features were formed using SPIF to char-acterize the dimensional inaccuracies of grade 1 titanium sheet parts. Response surface functions using multivariate adaptive regression splines (MARS) are then generated to model the deviations at individual vertices of the STL model of the part as a function of geometric shape parameters such as curvature, depth, distance to feature borders, wall angle, etc. The generat-ed response functions are further usgenerat-ed to prgenerat-edict dimensional deviations in a specific clinical implant case where the curva-tures in the part lie between that of ruled feacurva-tures and freeform
features. It is shown that a mixed-MARS response surface mod-el using a weighted average of the ruled and freeform surface models can be used for such a case to improve the mean pre-diction accuracy within ±0.5 mm. The predicted deviations show a reasonable match with the actual formed shape for the implant case and are used to generate optimized tool paths for minimized shape and dimensional inaccuracy. Further, an im-plant part is then made using the accuracy characterization functions for improved accuracy. The results show an improve-ment in shape and dimensional accuracy of increimprove-mentally formed titanium medical implants.
Keywords Single point incremental forming . Accuracy . Ellipsoids . Titanium implants . MARS
1 Introduction
Titanium is the material of choice in class III medical implants due to its biological inertness, strength, lightweight nature, bio-compatibility, and low-cost production [1]. Forming tita-nium into desired implant shapes within a specific time-frame is therefore of fundamental importance to clinical practice. To enable this, one relatively new manufacturing technique that has come forth is incremental sheet forming (ISF). Typically, in ISF, a hemispherical tool is used to deform a flat sheet in steps following a toolpath tailored to the geometry to be formed on a computer-numeric controlled (CNC) machine. ISF can be done in many different ways, as shown in Fig.1. Variants include the use of a counter-support tool and use of dies, either full or partial. A number of efforts have been made to manufacture implants and supports for different parts of the human body using ISF such as the skull [2–5], knee [6], face [7], and ankle support [8] using ISF.
* Amar Kumar Behera
Bin Lu
Hengan Ou
Department of Mechanical, Materials and Manufacturing Engineering, Faculty of Engineering, University of Nottingham, Nottingham NG7 2RD, UK
2
Institute of Forming Technology and Equipment, Shanghai Jiao Tong University, Shanghai 200030, China
Process optimization efforts in the field of incremental forming have been focused on three key aspects: enhanced process limits, improved accuracy, and uniformity in sheet thickness [10]. The generation of intelligent toolpath strategies has been the key to improved part manufacture in all of these aspects. Process limits were enhanced using multi-step toolpaths as illustrated by Duflou et al. [11]. The use of helical toolpaths as shown by Skjødt et al. [12] and Cao et al. [13] helps eliminate scarring caused by the tool stepping down in a contouring toolpath. Bambach et al. [14] proposed the use of generating toolpaths on compensated part geometries to im-prove the accuracy, while Li et al. [15] have shown that a multi-stage process can result in improved thickness distribu-tion in incrementally formed parts.
Despite a number of efforts to make medical implant shapes using ISF [2–8], making these parts with high accuracy has been a problem. Even though Behera et al. [2] tried forming implant shapes with high forming angles with im-proved accuracy, the part made of titanium grade II failed. The work of Göttmann [3] illustrated the ability to form im-plants with a maximum deviation at the edges just less than 2 mm using two point incremental forming (TPIF). Despite these efforts, no definite characterization of freeform surfaces
and titanium implants made by ISF is currently available. Some accuracy characterization techniques are available. The-se include the uThe-se of multivariate adaptive regression splines (MARS) within a feature-based framework for predicting the behavior of simple features and feature interactions [16] and a local geometry matrix to predict spring back [17].
Earlier, Verbert et al. proposed the use of a feature-based approach to form parts with high accuracy [18]. In this ap-proach, four basic geometric features were identified based on principal curvatures in the part, viz.: planar, ruled, freeform, and ribs. While this study provided an overall schematic for carrying out part compensation in order to optimize the toolpaths needed to form the part accurately, it did not cover the specific steps of identifying the relevant geometric param-eters and error correction functions necessary for each feature type. Likewise, the work of Behera et al. [16,19] was limited to studies on planar and ruled features and aluminum and low carbon steel alloys. Micari et al. [20] and Essa et al. [21] outlined various process strategies to improve accuracy in incremental forming. An in-process online correction strategy was laid out by Rauch et al. [22] which was limited to correcting the depth accuracy of the parts. Lu et al. [23] showed that the use of critical edges in generating toolpaths can improve surface quality, forming time, and geometric ac-curacy in specific cases. Despite a number of efforts, these works did not provide any methods for predicting inaccuracy in freeform implant shapes. Furthermore, titanium is a mate-rial not covered by current accuracy models.
To overcome the limitations of the current accuracy char-acterization techniques, an effort is made in this work to gen-erate accuracy response surfaces for freeform shapes. This is done by studying the accuracy behavior of ellipsoidal shapes formed using single point incremental forming (SPIF), which is one of the process variants of ISF. The major and minor axes of the ellipsoids are used as parameters in the characterization models generated using MARS. To account for the effect of presence of multiple features in a part, a mixed model using an index generated from principal curvatures of points in the part is also proposed. These models are then used to predict accu-racy behavior of new implant geometries and the predicted behavior is then used to compensate for the inaccuracy of formed parts. All parts made in this research are formed using uni-directional contouring tool paths with a uniform scallop height between successive contours, where scallop height is a parameter that determines surface quality as shown in Fig.2.
2 Accuracy characterization methodology
The accuracy of a part formed by incremental forming is typ-ically determined by measuring the same with metrology tools such as a laser scanner or a coordinate measuring machine. After carrying out this measurement, a point cloud Fig. 1 Incremental forming in its three different process variants
[image:2.595.52.289.52.380.2]representing the part can be generated and this point cloud can be meshed and then compared with a mesh representing a nominal model obtained from the computer-aided design (CAD) model of the part. The measurement process with a point cloud gives the coordinates of the formed part, which is a large data set, often as high as 100,000–500,000 points for a single part. Hence, the deviations with respect to the CAD model also form a large dataset. These deviations can thus be modeled as function of geometrical parameters for points on the surface of the nominal model. However, to do this, a robust, statistical tool for high dimensional data is needed.
Some tools that are currently available and used in model-ing of high dimensional data include generalized additive models (GAM), multivariate adaptive regression splines (MARS), minimax probability machine regression (MPMR), and least square support vector machine (LSSVM) [24]. Of these, MARS has already been used to generate models of accuracy behavior in planar and ruled features made with
specific materials such as AA 3103 and DC01 [19]. This tech-nique was also applied in the current study.
Figure3shows a schematic of the accuracy characterization methodology. Training set CAD models are used within a CAM software such as Siemens Unigraphics NX to generate an un-compensated toolpath. This toolpath may need to be post proc-essed into the machine tool format and then fed to a CNC machine tool used for incremental sheet forming. The formed part from the ISF machine tool is then scanned with a metrology tool such as a co-ordinate measuring machine (CMM) or a laser scanner to generate a point cloud, which is then fed to a metrol-ogy software such as GOM Inspect. This software compares the training set CAD model to the mesh generated from the point cloud generated from the CMM to yield an accuracy data file. This accuracy file is fed to a custom STL processing software for incremental sheet forming built in Visual C# to carry out the current study. This software detects features in the part, using the criteria discussed later in Section2.3, and also calculates geometrical parameters such as wall angle, principal curvatures, etc. which are discussed in Section2.2depending on the type of detected feature. The accuracy data is then linked to the training set CAD model using KDTrees. KDTrees are multi-dimensional binary search trees which can carry out quick spa-tial comparisons between two data sets using an associative searching technique [25]. Each vertex in the nominal training set CAD model is linked to a vertex on the measured CAD model closest to the nominal vertex. This is necessary as the geometrical parameters are calculated for points on the nominal model while the accuracy data file consists of deviations for measured data points and hence, the linking process links accu-racy data to geometrical parameters. This linked data set is then exported to a data file which is fed to the statistical software“R” for generating accuracy response surface using MARS. Fig. 2 Scallop height in incremental forming; three passes of the tool: 1,
2, and 3 are shown;Δz is the step down increment between tool paths 2 and 3 whileΔh is the scallop height
[image:3.595.51.288.53.186.2] [image:3.595.233.542.484.711.2]In this study, MARS models are generated as a sum of basis spline functions which are chosen using a forward pass and backward pruning step. The basis functions take one of three forms: (a) constant, (b) hinge functions of the type max(0,x-k) or max(0,k-x) where k is constant called the“knot”, (c) prod-uct of hinge functions. To generate the MARS models, the statistical package“Earth”available within the software“R” is used [26]. It was important to find out suitable parameters to characterize the accuracy, and this is described in Section2.1.
2.1 Model parameters
To build regression models, geometric and process-related var-iables need to be selected that potentially affect the accuracy behavior of the formed part. In prior work for planar and ruled features, it has been shown that the distance to the feature bor-ders affects the accuracy behavior [26]. In the case of freeform features, the obvious problem is the lack of a generic defining distance in the horizontal plane of the backing plate as freeform surfaces do not have an immediately obvious symmetry and as such a defining distance can be problematic in characterizing the accuracy. However, when we consider the case of a cranial implant, we observe that the shape of the implant can be thought of as being close to that of an ellipsoid (Fig.4a), char-acterized by a major axis and minor axis. This observation was further supplemented by experimental results, discussed later in Section3, which showed that the accuracy in the direction of the major axis was different from the accuracy in the direction of the minor axis at a specific cross-sectional depth. It may also be noted that for ruled features, the maximum principal ture is a model parameter, while the minimum principal curva-ture is zero with a tolerance value and hence, not a model parameter. In freeform surfaces, both principal curvatures have a finite value and hence, both can be included as parameters in the modeling. The accuracy behavior of ruled features that have close resemblance with a cranial implant is modeled by design-ing extruded drafts of ellipses, as shown in Fig.4b.
The following parameters are thus used to predict the 3D deviation from the CAD model at a point:
1. normalized distance from the point to the bottom of the feature (do=B/(A+B)),
2. total vertical length of the feature at the vertex (dv=(A+B) in Fig.4),
3. major axis length on slicing the feature at the depth of the point (lmax=C)
4. minor axis length on slicing the feature at the depth of the point (lmin=D)
5. maximum curvature at the point,kmax
6. minimum curvature at the point,kmin
7. wall angle at the vertex (in radians),α
8. angle of the tool movement with respect to the rolling direction of the sheet (in radians),ω
Of these, the minimum curvature for ruled surfaces by def-inition is zero with a tolerance and hence is not a parameter in the modeling for ellipse drafts.
2.2 Experimental details
A hemispherical tool of radius 5 mm was used for all the tests along with a feedrate of 2 m/min. A soft low melting-point paste lubricant, Rocol RTD Compound, was applied during the pro-cess. Four ellipsoids were used for training the models for freeform features with major and minor axis diameters 110× 60, 110×70, 110×90, and 90×60 (all dimensions in millime-ters). Likewise, twelve ellipse drafts representing ruled features were made using the same major and minor axis diameters and wall angles of 15°, 30°, and 45° for each diameter combination. All parts were made in grade 1 titanium alloy of thickness 0.5 mm. A backing plate with an elliptical cross-section corre-sponding to the dimensions of the top contour of the part was used for each test. A contouring tool path with constant scallop height of 0.05 mm was used for forming the parts. The formed parts were unclamped and measured with a 3D coordinate mea-suring machine to generate point clouds representing the formed part shape. In the current work, the sheets used are thin and so the deformation on unclamping is significant. Hence, it is important to develop models for the net effect of deviations due to plastic deformation while forming and deviations due to unclamping.
2.3 Feature detection thresholds
The file format used within this research consists of triangu-lated representation of the part’s surface known as the STL
(a)
(b)
[image:4.595.55.311.569.704.2](stereolithography) format. The detection of features relevant to incremental forming requires the segmentation of the part’s surface based on curvature calculations performed at individ-ual vertices. These curvature calculations are done following the procedure outlined by Cohen-Steiner [27,28]. The curva-ture tensor at a vertexvcan be calculated as:
Λð Þ ¼v 1
A
j jedges∑ β
e
ð Þke∩Ak ee
T
e
k k2 ð1Þ
where |A| is the surface area of the spherical zone of influence of the tensor and β(e) is the signed angle between the normal vectors of the STL facets connected by the edge e. The weight for the contribution by each edge is given by the factor e∩A. The normal at each vertex is estimated as the eigenvector of Λ(v) evaluated by the eigenvalue of minimum magnitude. The other two eigenvalues, kmin and kmax, provide estimates of
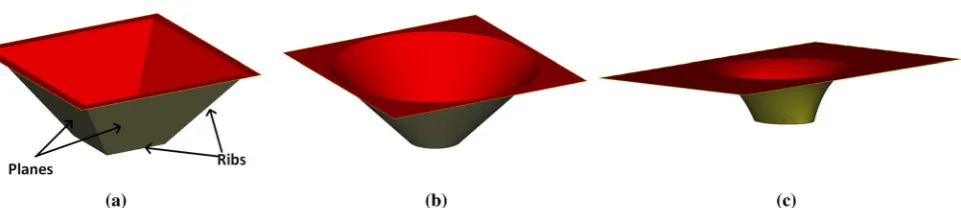
the minimum and maximum principal curvatures at v. Using these principal curvatures, the part can be split up into features using the following classification criteria [29]:
Planar feature:kpmin= 0±εpandkpmax= 0±εp, whereεpis a small number that can be tuned for identifying planar features
Ruled feature: kpmin= 0±εr andkpmax= X, whereX is a positive non-zero variable. Another possible case is wherekpmin= Xand kpmax= 0±εr, whereXis a negative non-zero variable.εris a small number that can be tuned for identifying ruled and freeform features.
Freeform feature:kpmin= Y±εrandkpmax= X±εr, whereX and Yare non-zero variables such that X≤ρmax and
Y≥ρmin, whereρmax and ρmin are threshold values for
distinguishing freeform and rib features. Rib feature:kpmin ≤ρminand/orkpmax≥ρmax
Figure5shows examples of these features. A ruled feature is defined by a generatrix curve that is swept along a directrix line to generate the surface, as in the cone shown in Fig.5b. A double curved surface where a generatrix is swept along another curve creates a freeform surface, as shown in Fig.5c. It is important to set appropriate thresholds so as to get a usable segmentation of the part for building response surface models for accuracy.
3 Characterization results
3.1 Model for freeform ellipsoidal parts
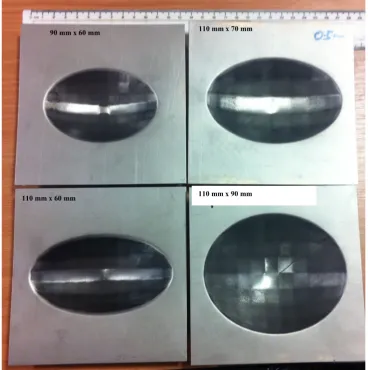
The accuracies of the formed ellipsoids (shown in Fig.6) are listed in Table1. It can be seen that changing the diameters of the major and minor axes affects the accuracy of the part. The smallest part shows the highest over forming. This can be attributed to the low wall angles in the part, which are usually responsible for over forming. The largest part with the highest wall angles (top contour of 110×90 mm) shows exclusively under forming. This is due to two reasons: (a) ellipsoids are essentially positive curvature freeform surfaces and positive curvature tends to under form [9], (b) the biggest part has high wall angles in the initial forming steps and high wall angles in a positive curvature region are known to under form [9]; this leads to the lower depths also showing under forming being a continuation of the top surface.
The MARS model was trained with accuracy data from these tests resulting in the following model.
ef ¼ −0:65 þ 0:35*max 0ð ; 0:97−doÞ þ 7:2*max 0ð ;do−0:97Þ−0:024*max 0ð ;dv−45Þ þ 0:0049*
max 0ð ; 56−dvÞ þ 0:71*max 0ð ;dv−56Þ−0:008*max 0ð ;lmax−97Þ þ 0:028*max 0; 17−lmin
þ
0:013*max 0;lmin−17 þ 3:9*max 0ð ;kmaxþ 0:0061Þ þ 14*max 0; 6:8*10−5−kmin þ 6:3* max 0;kmin−6:8*10−5−1:4*max 0ð ; 0:62−αÞ–1:2*max 0ð ;α–0:62Þ þ 3:5*max 0ð ;ω−1:2Þ þ
0:59*max 0ð ; 1:3−ωÞ−13*max 0ð ;ω−1:3Þ
ð2Þ
[image:5.595.53.547.404.681.2] [image:5.595.63.544.586.690.2]where,ef=deviation at STL vertex of a freeform feature and the remaining abbreviations are the same as in Section2.1.
3.2 Model for ellipse draft ruled surfaces
Nine of the 12 ellipse draft ruled surface parts were chosen as training sets for generating the models. These were the parts made with major and minor axis
diameter combinations of 110 × 60, 110 × 90, and 90 × 60. The remaining three were used later for verifying the model’s validity for a new combination of major and minor axis diameters. Table 2 lists the accuracies of these parts.
It is observed that at low wall angles, the formed part shows large deformations after unclamping, which is absent at higher wall angles, 30° and 45°. In general,
90 mm x 60 mm 110 mm x 70 mm
110 mm x 60 mm 110 mm x 90 mm
[image:6.595.177.546.56.427.2]Fig. 6 Ellipsoids used for training the MARS models
Table 1 Accuracies of formed ellipsoids (negative deviations indicate over forming while positive deviations indicate under forming)
Major axis diameter Minor axis diameter Min. deviation Max. deviation Mean deviation Standard deviation
110 60 −0.6 2.44 0.38 0.41
110 70 −1.16 0.95 0.16 0.38
110 90 0 1.93 0.60 0.33
90 60 −1.39 0.64 −0.34 0.27
[image:6.595.54.544.622.701.2]the under forming was observed to increase with the wall angle in the part. This also results in an increase
in the magnitude of the mean deviation. The model resulting from the training of these parts is given below:
er¼0:3−0:28*max 0ð ; 0:96−doÞ−21*max 0ð ; do−0:96Þ− 0:096*max 0ð ; 11− dvÞ−0:0022*
max 0ð ;dv−11Þ− 0:006*max 0ð ; 108−lmaxÞ þ 0:46*max 0ð ;lmax−108Þ þ 0:049*max 0; 31−lmin
−0:0035*max 0;lmin−31 þ 5:3*max 0;lmin−94−8:5*max 0ð ; 0:13−kmaxÞ−27* max 0ð ; kmax−0:13Þ þ 3:1*max 0ð ; 0:25−αÞ þ 19*max 0ð ;α−0:25Þ−18*max 0ð ;α− 0:36Þ
−0:32*max 0ð ; 1:4−ωÞ−0:34*max 0ð ;ω−1:4Þ
ð3Þ
whereer=deviation at STL vertex of a ruled feature.
3.3 Generalized model for a part with mixed curvatures
For a part with mixed curvatures, feature detection with thresholds used for detecting the ellipsoidal parts as freeform features results in the part being detected as a mixture of ruled and freeform surfaces as shown in Fig.7a. This creates small ruled features surrounded by a larger freeform feature. To carry out compensation of the part, the vertices in the ruled features would then be compensated with a different error
correction function than the freeform feature. This would in-troduce discontinuities in the predicted and compensated sur-faces. The problem is observed even if the thresholds are changed to those needed to detect the part largely as a ruled surface by using the same thresholds that were used for de-tecting the ellipse drafts, as shown in Fig.7b.
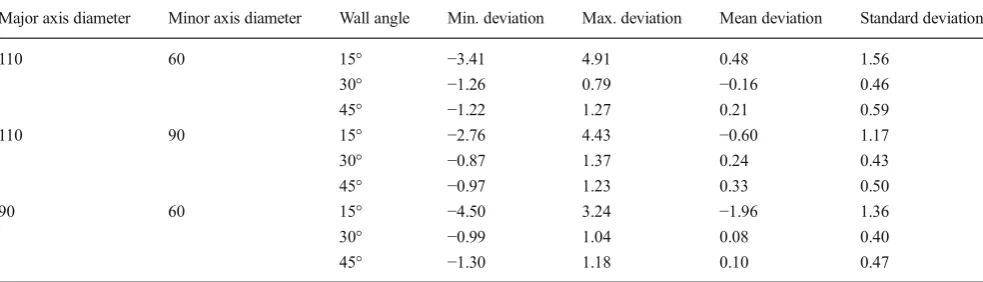
[image:7.595.52.544.71.212.2]Another technique to correct the part would be to use a network of features and use a single compensation function for the feature interactions [30]. However, modeling this fea-ture interaction would require more experimental tests and also need to cover the different locations where the ruled Table 2 Accuracies of formed ellipse draft ruled surfaces (negative deviations indicate over forming while positive deviations indicate under forming)
Major axis diameter Minor axis diameter Wall angle Min. deviation Max. deviation Mean deviation Standard deviation
110 60 15° −3.41 4.91 0.48 1.56
30° −1.26 0.79 −0.16 0.46
45° −1.22 1.27 0.21 0.59
110 90 15° −2.76 4.43 −0.60 1.17
30° −0.87 1.37 0.24 0.43
45° −0.97 1.23 0.33 0.50
90 60 15° −4.50 3.24 −1.96 1.36
30° −0.99 1.04 0.08 0.40
45° −1.30 1.18 0.10 0.47
All dimensions are in millimeters
[image:7.595.175.546.538.713.2]features occur. Furthermore, due to the small surface area of the ruled features, the feature interaction error prediction equa-tions may not capture the correct accuracy behavior.
Hence, a new approach to model the accuracy of parts with mixed curvatures was used in this study. In this approach, the part is detected as a single feature and an index that evaluates the extent to which the feature is a freeform feature is calcu-lated. This index is evaluated as:
δ ¼ κminðpartÞ−κminðruledÞ
κminðellipsoidsÞ−κminðruledÞ ð4Þ
whereδis the extent to which the feature is a freeform feature, κminðpartÞis the mean of minimum curvatures of the vertices
in the part,κminðellipsoidsÞis the mean of the minimum
cur-vatures of the vertices in the ellipsoid training sets used for generating Eq. (2), andκminðruledÞis the mean of the
mini-mum curvatures of the vertices in the ellipse draft training sets used for generating Eq. (3).
Now, the deviations at individual vertices of the part are calculated as :
em¼δ*ef þ ð1−δÞ*er ð5Þ
where,em is the predicted deviation of a vertex in a mixed feature consisting of both ruled and freeform sur-face vertices, andef and er are calculated using Eqs. (2) and (3) respectively.
4 Benchmark validation test cases
4.1 Test geometries
The model generated in Eq. (2) was validated in two steps. First, it was tested against the training sets. Then, it was used to predict a new part, which is a cranial implant. Likewise, the model generated in Eq. (3) was validated by testing against the ellipse drafts formed with the backing plate of dimensions 110×70 mm, which were not part of the training sets. The mixed model in Eq. (5) was then also used to predict the shape of the implant to find if it improves the prediction provided by Eq. (2). The geometry of the cranial implant is shown in Fig.8.
4.2 Model validation results
[image:8.595.56.546.48.160.2]The results of the validation are presented in Table3. Here, the predicted meshes are compared with the mesh representing the point clouds from the actual formed part from experiments and the prediction error is thereby found as the deviations between these two meshes. It is seen that the training test cases show a mean deviation close to zero for three of the four ellipsoids, while the implant shows a mean deviation of −0.82 mm. The error in the prediction of the formed shape of the implant is [−1.0 mm, 1.0 mm], which is not as good as the prediction for the ellipsoids (see example prediction for ellipsoids in the sections shown in Fig.9). The reason for the Fig. 8 Cranial implant geometry in isometric view,x-section along AA′andy-section along BB
Table 3 Prediction accuracies of benchmark test cases (all dimensions are in millimeters)
Part type Major axis diameter Minor axis diameter Min deviation Max deviation Mean deviation
Ellipsoid 110 60 −0.42 0.32 0.02
Ellipsoid 110 70 −0.93 0.61 −0.23
Ellipsoid 110 90 −0.69 0.53 0.04
Ellipsoid 90 60 −0.89 0.95 −0.01
Ellipse draft with wall angle 30° −1.07 0.22 −0.77
Ellipse draft with wall angle 40° −0.77 0.37 −0.12
Ellipse draft with wall angle 45° −0.34 0.75 0.29
Cranial plate (Eq. (2)) −1.00 1.00 −0.82
[image:8.595.51.545.568.712.2]slightly poor prediction, as shown in Fig. 11a, is that the ellipsoid is still not a perfect representation of the curvatures in the cranial plate and the major axis and minor axis dimensions obtained for the cranial plate are only an approximation of the material deformation in the case of an ellipsoid. However, it would be reason-able to say that the model in Eq. (2) is a good starting point for prediction of positive curvature freeform sur-faces and this model can possibly be improved further either by choosing different geometrical parameters for the model or using more training sets for more complex geometries. This would however reduce the robustness of this methodology.
The predictions for the ellipse drafts was done for parts with major axis diameter of 110 mm and minor axis di-ameter of 70 mm and wall angles of 30°, 40°, and 45°, which constitutes parts outside of the training sets used for generating the model. It is seen that Eq. (3) predicts the accuracy of ellipse drafts with mean deviations of −0.77, −0.12, and 0.29 mm respectively for parts with 30°, 40°, and 45° wall angles. Figure 10 shows the pre-dicted sections for the part with wall angle of 40°.
Using Eq. (4),δis evaluated as 0.73 and the prediction accuracy for the cranial implant improves to [−0.85 mm, 0.14 mm] by using the mixed model (see section in Fig.11b).
4.3 Compensation technique
The compensation of the parts is carried out by translating individual vertices in the nominal CAD model of the part normal to the part geometry by a magnitude equal to a com-pensation factor multiplied with the predicted deviation at the point. This follows the strategy outlined by Bambach et al [14]. Three different compensation factors were tried out for compensation using Eq. (2), 0.7, 1 and 1.3 and the best among these factors, 0.7 was used for compensation using Eq. (5).
4.4 Accuracy of compensated implant
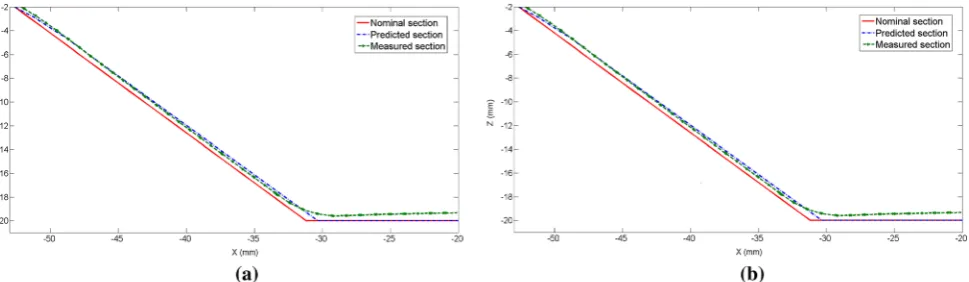
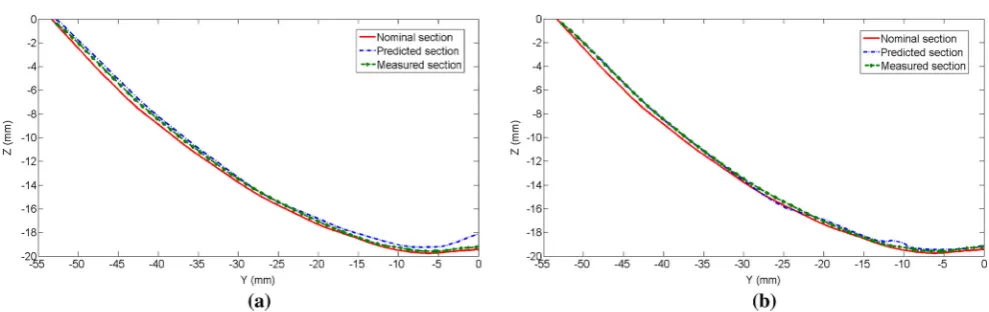
[image:9.595.55.547.49.194.2]The results of the compensation are presented in Table4along with the result for a part made without compensation (com-pensation factor 0). Using Eq. (2), it can be seen that the part with the best accuracy is realized with a compensation factor of 0.7. A color plot of the part accuracy and that of the Fig. 9 Comparison of ellipsoid sections showing nominal, predicted, and measured sections taken atax=0 along the minor axis of the ellipsoid andb y=0 along the major axis of the ellipsoid with major and minor axis diameters 110 and 90 mm
[image:9.595.60.545.549.690.2]uncompensated part is shown in Fig.12to illustrate the utility of using the model in Eq. (2) in forming parts with higher accuracy. It can be seen that with increasing compensation, the over forming in the part systematically increases from 0.57 mm with a compensation factor of 0.7–0.96 mm with a compensation factor of 1.3. In contrast, the under forming decreases from 0.53 mm to 0.25 mm. This indicates that in-creasing the compensation factor creates an over-compensated surface, which is outside the nominal CAD model, thereby enhancing the over forming and reducing the under forming, which is caused primarily due to spring back of the material. It is also noted that in the uncompensated part, the color plot in Fig.12a reveals that the zone of significant under forming seen in reddish-yellow tone corresponds to the area with the highest wall angles. This is on expected lines, as previous experiments have shown that low wall angle regions show either low under forming or over forming, while high wall angle regions are prone to spring back of the material [9]. The color plot shown in Fig.12bshows that this zone of under forming is well compensated using the compensated tool path generated by the prediction given by Eq. (2), as evident by the green patch in the center of the part.
Using Eq. (5) and a compensation factor of 0.7, the mean deviation improves from 0.05 to 0 mm, although the maxi-mum deviation in the part increases from 0.53 to 0.74 mm. Figure13shows the manufactured part and a color plot of the
accuracy. From this result, it can be concluded that the better predictions obtained by using Eq. (5) help in reducing the average deviations in the part geometry. It is again evident from the color plot that the zone of high wall angles in the center of the part is mostly well compensated and is in green. There are two small areas in reddish-yellow tone in this plot, which shows that the prediction was not very accurate in these regions. However, the improved mean deviation indicates that the mixed MARS model in Eq. (5) is able to account for the variations in the principal curvatures in the part better than the model specifically built for freeform features in Eq. (2).
4.5 Limitations and discussion on the developed models
It is noteworthy that within this study, only positive curvature parts were considered for developing the response surface models. This may pose a limitation for directly applying the developed models for parts that also constitute of negative curvature regions. In parts with a mix of positive and negative curvature freeform regions, a model for negative curvature features can be developed and using the approach provided in this work to develop a mixed-MARS model, a similar mixed model can be generated.
[image:10.595.50.545.47.203.2] [image:10.595.53.545.619.711.2]Yet another limitation of the current models is for parts with wall angles close to the failure limit for the material. In the current study, the parts considered were far away from failure Fig. 11 Comparison of cranial plate sections showing nominal, predicted, and measured sections taken atx=0 where predicted section is generated usingamodel for ellipsoidal freeform surfaces—Eq. (2)bmixed model—Eq. (5)
Table 4 Results of forming a cranial implant using MARS model with different compensation factors
Part type Compensation factor Minimum deviation Maximum deviation Mean deviation Standard Deviation
Cranial plate 0 −0.47 1.02 0.09 0.24
Cranial plate (Eq. (2)) 0.7 −0.57 0.53 0.05 0.19
Cranial plate (Eq. (2)) 1 −0.75 0.36 −0.06 0.17
Cranial plate (Eq. (2)) 1.3 −0.96 0.25 −0.31 0.23
and hence, the compensated surfaces were also within the failure limits. As shown in earlier works [26,30], when the compensated surface is beyond the failure limit, toolpaths generated using MARS models may lead to sheet thinning and failure. In such cases, it is useful to adopt other tool path strategies such as morphing [31].
Furthermore, this method will work well when the part to be formed has a similarity to that of an ellipsoid. While the ellipsoidal shape was seen to be a very generic method of characterizing a number of cranial implant shapes, the appli-cation of these models to parts which are distinctly different from an ellipsoid should be done with caution. This is partic-ularly important when sections taken at increasing depths do not show a decreasing trend in the major and minor axis lengths. While this limitation may be kept in mind, it is note-worthy that the developed approach within this study opens up the possibility of developing a generic method of taking complex shapes and observing similarities with known geo-metrical shapes such as ellipsoids, hyperboloids, cones, etc. and using the basic characterizing dimensions in developing
suitable geometrical parameters that will then be used to de-velop accuracy response surfaces using MARS.
The validation work on the applicability of the mixed MARS model was limited to one substantial case study of the cranial implant. However, the individual models for ruled and freeform features have been tested to work well in predicting feature accuracy within reasonable limits for the maximum and minimum deviations in a number of test cases. These include the cases shown in Table3. It was not necessary to include material properties in the current study, as this study only focused on grade 1 titanium sheet parts for cranial im-plant applications. However, the MARS models capture the effect of the mechanical properties such as tensile strength, which affect the spring back behavior of sheet materials dur-ing incremental formdur-ing.
[image:11.595.173.546.49.249.2]In addition, it may be noted that the developed models within this paper were for sheets of thickness 0.5 mm and maximum dimensions limited to 110×90×35 mm. For parts outside these dimensions, simple extrapolation of model pre-dictions may not yield accurate results. It was not an objective Fig. 12 Accuracy plot of cranial
implant manufactured witha uncompensated tool path andb compensated tool path using Eq. (2) and a compensation factor of 0.7
Fig. 13 Cranial implant manufactured with a
[image:11.595.179.546.534.713.2]of this current study to explore the effects of material, size, and sheet thickness effects but to develop a methodology for freeform titanium sheet parts that would be applicable mostly to cranial implant applications and parts with regions of inter-mediate principal curvatures between two feature types.
5 Conclusions
In this study, a method to predict the accuracy behavior of incrementally formed titanium sheet parts was developed. MARS were used to develop models for ruled and freeform features that predict the accuracy at individual points in the STL file of the part to be formed. The models for freeform features are based on four training sets formed as ellipsoids while the models for ruled features were developed by varying the wall angles and major and minor axis dimensions at the top of the part. The major and minor axes of the parts at the depth (z-axis) cross-section of individual points in the part are used as variables in the model. In addition, both maximum and minimum curvatures are used as predictors for the freeform features model.
The results show that the generated model for freeform features is reliable in predicting ellipsoids from the training set with mean deviations for the prediction accuracy varying between−0.23 and 0.04 mm, while the prediction accuracy deteriorates for a new part such as a cranial implant. The model for ruled features predicts the accuracy of a new ruled feature with mean deviations varying between –0.77 and 0.29 mm, for the specific validation test cases performed. A new mixed model based on curvatures in the part was pro-posed, and it was verified to improve the average prediction for the cranial implant by 0.33 mm.
It may be however noted that the models generated using the ellipsoids for freeform surfaces should not be directly ap-plied to any generic shape, unless an approximation in terms of major and minor axis is immediately apparent from the model geometry. Furthermore, the ellipsoids are positive cur-vature features, while a freeform part such as a human face model may consist of negative curvature regions where the models provided in this study will not be valid. However, the modeling strategy provided in this paper for parts with mixed curvatures using an index as shown in Eq. (4) has been shown to be a promising strategy.
Using the model for freeform features, part compensation was carried out for a grade 1 titanium implant part and the accuracy of the formed part was seen to improve vis-à-vis the uncompensated part with the best results achieved with a com-pensation factor of 0.7. Comcom-pensation using the model re-duced the maximum deviations from 1.02 to 0.53 mm. Using the mixed model and the same compensation factor of 0.7, improvement in part accuracy was also realized in terms of
both reduced maximum and mean deviation compared to the uncompensated part.
Further studies following this research can include improv-ing the model with better predictors or a new prediction tech-nique such as GAM. It would also be useful to study the effects of material properties and sheet thickness on the accu-racy response functions, as material properties and sheet thick-ness can vary from one batch to another even for the same material and this will affect the plastic deformation and spring back resulting from forming the part. Systematic prediction of the accuracy of freeform titanium part surfaces using numer-ical methods such as finite element analysis is another poten-tial area of investigation, where the results from the studies carried out within this research can be compared to numerical predictions.
Acknowledgments This work was supported by the Engineering and Physical Science Research Council of UK (EP/L02084X/1), the Marie Curie International Incoming Fellowship (628,055 and 913,055), and International Research Staff Exchange Scheme (IRSES, MatProFuture project, 318,968) within the 7th EC Framework Programme (FP7). The authors acknowledge the help provided by Ben Shaw, John Hinchliffe, and Mark Daine in the faculty workshop.
References
1. Aydin S, Kucukyuruk B, Abuzayed B, Aydin S, Sanus GZ (2011) Cranioplasty: review of materials and techniques. J Neurosci Rural Pract 2(2):162–167
2. Duflou JR, Behera AK, Vanhove H, Bertol LS (2013) Manufacture of accurate titanium cranio-facial implants with high forming angle using single point incremental forming. Key Eng Mater 549:223– 230
3. Göttmann A, Korinth M, Schäfer V, Araghi BT, Bambach M, Hirt G (2013) Manufacturing of individualized cranial implants using two point incremental sheet metal forming. In: Schuh G, Neugebauer R, Uhlmann E (eds) Future Trends in Production Engineering. Springer, Berlin Heidelberg, pp 287–295
4. Lu B, Ou H, Shi SQ, Long H, Chen J (2014) Titanium based cranial reconstruction using incremental sheet forming. Int J Mater Form (Flexible forming - Incremental Sheet Forming & Roll Forming): 1-10 doi:10.1007/s12289-014-1205-8
5. Lu B, Xu DK, Liu RZ, Ou H, Long H, Chen J (2015) Cranial reconstruction using double side incremental forming. Key Eng Mater 639:535–542
6. Eksteen PD, Van der Merwe AF (2012) Incremental sheet forming (ISF) in the manufacturing of titanium based plate implants in the bio-medical sector. In: Proceedings of the International Conference on Computers & Industrial Engineering (CIE 42), Cape Town, South Africa, 2012. CIE & SAIIE 2012:569-575
7. Araujo R, Teixeira P, Montanari L, Reis A, Silva MB, Martins PA (2014) Single point incremental forming of a facial implant. Prosthetics Orthot Int 38(5):369–378
9. Behera AK (2013) Shape feature taxonomy development for toolpath optimisation in incremental sheet forming. PhD Thesis. Katholieke Universiteit Leuven. ISBN 978-94-6018-733-9 10. Jeswiet J, Micari F, Hirt G, Bramley A, Duflou J, Allwood J (2005)
Asymmetric single point incremental forming of sheet metal. Cirp Ann-Manuf Techn 54(2):623–649
11. Duflou JR, Verbert J, Belkassem B, Gu J, Sol H, Henrard C, Habraken AM (2008) Process window enhancement for single point incremental forming through multi-step toolpaths. Cirp Ann-Manuf Techn 57(1):253–256
12. Skjødt M, Hancock MH, Bay N (2007) Creating helical tool paths for single point incremental forming. Key Eng Mat 344:583–590 13. Malhotra R, Reddy NV, Cao JA (2010) Automatic 3D spiral
toolpath generation for single point incremental forming. J Manuf Sci E-T Asme 132(6):1–10. doi:10.1115/1.4002544
14. Hirt G, Ames J, Bambach M, Kopp R (2004) Forming strategies and process modelling for CNC incremental sheet forming. Cirp Ann-Manuf Techn 53(1):203–206
15. Li JC, Hu JB, Pan JJ, Geng P (2012) Thickness distribution and design of a multi-stage process for sheet metal incremental forming. Int J Adv Manuf Tech 62(9-12):981–988
16. Verbert J, Behera AK, Lauwers B, Duflou JR (2011) Multivariate adaptive regression splines as a tool to improve the accuracy of parts produced by FSPIF. Key Eng Mater 473:841–846
17. Khan MS, Coenen F, Dixon C, El-Salhi S, Penalva M, Rivero A (2015) An intelligent process model: predicting springback in sin-gle point incremental forming. Int J Adv Manuf Technol 76(9-12): 2071–2082
18. Verbert J, Duflou JR, Lauwers B (2007) Feature based approach for increasing the accuracy of the SPIF process. Key Eng Mat 344: 527–534
19. Behera AK, Gu J, Lauwers B, Duflou JR (2012) Influence of ma-terial properties on accuracy response surfaces in single point incre-mental forming. Key Eng Mater 504–506:919–924
20. Micari F, Ambrogio G, Filice L (2007) Shape and dimensional accuracy in single point incremental forming: state of the art and future trends. J Mater Process Technol 191(1-3):390–395
21. Essa K, Hartley P (2011) An assessment of various process strate-gies for improving precision in single point incremental forming. Int J Mater Form 4(4):401–412
22. Rauch M, Hascoet JY, Hamann JC, Plenel Y (2009) Tool path programming optimization for incremental sheet forming applica-tions. Comput Aided Des 41(12):877–885
23. Lu B, Chen J, Ou H, Cao J (2013) Feature-based tool path gener-ation approach for incremental sheet forming process. J Mater Process Technol 213(7):1221–1233
24. Samui P (2014) Determination of surface and hole quality in dril-ling of AISI D2 cold work tool steel using MPMR, MARS and LSSVM. J Adv Manuf Syst 13(04):237–246
25. Bentley JL (1990) KDTrees for semidynamic point sets. Proceedings of the Sixth Annual Symposium on Computational Geometry:ACM. New York, NY, USA:187-197
26. Behera AK, Verbert J, Lauwers B, Duflou JR (2013) Tool path compensation strategies for single point incremental sheet forming using multivariate adaptive regression splines. Comput Aided Des 45(3):575–590
27. Cohen-Steiner D, Morvan J-M (2003) Restricted Delaunay triangu-lations and normal cycle. In: Proceedings of the 19th Annual Symposium on Computational Geometry: ACM. New York, NY, USA:312-321
28. Alliez P, Cohen-Steiner D, Devillers O, Levy B, Desbrun M (2003) Anisotropic polygonal remeshing. ACM Trans Graph 22(3):485– 493
29. Behera AK, Vanhove H, Lauwers B, Duflou JR (2011) Accuracy improvement in single point incremental forming through system-atic study of feature interactions. Key Eng Mater 473:881–888 30. Behera AK, Lauwers B, Duflou JR (2014) Tool path generation
framework for accurate manufacture of complex 3D sheet metal parts using single point incremental forming. Comput Ind 65(4): 563–584
![Fig. 1 Incremental forming in its three different process variants(TPIF),showing the a use of counter support or two point incremental forming b full die, and c partial die [9]](https://thumb-us.123doks.com/thumbv2/123dok_us/8595915.371653/2.595.52.289.52.380/incremental-forming-different-process-variants-support-incremental-forming.webp)