VOCAL ATTRACTIVENESS
David R. Feinberg
A Thesis Submitted for the Degree of PhD
at the
University of St Andrews
2005
Full metadata for this item is available in
St Andrews Research Repository
at:
http://research-repository.st-andrews.ac.uk/
Please use this identifier to cite or link to this item:
http://hdl.handle.net/10023/14253
Vocal Attractiveness
David R. Feinberg
October 2005
ProQuest Number: 10166243
All rights reserved
INFORMATION TO ALL USERS
The quality of this reproduction is dependent upon the quality of the copy submitted.
In the unlikely event that the author did not send a com plete manuscript and there are missing pages, these will be noted. Also, if material had to be removed,
a note will indicate the deletion.
uest
ProQuest 10166243
Published by ProQuest LLO (2017). Copyright of the Dissertation is held by the Author.
All rights reserved.
This work is protected against unauthorized copying under Title 17, United States C ode Microform Edition © ProQuest LLO.
ProQuest LLO.
789 East Eisenhower Parkway P.Q. Box 1346
I, David Russell Feiiiberg, herby certify that this thesis, which is approximately 60,000 words in length, which has been written by me, that it is the record of work earned out by me and that it has not been submitted in any previous application for a higher degree.
date.QS.JiA.-.05... signature of candidate.
I was admitted as a candidate for the degi ee of Doctor of Philosophy in October 2002; the higher study for which this is a record was carried out in the University of St Andrews between 2002 and 2005.
date.O.^ : J^: Orî.. signature of candidate.
I hereby certify that the candidate has fulfilled the conditions of the Resolution and Regulations appropriate for the degree of Doctor of Philosophy in the University of St Andrews and that the candidate is qualified to submit this thesis in application for that degree.
Ill submitting this thesis to the University of St Andrews I imderstand that I am giving permission for it to be made available for use in accordance with the regulations of the University Library for the time being in force, subject to any copyiight vested in the work not being affected thereby. I also understand that the title and abstract will be published, and that a copy of the work may be made and supplied to any bona fide library or research worker.
Acknowledgements
There is a long list of people to thank for their help, guidance, fiiendship and supeiwision throughout my PhD. If I left you out, please don’t be offended. I’d first like to thank my the people from Rutgers who advised me during my undergraduate career: Amy
Jacobson, Robert Trivers, H. Deiter Steklis, Ryan Palombit, and Lee Cronk. I’d like to thank the following people fi’om St Andrews whose guidance and support aided me through my PhD: Dave PeiTett, Ben Jones, Anthony C. Little, D. Mark Thompson, Lesley Perrier, Lisa DeBruine, Miriam Law Smith, Fhionna Moore, Bernard Tiddeman, Jamie Lawson, D. Michael Burt, and Lynda Boothroyd, Sophia Duranni, Anne Perrett, Klaus Zuberbühler, Martin O’Neill and Michael StiiTat. I Imow there are more of you, but in general I thank everyone at St Andrews. Special thanks to Erica Cartmill for her love and support and also copy-editing. Thanks to the people who analysed hormones for me: Steven Hillier, Martha Urqhart, Martin Sharpe, Elijah Al-Dujaili, Susan Whiten & Robert Pitman. Special thanks to the undergiads that helped me collect data: William
Calderhead, Carolyn Cheetham, Cathrine Dutton, Fiona Elder, Suzanne Hall, Jennifer Hardingham, Laura Harper, Laura Johnson, Gilliam McBride, Jennifer McChesney, Ann- Marie Morgan, Joanna Souter, Katherine Timmins, Kathryn Stevens, and Kathryn
Stewart. Thanks also to my non-St Andrews collaborators, colleagues and friends in the field, and elsewhere.
Publication iist/author roies
Parts of this thesis are adapted from the publications listed below:
Chapter 5 adapted from
Feinberg DR (2004) Fimdamental fiequency perturbation indicates perceived health and age in male and female vocalisers. Joimial of the Acoustical Society of
America, 115,2609.
Chapter 6 adapted from:
Feinberg DR, Jones BC , Little AC, Burt DM & Penett DI. (2005) Manipulation of fundamental and fomiant fr equencies influence the attractiveness of human
male voices. Animal Behaviour 69, 561-568.
Author roles:
Feinberg, DR: experimental design, recorded voices, stimuli generation, acoustic analysis, mnning of paiticipants, statistical analysis, wrote paper
Jones, BC: edited paper, rumiing of participants, aided in stimuli calibration Little, AC: aided in statistical analysis, edited paper
Burt, DM: progiammed stimuli presentation software Perrett, DI: theoretical input, edited published paper
Chapter 8 adapted from:
Feinberg DR, Jones BC, Law Smith MJ, Moore FR, DeBruine LM, Cornwell RE, Hillier SG, Perrett D I. (2005) Menstrual cycle, tiait estrogen level and masculinity preferences in the human voice. In Press.
Author roles:
Feinberg, DR: experimental design, recorded voices, stimuli generation, acoustic analysis experiment setup, numing of participants, statistical analysis, writing
Jones, BC: aided in menstrual cycle classification, miming of participants, editing of published paper
Law Smith, MJ: aided in inteipreting honnone assays, rmming of participants Moore, FR: Programmed HTML code for diary data, running of participants DeBmine, LM: running of participants, editing of published paper
Cornwell, RE: running of participants Hillier, SG: Hormone assays
Chapter 10 adapted from:
Feinberg DR, Jones BC, DeBruine LM, Moore FR, Law Smith MJ, Cornwell RE, Tiddeman BP, Boothroyd, LM, PeiTett DI. (2005) The voice and face of woman: one ornament that signals quality? Evolution and Human Behavior. 26, 398-408.
Author roles
Feinberg, DR: experimental design, recording of UK voices, UK photogi aphy, acoustic analysis, measuring UK facial-metric femininity, averaged faces, ran UK participants, statistical analysis, wrote paper
Jones, BC: recordmg of Canadian voices, Canadian photography, editing paper DeBruine, LM: Canadian photogiaphy, recording of Canadian voices, delineating Canadian faces, measuiing Canadian facial-metric femininity, editing paper Moore, FR: HTML code for online experiment, rumiing participants
Law Smith: running participants
Cornwell, RE: Deliniating UK faces, rumiing participants
Tiddeman, BP: progiaimiiing face morphing software, coding softwaie for facial-metric measurements
Bootlu'oyd, LM: rumiing participants on raw face experiment PeiTett, DI: theoretical input, editing published paper
Table of contents
Acknowledgements...4
Publication list/author roles... 5
List of figures... 15
List of tables... 16
Chapter 1...19
General introduction...19
1 Different strokes for different folks...19
2 The chosen path...19
2.1 An evolutionary perspective...20
2.2 Here we go...24
Chapter 2 ... 31
Acoustics review...31
1. Differences between human and non-human primate vocal apparatus...31
2. Some very basic anatomy of the human larynx... 33
3. Vocal fold mechanics... 35
LI Fundamental Frequency...36
1.2 Haiinonics...36
3. Fomiant frequencies... 38
4. Formant dispersion... 40
5. Hearing...41
6. Voice processing... 42
Chapter 3... 45
Sexual selection... 45
1 Natural selection and sexual selection...45
2 Types of selection: stabilising, directional and disruptive...46
2.1 Stabilising selection...46
2.2 Directional selection... 46
2.3 Disruptive selection... 47
3 Secondary sexual characteristics...47
4 Sex differences in reproductive rates...48
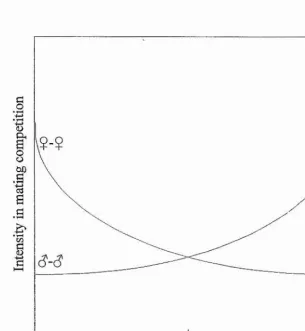
5 hitensity of intrasexual competition & sexual dinioiphisni...48
5.1 Operational sex ratio... 49
5.2 Variance in reproductive success...52
5.3 Parental investment... 53
5.4 Mating effort...55
6 hitersexual competition... 57
7 hitrasexual selection... 58
7.1 Direct vs. indirect benefits...58
7.2 Fisherian or runaway selection...59
7.3 The good genes hypothesis...59
7.3.1 The handicap hypothesis... 60
7.3.2 Haniilton-Zuk hypothesis...60
7.3.3 hiniiunocompetence hypothesis...60
7.3.4 Qualifications to the handicap and immunocompetence hypotheses...61
7.4.1 The sexy son hypothesis...63
8 hitersexual selection meets intrasexual selection...63
8.1 Benefits of selecting dominant males... 64
Chapter 4 ...66
Human mate choice...66
1 Wliat qualities should we choose in mates?... 66
1.1 Lonely hearts advertisements...68
1.2 Self-report questionnaires ... 69
2 What affects qualities such as fertility, dominance, resources and health?...70
2.1 Age...70
2.1.1 Fertility...70
2.1.2 Dominance and resources ... 70
2.1.3 Health...71
2.2 Height... 71
2.2.1 Fertility...71
2.2.2 Dominance and resources... 72
2.2.3 Health... 72
3 Hormonal profile (masculinity/femininity)... 73
3.1 Women...:... 73
3.1.1 Fertility... 73
3.1.2 Dominance and resources...73
3.1.3 Health... 74
3.2 M en...74
3.2.1 Fertility... 74
3.2.2 Dominance and resources...75
3.2.3 More on testosterone and health ... 76
4 How are mate-choice relevant qualities signalled and assessed?... 77
4.1 Women... 77
4.1.1 Facial attractiveness...77
4.1.1.1 Averageness... 77
4.1.1.2 Symmetry... 78
4.1.1.3 Femininity... 78
4.1.1.4 Age... 79
4.1.1.5 Health... 79
4.1.1.6 Appearance of skin...80
4.1.1.7 Body shape... 81
4.1.2 hiterrelationships between measures of mate quality ...82
4.1.2.1 Face & body... 82
4.1.2.2 Face & smell... 83
4.2 M en...84
4.2.1 Face... 84
4.2.1.1 Masculinity... 84
4.2.1.2 Dominance... 85
4.2.1.3 Age...86
4.2.1.4'Health...86
4.2.1.6 Body... 87
4.2.2 InteiTelationsliips between measures of quality...87
4.2.2.1 Facial symmetry and health... 87
4.2.2.2 Symmetry and other measures of quality... 88
5 hidividual differences in what is attiuctive... 88
5.1 Age...88
5.2 Relationship status, homional contraceptives and temporal context...89
5.3 Attractiveness/femininity... 89
5.4 Menstrual cycle... 90
5.4.1 Facial masculinity preferences... 90
5.4.2 Preferences for height...91
5.4.3 Preferences for healthy looking faces... 91
5.5 Psychological condition... 92
5.6 Ecology...92
5.6.1 Body...92
5.6.2 Face...92
6 What physical characteristics do acoustic properties of the voice relate to?...93
6.1 Women...93
6.1.1 Hormones... 93
6.1.1.1 T estosterone...93
6.1.1.1 Pitch... 93
6.1.1.2 Vocal-tract length...94
6.1.1.2 Oestrogen and progesterone... 94
6.1.1.2.1 Pitch... 94
6.1.1.2.2 Vocal-tract length...95
6.1.1.2.3 Jitter and shimmer... 95
6.1.2 Body characteristics...96
6.1.2.1 Waist-to-hip ratio...96
6.1.2.2 Height and weight...96
6.1.2.2.1 Pitch...97
6.1.2.2.2 Vocal-tract length... 97
6.1.2.2.3 Jitter...98
6.1.3 Age... 98
6.1.3.1 Pitch and vocal-tract length...98
6.1.3.2 Jitter and shimmer... 99
6.1.4 Health...99
6.1.4.1 Fundamental frequency... 99
6.1.4.2 Vocal-tract length... 99
6.1.4.3 Jitter & Shinuner... 100
6.1.4.4 Facial attractiveness...100
6.2 M en... 101
6.2.1 Hormones (testosterone)...101
6.2.1.1 Prenatal testosterone...101
6.2.1.2 Pubertal testosterone...101
6.2.1.3 Adult testosterone...101
6.2.2.1 Height... 102
6.2.2.1.1 Pitch... -...102
6.2.2.1.2 Vocal-tract length...102
6.2.22 Chest hair... 103
6.2.2.3 Age...;... 103
6.2.2.3.1 Pitch... 103
6.2.2.3.2 Vocal-tract length... 103
6.2.2.3.3 Jitter... 104
6.2.4 Health...104
6.2.4.1 Pitch... 104
6.2.4.2 Vocal-tract length...105
6.2.4.3 Jitter and shimmer... 105
7 Wliat is attractive in the voice and what does vocal attractiveness relate to?...106
7.1 Vocal attributes and acoustic properties of the voice...106
7.1.1 Pitch...106
7.1.1.1 Women’s voices... 106
7.1.1.2 Men’s voices... 107
7.1.2 Fomiant frequencies...107
7.1.2.1 Women’s voices... 107
7.1.2.2 Men’s voices... 108
7.2 Vocal attiuctiveness and non-vocal, characteristics...108
7.2.1 Symmetry... 108
7.2.2 Body Shape... 109
7.2.3 Perceived age... 109
7.2.4 Facial attiactiveness... 109
7.3 Vocal attractiveness and other attributions... 110
7.4 hidividual differences in voice perception... 110
Chapter 5... 112
CoiTelations between acoustic properties of the voice and attributions to voices 112 Study 1 - Men's voices... 112
1 Rationale...112
2 Methods...118
2.1 Voice recordings... 118
2.2 Stimuli generation... 119
2.3 Playback...120
2.4 Acoustical analysis... 121
2.4.1 Fundamental frequency (pitch)... 121
2.4.2 Fundamental frequency perturbation (jitter and shimmer)... 122
2.4.3 Fomiant frequencies...123
2.5 Statistical Analysis... 124
2.5.1 Principal components analysis (PCA) of jitter and shimmer... 124
2.5.2 hiter-rater agieement...126
2.5.3 Nomiality tests... 126
3 Results ...126
3.1 Zero-order conelations... 126
3.3 Partial correlations... 129
4 Discussion...130
4.1 Attributions to men's voices...130
4.2. Vocal attributes and acoustic properties of the voice ...132
4.2.1 Fundamental frequency...132
4.2.2 Formant dispersion...134
4.2.3 Jitter and Sliimmer... 134
Study 2 - Women's voices... 136
1 Rationale...136
2 Methods...139
2.1 Voice Recordings... 140
2.2 Stimuli generation... 140
2.3 Playback... 140
2.4 Acoustic measurements ...141
2.4.1 Fundamental frequency... 141
2.4.2 Formant frequencies... 141
2.4.3 Jitter and shiiumer... 141
2.5 Statistical analysis... 142
2.5.1 Principal components analysis (PCA) of jitter and shimmer...142
2.5.2 hiter-rater agreement... 143
2.5.3 Noiinality tests... 143
3 Results ...144
3.1 Zero-Order CoiTelations...144
3.2 Conti'olling for the duration manipulation... 147
3.3 Partial correlations... 147
4 Discussion... 148
4.1 Attributions to women's voices...148
4.2 Vocal attributes and acoustic properties of the voice ... 149
4.2.1 Fundamental frequency...149
4.2.2 Formant dispersion... 150
4.2.3 Jitter and Shimmer... 151
5 General discussion...152
5.1 Directional selection... 152
5.2 Direct benefits... 152
5.3 hidirect benefits ... 153
5.4 Pitfalls... 154
5.5 Conclusion...156
Chapter 6 ... 157
Manipulations of fundamental and fomiant frequencies influence the atti*activeness of human male voices... 157
1 Rationale... 157
2 Methods... 159
2.1 Acoustic measiu'ements...160
2.2 Acoustic manipulations...161
2.3 Procedure... 164
2.3,2 Attractiveness j udgments... ...164
2.4 Acoustic analysis...165
2.5 Statistical analysis...166
2.5.1 Inter-rater agreement... 166
2.5.2 Paired comparisons... 167
2.5.3 Individual differences and preference scores...167
3 Results... 168
3.1 Masculinity, size, health and age...168
3.2 Attractiveness...169
3.3 hidividual differences and preference scores... 170
4 Discussion... 171
4.1 Fundamental Frequency... 171
4.2 Size preference...171
4.3 Age preference...173
4.4 Acoustic transforms and attiibutions to voices... 174
Chapter 7 ... 177
Self-rated attractiveness positively predicts women’s preferences for masculine men’s voices...177
1 Rationale... 177
Study 1 - Natural voices... 180
2 Methods... 180
2.1 Participants... 180
2.2 Voice recordings...180
2.3 Procedure...181
2.4 Statistical Analysis...181
3 Results... 182
4 Discussion...182
Study 2 ...183
2 Methods... 183
2.1 Participants...183
2.2 Voice recordings...184
2.3 Acoustic measurements... 184
2.4 Voice manipulations... 184
2.5 Procedure...185
2.6 Statistical analysis...186
3 Results... 187
3.1 General preferences... 187
3.2 Self-rated attiactiveness... 187
3.3 Self-rated attractiveness and vocal masculinity preferences... 188
4 Discussion... 189
Chapter 8... 193
Trait oestrogen level and menstrual cycle shifts in preferences for vocal masculinity ..193
1 Rationale... 193
2 Materials and Methods...198
2.1 Voice Recordings...198
2.3 Acoustic manipulations ... 199
2.4 Participants... 201
2.5 Procedure... 202
2.6 Hormone assays... 202
2.7 Voice Ratings... 204
2.8 Questiomiaires... 204
2.9 Menstrual Cycle Classification...205
2.10 Statistical Analysis...206
3 Results... 206
3.1 Men’s voices... 207
3.1.1 Dominance... 207
3.1.2 Attractiveness... 207
3.2 Women’s voices... 210
3.2.1 Dominance... 210
3.2.2 Attractiveness... 210
4 Discussion ... 211
Chapter 9 ...216
Shifts in testosterone relate to shifts in dominance attributions to men’s voices... 216
1 Rationale... 216
2 Methods...219
2.1 Participants... 219
2.2 Stimuli generation... 219
2.3 Testosterone and cortisol assays... 222
2.4 Procedure ... 223
2.5 Exclusion criterion...223
3 Results...223
3.1 Shifts in hormone levels...223
3.2 Men’s voices ... 224
3.3 Women’s voices... 226
4 Discussion... 227
Chapter 10...231
The voice and face of woman: one ornament that signals quality?... 231
General rationale... 231
Study 1 ...233
1 Rationale...233
2 Methods...233
2.1 Participants... 233
2.2 Photographs... 234
2.3 Facial-metric femininity measures... 234
2.4 Voice Recordings... 236
2.5 Fundamental Frequency Measurement... 236
2.6 Statistical analysis... 237
3 Results... 237
4 Discussion...237
Study 2 ...238
2 Methods...238
2.1 Participants... 238
2.2 Image capture and voice recordings... 239
2.3 Stimuli generation... 239
2.4 Procedure...240
3 Results... 241
Study 3 ...242
1 Rationale... 242
2 Methods...242 2.1 Participants...242 2.2 Stimuli...243 2.3 Procedure...243 3 Results...243 4 Discussion...244 Chapter 11...246
The relative role of femininity and averageness is aesthetic judgements of women’s voices... 246
1 Rationale...246
2 Methods... 248
2.1 Participants... 248
2.2 Voice recordings... 248
2.3 Stimuli generation... 249
2.4 Acoustical Analysis ...250
2.4 Procedure...252
3 Results...252
4 Discussion...254
Chapter 12... 257
General discussion... 257
1 Dominance of voice and intrasexual competition... 257
2 Disruptive, directional and stabilising selection...258
3 What happened to vocal-tract length?... 259
4 Assortative preferences... 261
4.1 Assorting for atti*activeness?...261
4.2 Assorting for body size...262
5 Misuse of pitch as a cue to size...263
6 Multiple oniaments signalling mate quality... 266
6.1 Multiple messages in the voice...266
6.2 Multiple ornaments that signal the same quality...,... 267
7 If men’s faces and voices signal the same qualities, why do women’s preferences for sexual dimorphism appear to be inconsistent across modalities?... 268
7.1 General preferences... 268
7.2 Menstrual-cycle variation in preferences...269
8 Conclusions...270
References...272
Appendix:...288
List of figures
Figure 2-1. Comparison of vocal apparatus across some primate species Figure 2-2. The laryngeal cartilages
Figure 2-3. Top-down view of the laryngeal cartilages and muscles Figure 2-4. Lateral view of the laryngeal cartilages and muscles Figure 2-5. Harmonics
Figure 2-6. Illustration of different spectral slopes
Figure 2-7. The first three resonances of an open-closed tube Figure 2-8. Anatomy of the human ear
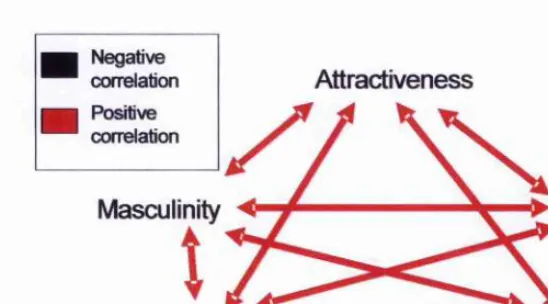
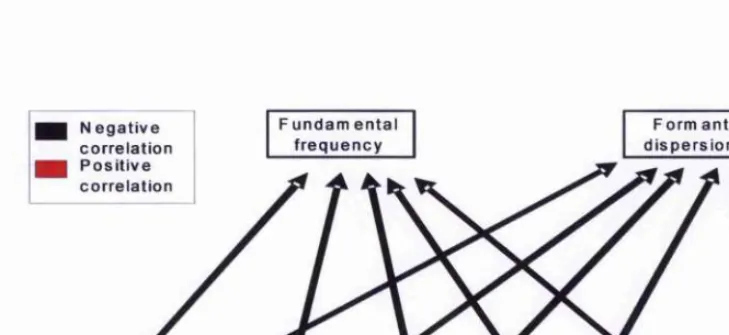
Figure 3-1. Operational sex ratio and intensity of competition Figure 5-1. Predicted coiTelations among attributes in men’s voices Figure 5-1. Predicted coiTelations among attributes in men’s voices
Figure 5-3. hiteiTelationships among attributions to men’s voices and acoustic measmements
Figure 5-4. Predicted conelations among attributes in women’s voices
Figure 5-5. Predicted relationships among fimdamental fiequency, formant dispersion and attributes to women’s voices
Figure 5-6. Interrelationships among attributions to women’s voices and acoustic measmements
Figure 6-1. Spectrograms of vowel “e” before and after each manipulation Figure 7-1. Spectrograms of the pitch-manipulated word “rainbow” Figure 8-1. Spectrogi'ams of the vowel “ee” fi'om one male vocaliser
Figure 8-2. E3G-dependent menstrual-cycle shifts in preferences for manipulated men’s voices
Figure 9-1. Spectrograms of masculinised (lowered pitch and increased apparent vocal- tract length) and feminised (raised pitch and decreased apparent vocal-tract length) versions of the vowel “ee” fiom a typical vocaliser
Figure 9-2. Changes in dominance attributions and testing time classified by testosterone level
Figure 10-1. Landmarks used in facial-metric femininity measurement technique
Figure 10-2. Facial prototypes constmcted from women with high-and low-pitched voices
Figure 11-1. Spectrograms of manipulated vowel “ee” fiom a vocaliser with a starting fundamental fi'equency of 220Hz
List of tabies
Table 5-1. Descriptive statistics of how much voices were altered in duration
Table 5-2. Descriptive statistics of fundamental frequency, jitter and shimmer in men’s voices
Table 5-3. Loadings of variables on factors after varimax rotation (men’s voices) Table 5-4. R values of Pearson correlations among variables in men
Table 5-5. The amount to which women’s voices were altered in duration Table 5-6. Descriptive statistics of measured acoustic features of women's voices Table 5-7. Loadings of variables on factors after varimax rotation (women’s voices) Table 5-8. R values of Pearson correlations among variables in women’s voices Table 6-1. Mean fundamental and formant frequencies (Hz) & formant dispersion
Table 6-2. Paired sample t-test results for attractiveness, masculinity, size, age and health by female
Table 7-1. Interconelations (Spearman’s Rho correlation) between different measures of self-rated attractiveness (SRA)
Table 7-2. Descriptive statistics of the different self rated attractiveness measures Table 7-3. Correlations between self-rated atti'activeness and vocal masculinity preferences
Table 8-1, Mean and standard deviation (in parentheses) of fundamental fr equency (FO) and fomiant dispersion (Fdisp) of voices after acoustic manipulations (in Hz)
Table 9-1. Mean and standard deviation (in parentheses) of frindamental fr equency (FO) and fomiant dispersion (Fdisp) of voices after acoustic manipulations
Table 10- 2. Mean and S.D. of ages
Table 11-1. Descriptive statistics of manipulated voices
Abstract
In this thesis, I aimed to explore vocal attractiveness from an evolutionary perspective:
how listener’s preferences for vocal qualities of potential partners could increase mating
success and reproductive success. Chapters 1-4 outline the background to the thesis,
reviews acoustics, sexual selection theory, and human mate-choice.
In chapter 5, I correlated attributions made to voices to the acoustic properties of the
voices. In men’s voices, pitch negatively predicted vocal attractiveness. Attributions of
masculinity, size, age, health and vocal attractiveness were all positively correlated. In
women’s voices, pitch, fonnant dispersion and perceived health positively predicted
vocal attractiveness. Masculinity, size and age negatively predicted vocal attractiveness.
In chapter 6, I measured the effect of manipulating fundamental and/or formant
frequencies (apparent vocal-tract length) on vocal attributions. Women found men’s
voices with lowered voice pitch and decreased fonnant dispersion more attractive,
masculine, large, older and healthier. Women’s size predicted preference for male vocal-
tract length.
In chapter 7 ,1 explored attitudes to voices speaking vowels and whole sentences using a
correlation design and acoustic manipulations. Women’s self-rated attractiveness
Most of the remaining studies focus on how honnones relate to vocal production and
perception. Women with less oestrogen showed the biggest menstmal cycle shifts in
vocal masculinity preferences, preferring masculinity most in the fertile phase (chapter
8). Men’s testosterone levels predicted the size of changes in attributions of dominance to
men’s voices (chapter 9). Women’s voice pitch coii'elated with facial-metric masculinity
and facial attractiveness (chapter 10). Men preferred women’s voices with raised pitch to
lowered pitch at multiple levels of starting pitch (chapter 11). These findings indicate
men prefeiTed femininity to averageness. In chapter 12,1 relate the work in this thesis to
Chapter 1
General introduction
1 Different strokes for different foiks
There are many psychological approaches one can take to study vocal attractiveness.
Vocal attractiveness through a social psychological perspective focuses on how vocal
stereotypes are formed (Berry & Hansen, 2000; Berry, Hansen, Landrypester, & Meier,
1994; Tusing & Dillard, 2000; Zuckerman & Driver, 1989; Zuckerman, Miyake, & Elkin,
1995). A neuroscientific approach to vocal attractiveness studies how and where soimd is
represented in the brain, and what types of soimd activate different brain regions
differently (Walpurger, Pietrowsky, Kirschbaum, & Wolf, 2004; Wang, Lu, Snider, &
Liang, 2005). A cognitive approach, explores how voices are processed (Bedard & Belin,
2004; Belin, Zatoixe, Lafaille, Aliad, & Pike, 2000; Fecteau, Armony, Joanette, & Belin,
2005). An evolutionary approach to studying vocal attractiveness takes into account how
voice qualities might be perceived in a mating and/or competitive context (Collins &
Missing, 2003; Collins, 2000; Feinberg & Jacobson, 2001; Hughes, Dispenza, & Gallup,
2004; Huglies & Gallup, 2003; Hughes, Harrison, & Gallup, 2002; Puts, 2005).
2 The chosen path
hi this thesis, I predominantly take an evolutionary approach to vocal attractiveness.
are attiactive can form at a young age (Berry et al., 1994). Other social psychology
studies have shown that certain socially relevant stereotypes such as dominance (Tusing
& Dillard, 2000), maturity (Zuckeiinan et al., 1995) and a pro-social attitude (Zuckerman
& Driver, 1989) may influence vocal attractiveness. The social psychological explanation
does a good job of explaining what stereotypes are attractive, but does not explain how
and why certain stereotypes are attractive. On the other hand, a cognitive approach
studies how voices are processed (see Bedard & Belin, 2004; Burton & Bomier, 2004;
Fecteau et al., 2004). Thus, the cognitive approach answers the question of how certain
voice types might be attractive because of the way they are represented in the brain. An
evolutionary approach is unique in that can combine research on how voices are
processed and encoded (cognitive psychology and behavioural neiu'oscience), with
research on what stereotypes are formed (social psychology), and attempt to explain why
certain types of voices are attractive. This is normally done by applying frameworks
provided by evolutionary theory.
2.1 An evolutionary perspective
According to Andersson (1994) the most studied sexually selected trait in the animal
kingdom is some aspect of a vocalisation (in teiins of number of publications and positive
results). Andersson (1994) tallies 81 species (mostly anurans, birds and insects) in which
some aspect of animal vocalisations are used as displays related to sexual selection. Thus
studying the relationship between animal vocalisations and mate choice has been a
To try to understand how acoustic properties of the human voice relate to mate choice
decisions, one can look aroimd the animal kingdom to find similarities and differences
between species in temis of what different acoustic features signal, and what about the
animals’ ecologies and mating systems change how they are interpreted by perceivers.
The mammalian species that has been studied in a way most like how himians have been
studied, in teiins of vocal production and how the same vocal features relate to mate
choice is red deer {Cei^us elaphiis). Red deer are a species that have ruts, or breeding
seasons, usually every autuimi (McComb, 1987), During the rut, males advertise their
status to females tlirough roar vocalisations. Deer roar vocalisations are special signals,
whereas the signals studied in human vocalisations occur in all voiced speech (Collins
2000; Collins 2003). Nevertheless, the impact of fr equency components of anuran and
avian vocalisations have been studied extensively (see see Fitch & Hauser, 2002; Hauser,
1996, for reviews).
McComb (1991) found that roaring rate of male red deer predicted how attiactive males
were to females. In this experiment, McComb (1991) also manipulated the fundamental
frequency of male red deer roars, but observed no systematic effect on female mate
choice. Reby & McComb (2003) discovered that fonnant frequencies (the resonant
red deer than fundamental fi'equency was (Reby & McComb, 2003). Indeed, male red
deer with large body size (weight) and large vocal-tracts enjoy the highest reproductive
success (Reby & McComb, 2003).
Playback studies have shown that male red deer, whose roars were manipulated to have
large apparent vocal-tracts (indicative of large body size), drew more attention from other
males than male red deer whose roars were manipulated to have small apparent vocal-
tract lengths. This suggests that roaring is not only used in female choice, but male-male
competition (Reby et al., 2005).
Humans on the other hand, show a different pattern in terms of which acoustic properties
of the male voice are attractive to females. Collins (2000) demonstrated that women
prefer men with low frrndamental frequencies, not large vocal-tracts. So, one can ask,
why are particular acoustic properties of the voice attractive in some species, but not
others? The answer may lie in what physical parameters these acoustic properties of the
voice relate to, and how the different ecologies and mating systems of the animals
influence how different species irse different signals of mate quality.
For example, fundamental frequency does not relate to body size in adult humans (Lass
frequency predicts men’s testosterone levels, testicle size tlu'oughout puberty (Harries,
Hawkins, Hacking, & Hughes, 1998; Harries, Walker, Williams, Hawkins, & Hughes,
1997) and testosterone at adulthood (Dabbs & Mallinger, 1999). This later finding
indicates that either pubertal testosterone level correlates with adult testosterone level or
there is some behaviomal relationship between voice pitch and testosterone in adult men.
Nevertheless, testosterone related traits may be attractive in men because they may be
cues to dominance (Mazur & Booth, 1998), long-term health (Rliodes, Chan, Zebrowitz,
& Simmons, 2003) and heritable immunity to infection (Folstad & Karter, 1992; see
chapters 3 & 4 for review). Fundamental frequency might also relate to prenatal
testosterone as prenatal testosterone is involved in setting up testosterone receptors for
use later in life (see Manning, Brundred, & Flanagan, 2002; Mamiing, Bundred, Newton,
& Flanagan, 2003; Newman, Butler, Hammond, & Gray, 2000), although this has not yet
been empirically demonstrated. It is unknown if voice pitch (frindamental frequency) of
red deer relates to homional qualities.
On the other hand, formant frequencies (acoustic features tied to vocal-tract length)
predict body size (heiglit and/or weight) in both red deer and humans (Reby & McComb,
2003; Collins & Missing, 2003). hi male red deer, vocal-tract length is positively related
to reproductive success, hi humans, females have not yet been shown to exhibit
systematic preferences for vocal-tract length. In both species, body size is a likely
indicator of access to resources and status. Red deer appear to use vocal-tract length as an
signals to detemiine body size. Studies have shown that hmnans misuse fundamental
frequency as a cue to body size in adults, when fmidamental fr equency may only relate to
body size tluoughout physical development (Huber, Stathopoulos, Cmione, Ash, &
Jolinson, 1999) and between sexes (Childers & Wu, 1991; Rendall, Kollias, Ney, &
Lloyd, 2005). Thus people seem to overextend the perception of low pitch as being
associated with large body size to adults (Collins, 2000; Fitch 1994; Fitch & Hauser,
1995; Smith et ah, 2005). Thus inaccurate attributions of body size to voice pitch may
overshadow accurate perceptions of size given by formant frequencies, especially in
mate-choice relevant decisions (Collins, 2000; Fitch, 1994; Fitch & Hauser 1995).
2.2 Here we go
The goal of this thesis is to explore vocal attractiveness fr om an evolutionary perspective.
I focus primaiily on how hormones influence vocal quahties and how hoimones influence
how voices are perceived. I utilise correlational and experimental methodologies. Using
coiTelations, I attempt to identify specific acoustic cues to attractiveness and other
attributions that are mate-choice relevant. Then, using manipulations, I test the role of
specific acoustic parameters (in isolation) on attractiveness. Wliilst I am not able to
administer exogenous hoimones (and may not want to as they can act differently than
endogenous hormones by stopping the production of endogenous hoimones), by utilising
natural variation in hormone levels, such as menstrual cycle in women and diurnal sliifts
in testosterone and cortisol in men, I am able to conduct natural experiments investigating
levels and voice qualities; however, due to constraints of space and time, they will not be
reported in this thesis. Briefly, I have foimd, however, that among women, within a
menstrual cycle phase, level of urinary oestrogen metabolite is positively related to
fundamental frequency and foimant dispersion. I have also found that among women,
within a menstrual cycle phase, urinary progesterone metabolite is positively related to
jitter. I found that witliin women, across the menstmal cycle, jitter is elevated in the luteal
(high progesterone) menstinal cycle phase. No other measured acoustic properties (i.e.
fundamental frequency, formant dispersion and shimmer) changed over the menstrual
cycle. Among men, testosterone was negatively related to fmidamental frequency and this
relationship was much stronger than that reported in Dabbs & Mallinger (1999). hi this
study, unfortunately, voices were only recorded in the afternoon. Thus, tracking diurnal
shifts in vocal features was not possible.
First, in chapter 2, I outline how speech signals are represented physically and produced
and interpreted aurally. Next, in chapter 3, I present a short review of topics in sexual
selection relating to sexual dimorphism, hi chapter 4 ,1 present a review of topics relevant
to this thesis in the area of human mate choice. These chapters provide a background for
the empirical work on human attraction to vocal characteristics in the remainder of the
In chapter 5, 1 test for coiTelations between vocal attributes and acoustic properties of the
men and women’s voices. Vocal atti'ibutions include men's and women's ratings of
attractiveness, masculinity/femininity, size, age and health made to peer-aged opposite
sex voices (speaking monopthong vowel sounds). Acoustic measurements include
flmdamental frequency (pitch), foimant dispersion (apparent vocal-tract length), and jitter
and shiimner (periodic variation in the fmidamental fi equency and in the amplitude of the
fmidamental frequency).
The pmpose of chapter 5 is to identify specific acoustic coudâtes of vocal attractiveness.
The purpose of chapter 6 is to isolate acoustic properties of the voice by utilising
manipulations of flmdamental and formant fr equencies applied to vowel sounds. Here I
test the effect of direct manipulations of single and multiple acoustic features on
perceptions of attractiveness, masculinity, size, age and health. I also investigate how
age, height and weight of listeners might affect how listeners perceive different voice
qualities.
The pmpose of chapter 6 is to identify individual differences in preferences for male
voices. There are other potential factors involved in human mate choice decisions that
have not yet been investigated. In other species that paternally invest, such as
sticklebacks and guppies, female condition predicts the strength of their preferences for
humans, similar variation in female preferences for male facial symmetry and facial
masculinity has been observed (Little, Burt, Penton-Voak, & PerTett, 2001; Penton-Voak
et ah, 2003). Tliis variation in preferences may reflect that men with high testosterone are
less likely to he in committed relationships and invest in offspring than men with low
testosterone are likely to be (Biuiiharn et al., 2003; Gray, 2003; Gray, Campbell,
Marlowe, Lipson, & Ellison, 2004; Gray, Chapman et al., 2004; Gray, Kahlenberg,
Barrett, Lipson, & Ellison, 2002). Little et al. (2001) and Penton-Voak et al (2003) found
that attractive women (as rated by themselves and by others) and women with feminine
waist-to-hip ratios had stronger preferences for masculine male face shape than less
attractive and masculine bodied women. This effect was most pronomiced when women
considered male faces as long-term partners. Therefore, attractive and feminine women
are thought to have the strongest preferences for male masculinity because they might
secure masculine men as long-teiin mates. To the best of my lorowledge there is no
published data showing that feminine and attractive women do secure masculine men as
long-tenn mates, a study by DeBrume et al. (unpulished data) supports this hypothesis. If
testosterone is reflected in measures of facial (Penton-Voak & Chen, 2004) and vocal
(Dabbs & Mallinger, 1999) masculmity, than how attractive women consider themselves
to be should also predict preferences for masculinity in men’s voices. I test this
hypothesis in chapter 7. Also in chapter 7 ,1 test if fundamental frequency and perceived
masculinity influence the attractiveness of men’s voices when speaking sentences instead
of vowel sounds. This is an attempt to examine previous work (see chapters 5 & 6) in a
High roaring rate (a correlate of male quality) of male red deer advances the date of
oestrus in female red deer (McComb, 1987). Regarding reproductive cycles in humans,
women appear to prefer masculinity more at fertile parts of the menstrual cycle, as
opposed to less fertile stages (Joluiston, Hagel, Franldin, Finie., & Grammer, 2001;
Penton-Voak & Perrett, 2000b; Penton-Voak et al., 1999). Similarly, if masculinity of
faces and voices reflect common underlying qualities, the menstrual cycle should also
shift women’s preferences for masculinity in men’s voices. Combining predictions from
chapter 7 and those from menstrual cycle studies of face preferences, if women with
featmes reflecting higher oestrogen levels (i.e. atfractive faces and feminine body shapes)
can secure masculine men as long-tenn mates, women with lower oestrogen levels should
show the strongest menstrual cycle shifts in attraction to masculinity in men’s voices. I
test these hypotheses in chapter 8.
All of my own studies that I have mentioned investigate attraction to voices fr om the
opposite sex. Another important factor in sexual selection is dominance and male-male
competition. Manipulations of apparent vocal-tract length in male red deer have been
shown to alter their apparent dominance to other male red deer (Reby et al, 2005).
Manipulations of flmdamental and foimant frequencies should also alter the apparent
dominance of human voices. Attributions of dominance, however, may rely on the
hormonal state of the perceiver. Testosterone changes diurnally and is higher in the
morning than in the afternoon (Dabbs, 1990). As testosterone increases self perceived
subordinate voices) as less dominant when the listener’s own testosterone is raised. I test
these hypotheses hi chapter 9.
Except chapter 5, the studies of mine that I mentioned only encompass women's
attraction to men’s voices. I return to women’s voices in chapter 10. Collins & Missing
(2003) found that female vocal and facial attractiveness were intercoiTelated. Kamachi et
al. (2003) found that people were able to correctly match the identity of faces and voices
with reasonable accuracy. Neither study, however, has identified a potential mechanism
by which these judgements are made, hidividual identity in voices can be discriminated
with striking accuracy using fundamental and formant fiequencies (Bachorowski &
Owren, 1999) -both potential acoustic coiTelates of femininity and attractiveness of
women’s voices (Collins & Missing, 2003). Femininity also plays a strong role in
differentiating individual faces (O'Toole et al., 1998) and in facial attractiveness (Penett
et al., 1998; Rliodes, Hickford, & Jeffery, 2000). Thus, the degree to which femininity is
expressed in the face and voice may explain why attractiveness correlates within and
between the two modalities and why identity in the face can be matched to the identity of
the voice at rates significantly above chance level. One reason facial and vocal femininity
may be expressed to a similar degree is that that both facial femininity (Law Smith et al..
In Press) and women’s voice pitch (Abitbol, Abitbol, & Abitbol, 1999; Chae, Choi,
Kang, Choi, & Jin, 2001) may be positively related to oestiogen levels. In chapter 10,1
explore the potential relationships between voice pitch and an objective measure facial
In chapter 10, I test how cross-modal indices of femininity were related, and if vocal
femininity predicted facial attractiveness. Evidence that femininity of the voice is
attractive, however, is limited. Average configmations of faces (Langlois & Roggman,
1990), non-face visual objects (Halberstadt & Rliodes, 2000, 2003) and music (Repp,
1997) have been found attractive. Nonetheless, preferences for facial femininity have
been shown to supersede preferences for averageness in female faces (Pen*ett et al., 1998;
Perrett, May, & Yoshikawa, 1994). Although Collins & Missing (2003) found that
fundamental frequency of the voice positively predicted vocal attractiveness, they did not
report whether the voice pitch in their sample was representative of that of the general
population. Thus if the mean voice pitch from the sample utilised in Collins & Missing
(2003) was lower than the population mean, any obseiwed preferences for high voice
pitch in Collins & Missing (2003) could have reflected preferences for averageness. In
Chapter 11, this topic will be investigated using fundamental frequency manipulations of
women with high, average and low starting flmdamental frequencies (voice pitch). If men
prefer averageness in women’s voices, adding femininity (raising voice pitch) to already
high-pitched voices increases their attractiveness will make them less attractive. Another
aim of this study is to examine if frindamental fr equency, in isolation, is a salient cue to
female vocal attractiveness.
Lastly, in chapter 12, I will relate my findings to other’s work and the broader
Chapter 2
Acoustics review
1. Differences between human and non-human primate
vocal apparatus
At rest, the adult human larynx is positioned lower in the neck than in non-human
primates (see Fitch, 2000a, for review). The epiglottis of human infants, along witli non
human primates contacts the nasal passages, allowing breathing and swallowing at the
same time. As infants age the larynx di'ops such that by puberty, the female larynx is
nearly at its final position. The male larynx, however, descends fiuther diuing puberty.
After infancy, the larynx is descended enough in both sexes such that people camiot
swallow and breathe at the same time, hi lumians, the lower position of the larynx m the
neck, the larger phaiyngeal cavity and positioning of the tongue allow for a greater range
of phonation than in other animals (Fitch, 2000a, 2000b), although many other animals
appear to move their larynx during vocalisations (Fitch, 2000b; Fitch & Reby, 2001). It
has been suggested that across species, descending the larynx during vocalisation
exaggerates vocaliser size (Fitch & Hauser, 1995; Fitch & Reby, 2001; Ohala, 1983,
2. Some very basic anatomy of
the human larynx
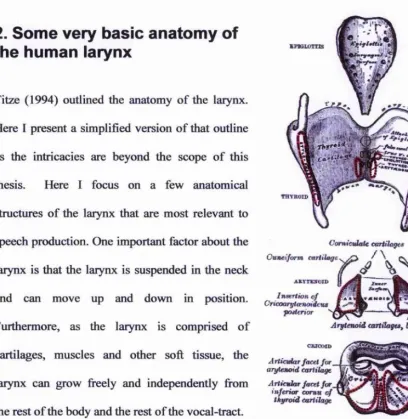
Titze (1994) outlined the anatomy of the larynx.
Here I present a simplified version of that outline
as the intricacies are beyond the scope of this
thesis. Here I focus on a few anatomical
structures of the larynx that are most relevant to
speech production. One important factor about the
larynx is that the larynx is suspended in the neck
CoTtttcuJaU earUlogts
AKTTSSOID
and can move up and down in position.
peutfrior
Furthermore, as the larynx is comprised of
cartilages, muscles and other soft tissue, the
Potienof surface
Argtmoid cartüagts^ base
Artictdar facei for arytatotd cartilage
larynx can grow freely and independently from Artiaiittr facet far
inferior coma of thyroid cartilage
[image:36.612.75.483.90.509.2]the rest of the body and the rest of the vocal-tract.
Figure 2-2. The laryngeal cartilages (Gray, 1918) At the bottom of the larynx is the cricoid cartilage.
This cartilage is signet ring shaped. The anterior end is thin and short, and the posterior
end is wide and tall. The posterior end of the cricoid cartilage looks like a hexagonal
plate with a medial ridge. Above the anterior cricoid cartilage are the thyroid cartilages.
The thyroid cartilage has vertically plate-like shapes that form an angle between 90° and
120° at the anterior end. At the anterior end, there is a notch. The angle of the thyroid
cartilage determines the size of the “Adam’s Apple” (the notch in the thyroid). The
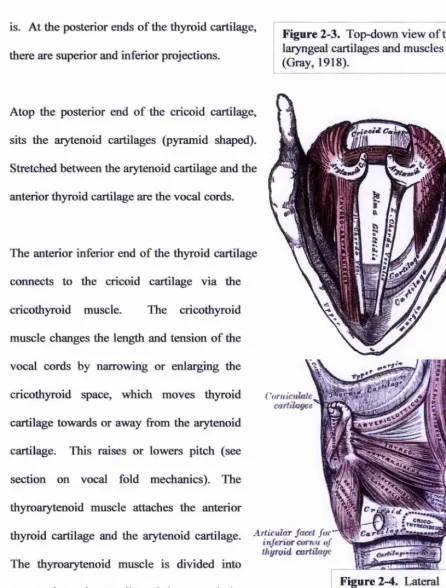
is. At the posterior ends of the thyroid cartilage,
there are superior and inferior projections.
Atop the posterior end of the cricoid cartilage,
sits the aiytenoid cartilages (pyramid shaped).
Stretched between the arytenoid cartilage and the
anterior thyroid cartilage are the vocal cords.
The anterior inferior end of the thyroid cartilage
connects to the cricoid cartilage via the
cricothyroid muscle. The cricothyroid
muscle changes the length and tension of the
vocal cords by narrowing or enlarging the
cricothyroid space, which moves thyroid
cartilage towards or away from the arytenoid
cartilage. This raises or lowers pitch (see
section on vocal fold mechanics). The
thyroarytenoid muscle attaches the anterior
thyroid cartilage and the aiytenoid cartilage. ' ^
thyroid cartilage The thyroarytenoid muscle is divided into
two sections: the vocalis and the muscularis.
Although the full function of the
Figure 2-3, Top-down view of the laryngeal cartilages and muscles (Gray, 1918).
Corniculalc
cartilagcis
[image:37.612.59.506.82.671.2]thyi'oarytenoid muscle is still debated, contraction of the tliyioarytenoid muscles may
shorten and thicken the vocal folds (see Titze, 1994).
3. Vocal fold mechanics
The myoelastic-aerodynamic theory of vocal-fold vibration (van den Burg, 1958) stated
that coupling of airflow to the vocal folds (wliich have elastic properties) produces
sustained oscillation. Voiced speech is caused by vocal-fold vibration (fonnants are
caused by air vibrating; more will follow on fonnants later). Vocal folds must stai't close
enough together such that they can vibrate. Othei*wise, whispers will be produced. The
vocal folds, however, do not have to touch at each glottal pulse for phonation to occur, as
happens during breathy speech. Positive acceleration of the air helps to drive the vocal
folds outwar d. Wlien the vocal folds are closing, acceleration of airflow is negative, thus
helping to close the vocal folds. A key factor in allowing sustained oscillation is the
asymmeti-y in pressure between the opening and closing of the vocal folds. Furthermore,
the vocal folds are not uniform in mass. This leads to a convergent vocal fold shape
while the vocal folds open and a divergent vocal fold shape when vocal folds close. The
motion of vibratmg vocal-folds is like a ribbon and its degrees of fr eedom correspond to
the natural modes of vocal-fold vibration (see Fitch & Hauser, 2002; Titze, 1994, for
review). Multiple mass models or ribbon models of vocal-fold vibration allow for an
1.1 Fundamental frequency
We can derive the fundamental frequency from the length, density and stress of the vocal
folds. Fundamental frequency is inversely proportional to vocal fold length. Vocal folds
will have a constant density and vocal-fold stress is regulated by vocal fold mass (e.g.
thicker rubber bands are more tense when stretched than thinner rubber bands are) and
length (stretched rubber bands have more stress on them than un-stretched rubber bands)
(Titze, 1994). Thus the variable factors involved in the calculation of the fundamental
frequency can be reduced to the density (which is constant within an individual at a given
time), stress and length of the vocal folds. Therefore, we can construct the
equationF = -1 1er L ^ p
o=stress and p=density (Titze, 1994).
, where F=fundamental frequency, L=the length of the vocal folds.
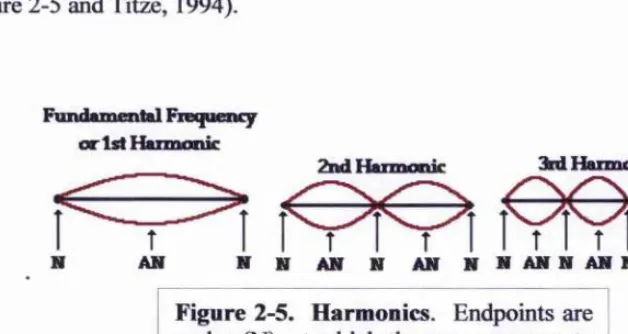
1.2 Harmonics
Harmonic frequencies are produced at integer multiples of the fundamental frequency
(see figure 2-5 and Titze, 1994).
Fundunental Fiequen^ or 1st I&miotiic
2nd Harmonic 3kd H arm onic
I
lYA?)
[image:39.612.111.425.554.721.2]N N AN N AN N N A N N A N N A N N
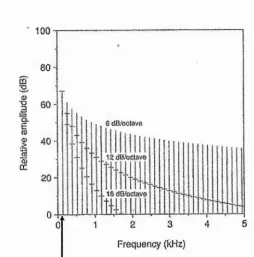
If the amplitude and frequencies of the hamionics are plotted, the amount of energy lost
at the glottis determines the slope of a regression between hamionics frequencies and
their amplitudes (Titze, 1994). This creates either “fluty” (weak harmonics) or “brassy”
sounding voices (strong hamionics) (Fitch & Hauser, 1995).
6 Œ&oomvù
g 40
Frequency (kHz)
[image:40.613.175.430.206.464.2]fundamenta! frequency
Figure 2-6. Illustration of different spectral slopes. Here an amplitude/frequency spectrum
displays 3 spectral slopes of a wavefomi with fundamental frequency of 130Hz (From Titze,
1994, pg 119). The leftmost frequency is the fundamental frequency and frequencies to the right
(of the fmidamental) are hamionics. Increased spectral slope can result from incomplete closure
of the vocal folds diuing vibration. Incomplete vocal-fold closme increases the amoimt of
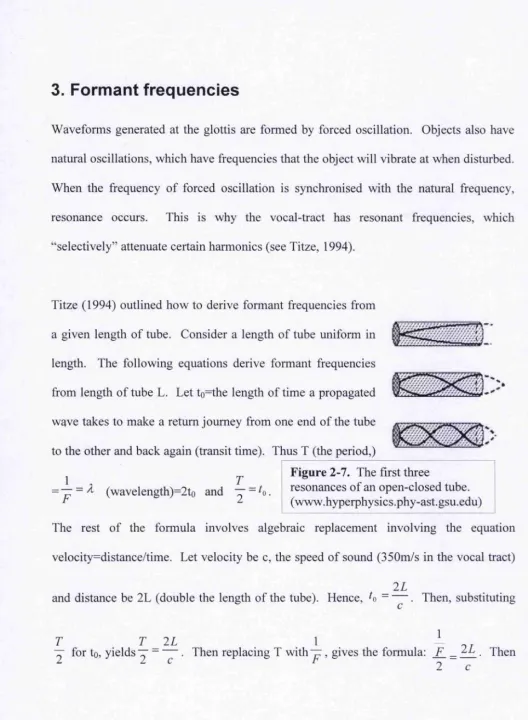
3. Formant frequencies
Waveforms generated at the glottis are formed by forced oscillation. Objects also have
natural oscillations, which have frequencies that the object will vibrate at when disturbed.
When the frequency of forced oscillation is synchronised with the natural frequency,
resonance occurs. This is why the vocal-tract has resonant frequencies, which
“selectively” attenuate certain harmonics (see Titze, 1994).
Titze (1994) outlined how to derive formant frequencies from
a given length of tube. Consider a length of tube uniform in
length. The following equations derive formant frequencies
from length of tube L. Let to=the length of time a propagated
wave takes to make a return journey from one end of the tube
to the other and back again (transit time). Thus T (the period,)
1 _ , T
= ~ - 4 (wavelength)=2to and y -'o
Figure 2-7. The first three
resonances of an open-closed tube. (www.hyperphysics.phy-ast.gsu.edu) The rest of the formula involves algebraic replacement involving the equation
velocity=distance/time. Let velocity be c, the speed of sound (350m/s in the vocal tract)
_
and distance be 2L (double the length of the tube). Hence, . Then, substituting
T T _ 2 L 1
-~ for to, yields” - . Then replacing T with” , gives the formula: Then
[image:41.612.22.551.27.747.2]1 _AL
multiplying each side by 2, yields Then inverting the fractions gives the
z?_ ^ foiinula: ^ ~ .
The above equation set solved the first fomiant frequency given a length of tube.
Formants can be calculated depending on whether the tube is closed on both ends, open
on both ends or closed on one end and open on the other end. If the tube is closed on
both ends, fonnants occur at consecutive integer multiples because as the wave
propagates fr om one end to another, pressure doubles at both ends of the tube, creating
component fr equencies at all natural modes of the tube. If a tube is open on both ends,
fonnants are resonated at even integer multiples. If the tube is open at one end and
closed on the other (as the most common model of the human vocal-tract), fonnants
occiu* only at odd number integer multiples because pressure always doubles at the closed
end (the node, see section on hannonics) but is cancelled when air propagates out of the
open end. Thus, we add a factor that produces odd niunber integers (2n-l) into the above
ALj
equation^, - - i j — , where n=formant number. F= 1 /^.(wavelength), ^ ~AL^ or
1 .
4. Formant dispersion
Classical formant dispersion is the average distance between successive formants (Fitch
1997). If we take an open-closed tube with a length of 17.5cm, the above equation yields
fonnants 500Hz, 1500Hz, 2500Hz and 3500Hz, Thus, in a tube of 17.5cm, the distance
between fonnants is always lOOOHz. A tube of length 15.5cm, yields formants at
564.5Hz, 1693.5Hz, 2822.6Hz and 3951.6 Hz (rounding off to the nearest 10^^). Thus,
the distance between formants is always 1129Hz. Thus, formant dispersion is inversely
related to vocal-tract length,
Fitch & Hauser (2002) explain that although the open-closed tube approximation
provides a model of the vocal-tract that is easily understandable, the glottis opens and
closes many times during phonation. Furthermore, as mentioned earlier when discussing
spectral slopes, the glottis may not always close completely. Therefore, the vocal-tract
also is open on two ends dining portions of phonation, hi an open-closed tube model, a
17.5cm vocal-tract would produce its foimant frequencies at 500Hz, I500Hz, 2500Hz
and 3500Hz (see above) whereas if the same vocal-tract length were open on both ends
would produce formants at lOOOHz, 2000Hz, 3000Hz and 4000Hz. Thus, if using raw
foimant frequencies or the average formant fiequency as our indicator of vocal-tract
length, we could have wildly different estimates depending on whether we caught the
glottis in an open or closed state. By using foimant dispersion, the aforementioned
caveat can be avoided because in both cases (open-closed and open-open), the average
distance between formants is the same (in this case, at VTL=17.5cm, formant
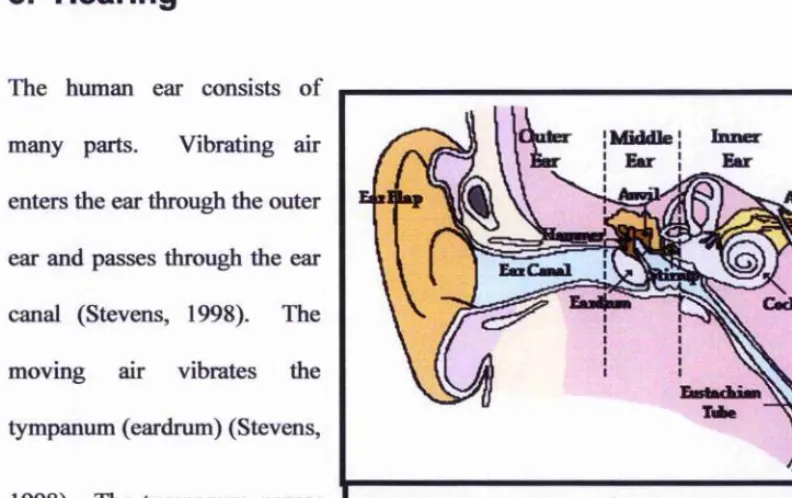
5. Hearing
The human ear consists of
many parts. Vibrating air
enters the ear through the outer
ear and passes through the ear
canal (Stevens, 1998). The
moving air vibrates the
tympanum (eardrum) (Stevens,
1998). The tympanum passes
the vibration of the sound
iter {Middle I biner
I Emr I
Eu-Figure 2-8. Anatomy of the human ear. Image from: http://www.glenbrook.kl2.il.us
wave onto the ear bones (hammer, anvil, and stirrup), which amplify the acoustic signal
(Stevens, 1998). The movement of the stirrup impacts on the oval window which then
vibrates the fluid inside the cochlea, creating a compression wave (Stevens, 1998). The
nerve cells inside the cochlea are hair-like, each tuned to a particular characteristic
frequency (Robles & Ruggero, 2001; Stevens, 1998). Cochlear hair cells are arranged
tonotopically (Robles & Ruggero, 2001). In other words, different positions on the basal
membrane are most responsive to certain frequency ranges. One advantage to a tonotopic
arrangement of cells is that in cases where the frequency of sound is faster than the reset
speed of cochlear hair cells, neighbouring cells will respond such that frequency and
temporal resolution is not diminished in fast moving and high fi*equency sounds (Robles
& Ruggero, 2001). The compression wave in the fluid inside the cochlea stimulates the
[image:44.613.64.460.116.365.2]that are passed on to the auditory nerve and then into the brain for processing (Stevens,
1998).
Hearing is not linear in relation to frequency (Hz). Weber’s law states that higher
frequency sounds will need greater differences to be perceived than lower frequency
sounds do (actually, Weber’s law applies to all perceptions). Thus, perceptual scales of
pitch have been created: bark, semitone, equivalent rectangular bandwidth (ERB) and
mel (Stevens, 1998; Traumnitller, 1990), but see others for criticism of the mel scale
(Greenwood, 1997).
6. Voice processing
Perceptual biases in voice processing could influence preferences because of the mamier
by which they are processed. Here, I outline some perceptual biases.
Wang et al. (2005) showed that in the auditoiy cortex maiinosets {Callithrix jacchus),
sustained firing of neurons was maintained for prolonged periods of time after preferred
auditory stimuli were presented, whereas neuronal firing rates dissipated more rapidly
when non-preferred auditory stimuli were presented. If this result extrapolates to
humans, then neurons in the auditoiy cortex may sustain firing more for attractive than
unattractive voices. Further support for the idea that voices (or perhaps attractive voices)
have special neural representation comes from Belin et al. (2000), who showed that the
superior temporal sulcus (STS) selectively responded to voices (of adults, children,
face-selective area, but also responding preferentially to stimuli that individuals are
highly trained upon (see Penett, Hietanen, Oram, & Benson, 1992, for review).
Following neurological evidence for voice selectivity over non-voice sounds, and for
special neurological representation of prefened soimds, there appears to be a voice
inversion effect (Bedard & Belin, 2004). Wliat this means is that when a spectrum is
inverted over a particular frequency, the ability to discriminate between voices is
reduced. Similar effects have been found in detection of facial symmetry of inverted
faces (Little & Jones, 2003). This suggests that the brain represents faces and voices
differently than other stimuli.
Burton & Bonner (2004) showed that people were able to make sex classifications based
on voice alone quicker if they were familiar with the stimuli than if they were not familiar
with the stimuli. This suggests that people remember identity cues in voices, and use this
infomiation to aid in discrimination of sex. Evidence that familiarity effects extend to
vocal preferences comes from infants (Barker & Newman, 2004). Infants prefer the
sound of their mother’s voices to that of strangers and their fathers. Infants also prefer
soiuids tliat they were exposed to m the womb over novel sounds (see Barker & Newman,
2004, for review). What is interesting here is that father’s voices were not prefened over
strangers voices, suggesting that familiarity alone cannot account for the increased
preference for mothers’ voices. Perhaps there is an interaction between familiarity and
Chapter 3
Sexual selection
1 Natural selection and sexual selection
Selection is the differential survival of genes. Genes code for proteins, which can in turn
produce physical or behavioural traits. Natural selection favours traits that enhance
survival, but are not directly related to reproduction. Examples of naturally selected traits
are body characteristics that suit the enviromnent (e.g. the shape of a bird’s beak or a
prehensile tail in certain new world primates). Sexual selection favours traits that are not
necessarily favoured by natiual selection, but, nonetheless enhance reproductive success.
Examples of sexually selected traits are deer antlers (see Andersson, 1994, for review)
and peacock’s trains (Petrie, 1994). There is an interaction between natural selection
such that ti'aits can evolve via sexual selection to larger sizes only to the extent to which
they do not cause the organism to fail to reproduce. For example, deer antlers may be
sexually selected to be larger in each subsequent generation. If antlers get too large,
however, the animal possessing the antlers may not be able to lift its head and may
therefore die before it is able to reproduce. Therefore, an equilibrium between natural
and sexual selection is often established (see below for review of directional, dismptive
and stabilising selection). There are also many traits where natural selection and sexual
selection overlap (see Caitwright, 2000, for review). For example, natural selection and
sexual selection can favour resistance to pathogens. An organism needs to be resistant to
pathogens to suiwive to reproduce. Also, if resistance to pathogens is inlieritable,
have traits that signal that an individual is resistant to pathogens. Evolution, however,
can only build upon pre-existmg structures. This may explain why for example, humans
do not have antlers, but do have variation in voice pitch between the sexes.
2 Types of selection; stabilising, directional and
disruptive
2.1 Stabilising selection
Stabilising selection is selection against the exti*emes a particular trait such that the
average trait is maintained (Trivers, 1985). In humans, an example of stabilising
selection may be body weight. If an individual (either male or female) is too thin or to
fat, they may not survive to reproduce, or their reproductive potential could be
compromised because of physiological or social reasons.
2.2 Directional selection
Directional selection is selection against one extreme of a trait, such that the mean value
of the trait shifts away from the exti*eme that was selected against (Trivers, 1985). One
example of directional selection in humans is brain size. Thi*oughout the evolution of
Homo sapiens sapiens, brain size has increased over the past 3 million years. There must
have been selection against humans with smaller brains in each generation for this to
have occuiTed. Nevertheless, average human bram size has not changed since a slight

![Dichloro trans bis[tris(2 cyanoethyl)phosphine]palladium(II)](data:image/gif;base64,R0lGODlhAQABAIAAAP///wAAACH5BAEAAAAALAAAAAABAAEAAAICRAEAOw==)