NANOMATERIALS FOR ENERGY STORAGE
Feng Jiao
A Thesis Submitted for the Degree of PhD at the
University of St. Andrews
2008
Full metadata for this item is available in the St Andrews Digital Research Repository
at:
https://research-repository.st-andrews.ac.uk/
Please use this identifier to cite or link to this item: http://hdl.handle.net/10023/487
This item is protected by original copyright This item is licensed under a
Nanomaterials for Energy Storage
A Thesis presented for the degree of
Doctor of Philosophy
in the Faculty of Science of the University of St. Andrews
by Feng Jiao
Declaration
I, Feng Jiao, hereby certify that this thesis, which is approximately 29, 600 words in length, has been written by me, that it is the record of work carried out by me and that it has not been submitted in any previous application for a higher degree.
Date………. Signature of Candidate……….
I was admitted as a research student in January 2004 and as a candidate for the degree of Doctor of Philosophy in January 2005; the higher study for which this is a record was carried out in the University of St. Andrews between 2004 and 2007.
Date………. Signature of Candidate……….
Certification
I hereby certify that the candidate has fulfilled the conditions of the Resolution and Regulations appropriate for the degree of Doctor of Philosophy in the University of St. Andrews and that the candidate is qualified to submit this thesis in application for that degree.
Library Declaration
In submitting this thesis to the University of St. Andrews I understand that I am giving permission for it to be made available for use in accordance with the regulations of the University Library for the time being in Force, subject to any copyright vested in the work not being affected thereby. I also understand that the title and the abstract will be published, and that a copy of the work of the work may be made and supplied to any bona fide library or research worker.
Acknowledgements
I would like to thank my supervisor, Prof. Peter Bruce, for his invaluable ideas and guidance throughout the work, which are essential to make this thesis possible.
I express special thanks to Prof. Andrew Harrison, Prof. Alan Chadwick, and Prof. Jean-Claude Jumas for their idea and time to collaborate on the work presented in this thesis.
Thanks to all the people who help me on many things: Mrs. Sylvia Williamson for measuring nitrogen adsorption and chemical analysis, Dr. Aurelie Debart for demonstrating the assembly of coin and Swagelok type cells, Mr. Adrian Hill for collecting SQUID and neutron data, and other people in PGB group for their help.
Also, I would like to thank my friends, Dr. Zhuojia Lin, Ms. Jianli Bao, Mrs. Li Meng and Mr. Dengke Xiao, who have made my time at St Andrews so enjoyable.
Contents Page
Abstract i-ii
Chapter 1. Introduction 1-24
Chapter 2. Routine experiments and characterization techniques 25-35 Chapter 3. Synthesis, characterization, and magnetic properties of
mesoporous iron oxides with amorphous walls 36-45
Chapter 4. Synthesis, characterization, and magnetic properties of mesoporous transition metal oxides prepared by the hard template method
46-77
Chapter 5. Electrochemical properties of nanowire and mesoporous
transition metal oxides with crystalline walls 78-94
Chapter 6. Characterization of mesoporous materials synthesized by
post-templating method 95-121
Chapter 7. Ordered three-dimensional arrays of monodispersed Mn3O4
nanoparticles with a core- shell structure 122-132
Chapter 8. Conclusions 133-134
Publication list I
Abstract
The results presented in this thesis demonstrate the first synthesis of several nanostructured transition metal oxides and lithium containing transition metal oxides. Their uses in lithium-ion batteries and/or as magnetic materials have been investigated.
The first example of two and three dimensional mesoporous Fe2O3 has been prepared by using the soft templating (surfactant) method. The materials have amorphous walls and exhibit superparamagnetic behaviour.
By using a hard template route, a mesoporous α-Fe2O3 with highly crystalline walls has been synthesized. Its unique magnetic behaviour, distinct from bulk α-Fe2O3, nanoparticulate α-Fe2O3, and mesoporous Fe2O3 with disordered walls, has been demonstrated.
The hard template method was also used to prepare nanowire and mesoporous Co3O4, β-MnO2 and Mn2O3 with crystalline walls. Their electrochemical properties as electrodes in Li-ion batteries have been investigated. Mesoporous β-MnO2 can accommodate 0.9 Li/Mn in stark contrast to bulk β-MnO2 which cannot accommodate Li.
To prepare mesoporous materials which cannot be obtained directly by the hard template method, a post-templating route has been developed. Mesoporous Fe3O4, γ -Fe2O3, and Mn3O4 with ordered mesostructures and highly crystalline walls have been obtained by post-synthesis reduction/oxidation treatments. All the materials show unique magnetic properties compared with nanoparticulate and bulk materials.
Also, the first example of lithium containing mesoporous material, LT-LiCoO2, was synthesized by first preparing mesoporous Co3O4, then reacting this with LiOH to form LT-LiCoO2, with retention of the ordered nanostructure. The nanostructured LT-LiCoO2 compounds demonstrate superior performance compared with normal or nanoparticulate LT-LiCoO2, when used as intercalation electrodes in lithium batteries.
Chapter 1. Introduction
1-1 Mesoporous solids
1-1-1 General introduction into mesoporous solids
Mesoporous materials belong to the wider class of nanostructured materials. They
are composed of nano-sized pores (pore size from 2 to 50 nm) between which are thin
walls (typical thickness below 10 nm).1 The first ordered mesoporous silica material
MCM-41 was reported by the Mobil Company in 1992, which has two-dimensional
hexagonal packed pores without any connection between them (Figure 1).2, 3 It has a
typical pore size (pore diameter determined by N2 sorption analysis) of ~ 2.5 nm and a
wall thickness ~ 1.8 nm. The BET specific surface area and pore volume determined
by sorption measurements are ~ 1000 m2/g and ~ 0.9 cm3/g, which are significantly
larger than bulk materials. Because of the large internal surface area and pore volume,
MCM-41 is important in many fields, such as catalysis, gas storage, and molecular
filters.4-6 However, the ultra thin wall thickness (below 2 nm) results in an unstable
pore structure for practice proposes, especially in catalytic reactions. A thick wall
(high stability) is important in overcoming this deficiency.
Figure 1. A typical TEM image of MCM-41.
In 1998, GD Stucky’s group prepared a new mesoporous silica SBA-15, which
not only has better thermal stability, due to thicker walls (~ 3.5 nm) but also larger
pores, with a typical size 8 nm.7 This material has a hexagonal packed
one-dimensional mesoporous structure (Figure 2), similar to the pore structure of
pores, resulting in a 3D pore network. This is because part of polymer template (P123
which was used in SBA-15 preparation) became embedded into the silica walls during
the self-assembly process. On its removal by calcination at high temperature,
micropores were created. Such microporosity had influences on the structure of
replica mesopores cast from SBA-15. This will be discussed in the hard template
method section.
Figure 2. TEM images of SBA-15 recorded along (a) [001] and (b) [110]
directions.
In addition to the stability of mesostructure, the accessibility of the internal
surface area is also important. One way to achieve this is to create three-dimensional
rather than one-dimensional (e.g. MCM-41 and SBA-15) mesopores so that even if
some pores are blocked, others are available. Recently, a group in Korea has
successfully synthesized three-dimensional mesoporous silica (KIT-6) in a
butanol-water-polymer system.8 A typical TEM image and pore structure model for
KIT-6 are shown in Figure 3.9, 10 This material has thick walls (~ 4 nm), a large
surface area (~ 800 m2/g), large pore size (~ 7 nm) and a 3D bi-continuous pore
network. Due to these superior properties, mesoporous KIT-6, which exhibits good
stability, may be a good candidate for many applications, such as high temperature
catalysis, large molecule separation, and as a hard template, with which to synthesize
Figure 3. (a) a typical TEM image for KIT-6 recorded along [111] direction; (b) a
schematic diagram for KIT-6 pore structure. A, B, and C in (b) indicate the
channels.10
Although many approaches have been developed to synthesize mesoporous silica
materials, it is still difficult to apply these methods to the preparation of non-silica
mesoporous materials, such as mesoporous carbon and mesoporous transition metal
oxides. Among these mesoporous non-silica materials, mesoporous transition metal
oxides are important targets, because such solids can combine open d-shells, high
surface area, limited wall thickness and open pore networks, with the result that they
may exhibit many interesting properties in catalysis, electron transfer, energy
conversion and storage, and magnetic devices.11-17 The first synthesis of a mesoporous
transition metal oxide TiO2 was reported by Jackie Y. Ying and her co-workers in
1995, using long chain alkyl amines as templates.18 This ‘ligand-assisted’ method was
also used to prepare mesoporous Nb2O5.16 Following their work, many groups began
to explore the synthesis, properties, and possible applications of mesoporous
transition metal oxides. Several mesoporous transition metal oxides have been
successfully prepared, such as TiO2, ZrO2, Nb2O5, SnO2, Ta2O5, WO3, and MnOx.17, 19, 20 Some typical TEM images of the pore structures of mesoporous transition metal
oxides are shown in Figure 4. These materials have been widely studied as catalysts,
electrodes, and optical materials.5, 12 Synthesis methods for mesoporous transition
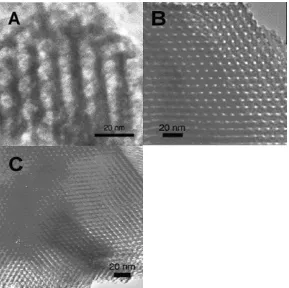
Figure 4. Typical TEM images of mesoporous transition metal oxides: (A) TiO2,
(B) ZrO2, and (C) Nb2O5.19
1-1-2 Soft template method
The soft template method may be further divided into two categories: (a) using
poly(alkylene oxide) block copolymers as structure-directing agent (neutral
templating method); (b) using amine surfactants as template (ligand-assisted
templating method). By using these soft template methods, the final materials usually
have a large surface area (> 200 m2/g). For example, mesoporous TiO2 with a specific
surface area as large as 500 m2/g has been prepared by using copolymer P123 as soft
template.21
Nevertheless, the materials prepared by soft templating have their limitations.
The resulting product, just like the silica materials prepared by similar approaches,
usually has poorly crystalline or amorphous walls and poor thermal stability.22 Also,
despite much effort, the range of mesoporous transition metal oxides which can be
prepared by this soft template method is limited because of the complicated synthesis
To synthesize mesoporous transition metal oxides by soft templating, because of
their potentially unique properties, required a novel approach, which should ideally be
a simple procedure to obtain materials with controllable pore sizes and pore
structures.
1-1-3 Hard template method
The hard template method was first introduced by Ryoo and Terasaki.23 They
reported the synthesis of three-dimensional mesoporous Pt by using MCM-48 as hard
template. The schematic diagram representing the process is shown in Figure 5. The
empty ordered mesopores of MCM-48 are first filled with inorganic precursors; the
precursor is then converted to the dense material by for example, reduction or
decomposition, to form the desired material inside the pores. Then, the mesoporous
silica template is removed using a hot 2M NaOH or a 10% HF solution and after
washing with water a material replicating the mesostructure of the hard template is
obtained. This method has been developed to prepare mesoporous carbons, such as
CMK-1, CMK-3, and CMK-6.24-26
Figure 5. Schematic diagram of hard template synthesis.
The first preparation of three-dimensional highly crystalline porous transition
metal oxides by the hard template route was reported by Zhu and co-workers.27 Using
amine group grafted SBA-15, they obtained porous Cr2O3 with highly ordered pores
and highly crystalline (single-crystal like) walls. The mesostructure consisted of
nanowires connected by short bridges (Figure 6), which replicate the pore structure of
SBA-15. Via a similar approach, porous Fe2O3 with a similar nanowire-bundle
phenol hydroxylation.28 Almost simultaneously, Zhao’s group reported a series of
porous transition metal oxides, such as Co3O4, NiO, MnxOy, and Fe2O3, prepared
using microwave/HNO3 treated SBA-15 as hard template.29
The hard template procedure offers a number of advantages. The mesostructure of
the target material may be controlled by selecting different templates, because many
mesoporous silicas with different porous structures are already known.
Figure 6. (a) Mesostructure model and (b) HRTEM image for mesoporous Cr2O3.
The arrows indicate the small ‘bridges’ between the wires.27
Also the hard template method permits the synthesis of mesoporous materials
with highly crystalline walls, which is a breakthrough in mesoporous material
research. Before the introduce of the hard template method, all previously reported
mesoporous materials including silicas, aluminosilicates and transition metal oxides
had amorphous or poorly/semi- crystalline walls, which usually exhibit poor thermal
stability.4, 13, 15, 19 It is known that well crystallized zeolites are much more stable than
the amorphous/poorly crystalline mesoporous silicas in catalytic reactions.
Furthermore, many important properties, such as magnetic and electrochemical
properties, may be influenced by the crystallinity of the walls. For example, the
magnetic behaviour of amorphous and highly crystalline mesoporous Fe2O3 proved to
be completely different.22 Electrode materials with a highly crystalline structure
perform better as intercalation hosts than the amorphous materials.
transition metal oxides still has its limitations. The target material must be stable in
NaOH or HF solution, used to remove the silica template. For example, the synthesis
of mesoporous vanadium oxide hasn’t been successful using mesoporous silica as the
hard template, because vanadium oxide dissolves in NaOH and will react with HF. A
solution step is still required as the means of introducing the transition metal
precursor and this limits the range of materials to those stable in solution. Also,
materials for which the precursors react with the mesoporous silica cannot be obtained
(e.g. lithium). Mesopores will also collapse if the desired phase requires heating
above 900 oC.
1-2 General introduction into nanoparticles of transition metal oxides
Nanoparticulate transition metal oxides can exhibit enhanced optical magnetic
and electrical properties compared with their bulk counterparts, rendering such nano
particles of interest for a variety of applications, e.g. as electrodes in energy storage
devices, as catalysts and as magnetic storage devices.30-34 Generally, nanoparticles
exhibit a distribution in their size; however, synthesis routes leading to the formation
of monodispersed particle sizes are becoming more available (Figure 7).30, 32 Such
monodispersity is particularly important in the case of nanoparticles, because of the
influence of size on their properties. For example, bulk magnetite Fe3O4 is
ferromagnetic; however nano-sized Fe3O4 exhibits superparamagnetic behaviour.30
And the blocking temperature can be justified by changing the particle size. In another
case, Tarascon and co-workers reported the effect of particle size on the reactivity of
α-Fe2O3 powders when reacted with metallic lithium.35 Large particles in the
micrometric range (~0.5 μm, 2 m2/g) undergo an irreversible transformation of the
close-packed anionic array hexagonal (α-Fe2O3) to a disordered cubic stacking
(Li2Fe2O3) as soon as a small amount of lithium (xc = 0.03 Li/Fe2O3) is inserted in the
corundum structure. However, when the particle size is reduced to about 20 nm (60
m2/g), Fe2O3 nanoparticles can reversibly and topotactically react with up to 1 Li per
formula unit without phase transformation.35
thermal decomposition of metal acetylacetonates, metal alkoxides and metal
carbonyls in complex organic solvent systems can lead to metal oxide nanoparticles
with uniform sizes.30, 32, 36 The thermal decomposition usually was undertaken under
nitrogen or argon protection. The oxidation state of the metal in final products is
sometimes different from that of metal in precursors, which may be due to
self-oxidation/reduction during decomposition. Several transition metal oxide
nanoparticles with a uniform particle size, such as γ-Fe2O3, NiO, MnO, and Fe3O4,
[image:16.595.91.455.259.633.2]have been prepared.30, 32, 36 This makes their uses in many applications possible.
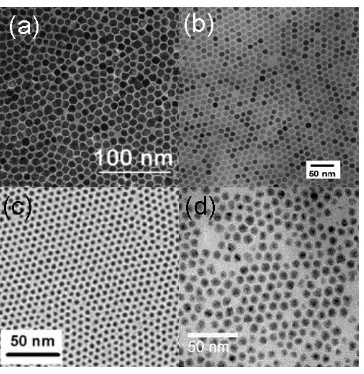
Figure 7. TEM images for (a) MnO, (b) Fe3O4, (c) NiO, and (d) CuO
nanoparticles.30, 32, 36, 37
It has been found that monodispersed nanoparticles can self-assemble into 2D or
3D ordered arrays, with which materials may exhibit unique electronic, optical and
magnetic behaviour by interactions between neighbouring particles. Self-assembly
transition metal oxide nanoparticulate arrays, such as Fe3O4, MnO, Fe2O3, and Cu2O,
were reported.38-40 For example, highly ordered 3D array of MnO nanoparticles has
been obtained by controlling the solvent evaporation process (Figure 8).37 This
technique was also used in preparation of other transition metal arrays. Very recently,
Co3O4 nanoparticulate array was reported by a surface modification technique.
Monodispersed Co3O4 nanoparticles were treated by reducing agents and a thin layer
of cobalt metal formed on the particle surface. The authors claimed that the
introduction of a thin cobalt layer which is superparamagnetic enables the
self-assembly into ordered arrays. This result indicates that the core-shell structure
[image:17.595.90.263.313.474.2]may influence the magnetic behaviour of nanoparticles and the self-assembly process.
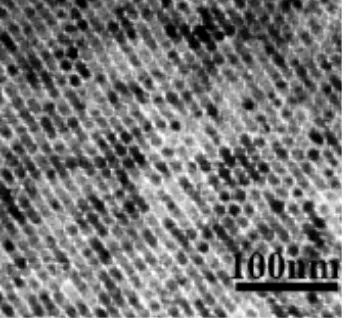
Figure 8. TEM image of 3D arrays of MnOnanoparticles.37
1-3 Rechargeable lithium-ion batteries
1-3-1 General introduction into rechargeable lithium-ion batteries
Batteries store electrical energy in a chemical form, and rechargeable batteries do
so reversibly. The lithium-ion battery is one of the most important innovation in
rechargeable (secondary) batteries in 100 years.41-43 The lithium-ion battery has many
advantages over other rechargeable batteries, such as storing up to three times more
energy, working at higher voltage (~ 3.5 V) rather than ~ 1.5 V for traditional batteries,
and providing green batteries which do not produce any carbon dioxide or toxic
Figure 9. Schematic diagram of lithium-ion battery.
A lithium-ion battery containing Li consists of a positive electrode, which is
usually an intercalation solid (normally LiCoO2), a negative electrode which is
usually another intercalation compound (normally graphite), and an electrolyte
(composed of a Li salt, LiPF6, dissolved in a non-aqueous solvent, mixture of ethylene
and dimethyl carbonate), Figure 9. When it is charged, the lithium ions are removed
from the positive electrode, pass through the electrolyte and are inserted into the
negative electrode; while when it is discharged, the lithium ions are removed from
negative electrode, pass through the electrolyte and reinserted into the positive
electrode. This type of battery is safer than batteries containing lithium metal instead
of graphite because lithium metal may cause serious safety problems especially due to
dendrite formation on charging. After the first commercialized lithium-ion battery
(LiCoO2/C) was produced by the Sony Company in 1991, billions of lithium-ion
batteries have been produced every year and widely used in many applications, such
as laptops, mobile phones, digital cameras and recently power tools.44
The lithium-ion battery market is growing very rapidly, but it demands scientific
research and development to deliver improvements. Many new markets require more
powerful lithium-ion batteries, i.e. a battery that can be discharged and charged much
more quickly than the present devices. The electrodes used today support only slow
charge/discharge rates, because of their low surface area and long diffusion path for
ions and electrons within the particles due to large (μm) particle sizes. Materials with
high surface area and short lithium diffusion path are required for future applications,
such as power tools and hybrid electric vehicles. Such markets also require cheaper
other materials, higher capacity materials, such as Li-metal alloys, Si or Sn based
anodes and new transition metal oxides, have been investigated as negative
electrodes.
All the above points indicate that novel electrode materials hold the key to future
cheaper, safer, and more powerful lithium-ion batteries. In the following paragraphs,
historic and current developments in positive and negative electrode materials will be
discussed in greater detail.
1-3-2 Positive electrode material
In the 1980s, Goodenough proposed a series of layered LiMO2 (M = Ni or Co)
electrode materials. LiCoO2 is still the most widely used positive electrode material in
commercial cells.45 LiCoO2 crystallizes in the space group R-3m with lattice
parameters a = 2.814 Å and c = 14.048 Å (Figure 10). The crystal structure consists of
a lithium layer between two transition metal oxide layers, from which lithium can be
removed and reinserted without destroying the structure. Although the theoretical
discharge capacity is ~ 274mAh/g (based on Co3+-Co4+, corresponding to the reaction
Li+ + CoO2↔ LiCoO2 – e-), only half of the lithium can be removed and reinserted
reversibly from this layered structure and thus only ~ 130 mAh/g capacity is achieved
in a real cell. LiCoO2 discharges at ~ 4V with good capacity retention (capacity fade
at ~ 0.1% per cycle). However, because cobalt is toxic and expensive, many other
Figure 10. Crystal structure of layered LiCoO2. Green, blue, and red balls
represent lithium, cobalt, and oxygen atoms, respectively.
LiMnO2 with a similar layered structure was proposed to be a good electrode
material due to the low price, low toxicity and high safety. However, direct synthesis
of LiMnO2 with a layered structure was not successful. In 1996, Bruce’s group
reported the first example of layered LiMnO2, essentially isostructural with LiCoO2,
through a Li+ ion-exchange process with NaMnO2.46 This layered LiMnO2 compound
with space group of C2/m (Figure 11) delivers a much higher first charge capacity (~
270 mAh/g) than that of LiCoO2 (~ 130 mAh/g). However, it suffered a continuous
structure change during cycling and it converted to spinel. Recent studies indicate that
conversion forms nanodomains of spinel that in fact exhibit good capacity retention in
both 3V and 4V ranges. Although layered LiMnO2 suffered a safety problem (O loss
from layered material on heating), layered materials based on LiMnO2, specially
Li(Ni0.5Mn0.5)O2 and Li(Ni1/3Co1/3Mn1/3)O2 are receiving a great amount of
attention.47, 48 Recent reports confirmed the oxidation states of Ni and Mn in these
materials are 2+ and 4+, respectively. Mn4+ does not migrate to the Li layer or form
spinel, while the Ni2+ switches between Ni2+ and Ni4+ on cycling. Li(Ni0.5Mn0.5)O2
has a high theoretical capacity (~ 280 mAh/g) and delivers ~ 180 mAh/g on the first
cycle. Its rate capacity is poor, because of ~ 10 % Ni existing in the Li layers. It has
than 5% and rate capacity is better than that of material prepared by conventional
solid state reaction. The Li(Ni1/3Co1/3Mn1/3)O2 phase contains cobalt which reduces
the Ni/Li exchange and increases electronic conductivity. Recent results by Bruce’s
group showed that such a material may be synthesized which delivers above 200
mAh/g at 1C and 175 mAh/g at 10C (discharge in 6 mins).
Figure 11. The crystal structure of layered LiMnO2. White, blue, and red balls
represent oxygen, manganese, and lithium atoms, respectively.
In addition to the well-known layered structures, materials with the spinel
structure have also been considered, such as low temperature LiCoO2, LiMn2O4, and
LiFe5O8.49-51 Among these spinel compounds, LiMn2O4 is the most important one
because manganese is cheap and of low toxicity. The LiMn2O4 spinel structure is
shown in Figure 12 (cubic Fd-3m space group). The structure consists of a cubic close
packed oxygen subarray with Mn ions in the 16d sites and Li ions in the 8a sites. The
material may be charged to remove one lithium from the structure to form λ-MnO2. In
the following discharging, ~ 1 Li can be reinserted into λ-MnO2 with two plateaus,
one at 4.1V and the other at 3.9V, which correspond to lithium insertion into
tetragonal sites in LixMn2O4 (0<x<1). Beyond Li1Mn2O4, Li may also be inserted and
removed over the range 1<x<2 in LixMn2O4; this occurs at ~ 3V. Electrode dissolution
is not too serious and this can be improved further; less than 6% capacity fading after
50 cycles in 4V range has been achieved by doping ~ 7 % Li in this compound
(Figure 13). However, 7 % Li doping reduces the amount of Mn3+ in the compound so
Further discharging to 3V range will reduce the average oxidation state of Mn below
+3.5 and introduces the Jahn-Teller distortion (a two phase reaction between cubic
LiMn2O4 and tetragonal Li2Mn2O4). Therefore, the 3V process is less reversible than
the 4V range.50, 51 Breaking up the big crystals into nanodomains via ball milling
showed significant improvement in the cycling performance in this range, which
indicates that nanostructuring may be helpful in achieving superior performance of
the material.52
Figure 12. Crystal structure of LiMn2O4 spinel. Green and red balls represent
lithium and oxygen atoms, respectively.
0 10 20 30 40 50
0 20 40 60 80 100 120 140
Discharge Capacity
(mAh/g)
Cycle number
Figure 13. Cycling data for Li1.07Mn1.93O4. Voltage range: 3.2 – 4.5V; current
Figure 14. Crystal structures for (a) α-MnO2, (b) γ-MnO2, and (c) β-MnO2. Red
balls represent oxygen atoms.
Although most of well-known positive electrode materials contain lithium, some
transition metal oxides, such as V2O5 and MnO2, have been considered as potential
positive electrodes.53 Recent advances in the research of lithium metal as an anode,
although not achieving commercial performances, do represent successful progress.
Also the possibility of chemical methods for pre-lithiating the negative electrode,
including in situ, makes it possible to use a variety of materials, e.g. graphite, Si, Sn,
with positive electrodes that are devoid of lithium. Manganese dioxide as well as
cation stabilized manganese dioxide has been widely studied for more than 20 years.
There are three main phases: α-MnO2 (2*2 structure), γ-MnO2 (2*1 structure), and
β-MnO2 (1*1 structure), where the numbers refer to the number of MnO6 octahedra
forming the tunnels, Figure 14. Among them, amorphous or poorly crystalline MnO2,
primary and secondary batteries. Although the discharge voltage (M vs. Li) is low (~
3 V), the discharging capacity (more than 150 mAh/g) is comparable to other positive
electrode materials.53 The β-MnO2 with 1*1 tunnels (Figure 14c) was considered as
an electrochemical inactive material in previous studies because of the difficulty of
insertion of lithium into its small channels.
1-3-3 Negative electrode materials
Although lithium metal has a high gravimetric energy density (3600 mAh/g),
dendrite forms on charging that limits its cycleability and safety. As a result
alternative negative electrodes were sought in order to develop a battery that would be
commercially successful. In the 1980s, Armand, Murphy, and Scrosati first introduced
and successfully developed the concept of using an intercalation material as the
negative electrode to replace Li and hence introduced the concept of the rocking-chair
lithium-ion battery.
Figure 15. Schematic diagram of graphite structure.
As negative electrode, graphite has a lot of advantages, such as extremely low
cost, non-toxicity, good conductivity and a sufficiently low electrochemical potential
to obtain a good cell potential (> 3V), therefore it is still the most widely used in
commercial lithium-ion batteries. Graphite has a well-known layered structure with
hexagonal carbon sheets parallel each other in an ABAB… stacking along c-axis
(Figure 15), which exhibits a reversible discharge capacity of ~ 300 mAh/g and a
capacity as low as 372 mAh/g (based on LiC6) and low volumetric capacity (1000
mAh/cc) of carbon, other candidates (i.e. metal alloys) were investigated.
Metals, such as Al, Sn, and Sb, react with lithium and form alloys at low
potentials vs. Li. Much of early work focused on Li/Sn alloys because their high
theoretical capacity (~ 1000 mAh/g, based on lithiated phase Li17Sn4) and large
theoretical volumetric capacity (~ 7000 mAh/cc).55, 56 However, this material suffered
a safety problem due to the large volume change (~ 250 %) on cycling. Intermetallic
composites were considered as alternative solutions to solve this problem. By
introducing an electrochemical inactive metal, Sn shows a better performance in metal
matrix hosts, such as Fe, Ni, Mn, and Co.57 However, this reduces both theoretical
gravimetric and volumetric capacities.
Figure 16. Cycling data for bulk Co3O4 between 0.005 V and 3 V with a current
density of 100 mA/g.
Recently, Tarascon and co-workers developed a series of transition metal oxides
as negative electrode materials, which showed much higher discharge capacity (~ 900
mAh/g) than that of graphite (less than 360 mAh/g).58 Many transition metal oxides,
such as Co3O4, CoO, FeO, NiO, and Cu2O, have been investigated. Among them,
Co3O4 showed the highest discharge capacity (~ 800 mAh/g) and an excellent
capacity retention (nearly no fading after 50 cycles), Figure 16.58 The reaction
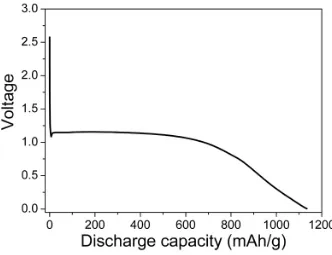
mechanism has been described as conversion reaction (Figure 17). When it is
forms LixCo3O4, following by the decomposition of LixCo3O4 into nano-sized Co
metal particles which are embedded into lithium oxide matrix. A polymer surface
layer is formed on the particle surface simultaneously. This conversion reaction
delivers a very high capacity with a discharge plateau at ~ 1.1 V (see Figure 18).
When it is charged, Co metal and lithium oxide nanoparticles can reform cobalt oxide
(CoO). Such a conversion reaction can be cycled reversibly many times without
capacity fading (Figure 16). Because of the cost and toxicity of cobalt, many other
transition metal oxides, such as Cu2O, FeO, and NiO, are considered.58 Cu2O with
large particle size showed very good capacity retention but had a relative low capacity
(~ 600 mAh/g).59 FeO and NiO gave high first discharge capacities (~ 1000 mAh/g),
but they have poor capacity retention.58
Following the discovery of conversion reaction in oxides, other materials, such as
transition metal sulfides, nitrides and phosphides were also investigated as negative
electrodes in lithium-ion batteries.60-62 These materials deliver a high capacity (>600
mAh/g); however, their synthesis is usually difficult and most of them are
air-sensitive, which limits their uses as negative electrodes in commercial cells.
Figure 18. First discharge plot for bulk Co3O4.
1-3 Aim of this research
Recognizing the limitation that the present templating method placed on the range
of mesoporous transition metal oxides that can be synthesized, new ways in which
new mesoporous materials can be prepared that were not previously possible are
required. This includes transition metal oxide mesopores in previously inaccessible
oxidation states and the first examples of lithium containing mesopores.
As described above, new electrode materials hold the key to future safer, cheaper,
and environmental friendly lithium-ion batteries. Furthermore, new markets for
lithium-ion batteries require more powerful batteries for many future applications. To
meet the requirement of powerful batteries, fast intercalation/deintercalation of
lithium from both electrodes is required to deliver the high current. Nano-sized
electrode materials with short lithium and electron diffusion paths and a large surface
area in contact with the electrolyte would be ideal for high rate applications. However,
previous work showed that nanoparticles became disconnected from each other due to
their expansion and shrinkage during cycling, resulting in capacity fading.
micron size particles ensure better interparticle contact than for nanoparticles, while
the electrolyte can flood the pores providing a high contact area. The thin walls ensure
rapid lithium intercalation/deintercalation.
In addition to their electrochemical properties, nanomaterials (e.g. nanoparticulate
and mesoporous transition metal oxides) have potentially unique magnetic properties.
Previous reports showed that nanostructured materials, such as nanoparticles with a
core-shell structure and mesoporous materials, exhibited unusual magnetic behaviours.
However, due to the limitation of their synthesis methods, the range of materials can
be synthesized are limited. With the aid of new simple and straight-forward synthesis
methods, novel nanomaterials may be prepared and the investigation of their
properties will be possible.
1-4 References
1 K. S. W. Sing, D. H. Everett, R. A. W. Haul, L. Moscou, R. A. Pierotti, J.
Rouquerol, and T. Siemieniewska, Pure and Applied Chemistry, 1985, 57, 603. 2 M. Kruk, M. Jaroniec, Y. Sakamoto, O. Terasaki, R. Ryoo, and C. H. Ko,
Journal of Physical Chemistry B, 2000, 104, 292.
3 J. S. Beck, J. C. Vartuli, W. J. Roth, M. E. Leonowicz, C. T. Kresge, K. D.
Schmitt, C. T. W. Chu, D. H. Olson, E. W. Sheppard, S. B. McCullen, J. B.
Higgins, and J. L. Schlenker, Journal of the American Chemical Society, 1992,
114, 10834.
4 M. Antonietti and G. A. Ozin,
Chemistry-a European Journal, 2004, 10, 29. 5 J. Y. Ying, C. P. Mehnert, and M. S. Wong,
Angewandte Chemie-International
Edition, 1999, 38, 56. 6 A. Corma,
Chemical Reviews, 1997, 97, 2373.
7 D. Y. Zhao, J. L. Feng, Q. S. Huo, N. Melosh, G. H. Fredrickson, B. F.
Chmelka, and G. D. Stucky, Science, 1998, 279, 548. 8 F. Kleitz, S. H. Choi, and R. Ryoo,
Chemical Communications, 2003, 2136. 9 Y. Sakamoto, T. W. Kim, R. Ryoo, and O. Terasaki,
Angewandte
10 B. Z. Tian, X. Y. Liu, L. A. Solovyov, Z. Liu, H. F. Yang, Z. D. Zhang, S. H.
Xie, F. Q. Zhang, B. Tu, C. Z. Yu, O. Terasaki, and D. Y. Zhao, Journal of the
American Chemical Society, 2004, 126, 865.
11 G. J. D. Soler-illia, C. Sanchez, B. Lebeau, and J. Patarin,
Chemical Reviews,
2002, 102, 4093.
12 D. E. De Vos, M. Dams, B. F. Sels, and P. A. Jacobs,
Chemical Reviews, 2002,
102, 3615.
13 U. Ciesla and F. Schuth,
Microporous and Mesoporous Materials, 1999, 27,
131.
14 A. Sayari and P. Liu,
Microporous Materials, 1997, 12, 149. 15 D. M. Antonelli and J. Y. Ying,
Current Opinion in Colloid & Interface
Science, 1996, 1, 523.
16 D. M. Antonelli, A. Nakahira, and J. Y. Ying,
Inorganic Chemistry, 1996, 35,
3126.
17 Q. S. Huo, D. I. Margolese, U. Ciesla, P. Y. Feng, T. E. Gier, P. Sieger, R. Leon,
P. M. Petroff, F. Schuth, and G. D. Stucky, Nature, 1994, 368, 317. 18 D. M. Antonelli and J. Y. Ying,
Angewandte Chemie-International Edition in
English, 1995, 34, 2014.
19 P. D. Yang, D. Y. Zhao, D. I. Margolese, B. F. Chmelka, and G. D. Stucky,
Nature, 1998, 396, 152.
20 Z. R. Tian, W. Tong, J. Y. Wang, N. G. Duan, V. V. Krishnan, and S. L. Suib,
Science, 1997, 276, 926.
21 P. C. A. Alberius, K. L. Frindell, R. C. Hayward, E. J. Kramer, G. D. Stucky,
and B. F. Chmelka, Chemistry of Materials, 2002, 14, 3284.
22 F. Jiao, A. Harrison, J. C. Jumas, A. V. Chadwick, W. Kockelmann, and P. G.
Bruce, Journal of the American Chemical Society, 2006, 128, 5468. 23 H. J. Shin, R. Ryoo, Z. Liu, and O. Terasaki,
Journal of the American
Chemical Society, 2001, 123, 1246.
24 S. N. Che, K. Lund, T. Tatsumi, S. Iijima, S. H. Joo, R. Ryoo, and O. Terasaki,
25 H. J. Shin, R. Ryoo, M. Kruk, and M. Jaroniec,
Chemical Communications,
2001, 349.
26 M. Kruk, M. Jaroniec, R. Ryoo, and S. H. Joo,
Journal of Physical Chemistry
B, 2000, 104, 7960.
27 K. K. Zhu, B. Yue, W. Z. Zhou, and H. Y. He,
Chemical Communications,
2003, 98.
28 F. Jiao, B. Yue, K. K. Zhu, D. Y. Zhao, and H. Y. He,
Chemistry Letters, 2003,
32, 770.
29 B. Z. Tian, X. Y. Liu, H. F. Yang, S. H. Xie, C. Z. Yu, B. Tu, and D. Y. Zhao,
Advanced Materials, 2003, 15, 1370.
30 T. Hyeon, S. S. Lee, J. Park, Y. Chung, and H. Bin Na,
Journal of the
American Chemical Society, 2001, 123, 12798. 31 A. N. Shipway, E. Katz, and I. Willner,
Chemphyschem, 2000, 1, 18. 32 C. B. Murray, C. R. Kagan, and M. G. Bawendi,
Annual Review of Materials
Science, 2000, 30, 545.
33 M. Lewin, N. Carlesso, C. H. Tung, X. W. Tang, D. Cory, D. T. Scadden, and
R. Weissleder, Nature Biotechnology, 2000, 18, 410. 34 R. H. Kodama,
Journal of Magnetism and Magnetic Materials, 1999, 200,
359.
35 D. Larcher, C. Masquelier, D. Bonnin, Y. Chabre, V. Masson, J. B. Leriche,
and J. M. Tarascon, Journal of the Electrochemical Society, 2003, 150, A133. 36 W. S. Seo, H. H. Jo, K. Lee, B. Kim, S. J. Oh, and J. T. Park,
Angewandte
Chemie-International Edition, 2004, 43, 1115.
37 Y. N. Xia, P. D. Yang, Y. G. Sun, Y. Y. Wu, B. Mayers, B. Gates, Y. D. Yin, F.
Kim, and Y. Q. Yan, Advanced Materials, 2003, 15, 353.
38 X. W. Teng and H. Yang,
Journal of Materials Chemistry, 2004, 14, 774. 39 H. Zeng, J. Li, J. P. Liu, Z. L. Wang, and S. H. Sun,
Nature, 2002, 420, 395. 40 M. Yin, C. K. Wu, Y. B. Lou, C. Burda, J. T. Koberstein, Y. M. Zhu, and S.
O'Brien, Journal of the American Chemical Society, 2005, 127, 9506. 41 B. Scrosati,
42 P. G. Bruce,
Chemical Communications, 1997, 1817. 43 J. M. Tarascon and M. Armand,
Nature, 2001, 414, 359. 44 T. Nagaura and K. Tozawa,
Prof. Batteries Solar Cells, 1990, 9, 209. 45 K. Mizushima, P. C. Jones, P. J. Wiseman, and J. B. Goodenough,
Materials
Research Bulletin, 1980, 15, 783. 46 A. R. Armstrong and P. G. Bruce,
Nature, 1996, 381, 499. 47 T. Ohzuku and Y. Makimura,
Chemistry Letters, 2001, 744. 48 T. Ohzuku and Y. Makimura,
Chemistry Letters, 2001, 642. 49 M. M. Thackeray, W. I. F. David, and J. B. Goodenough,
Materials Research
Bulletin, 1982, 17, 785.
50 M. M. Thackeray, W. I. F. David, P. G. Bruce, and J. B. Goodenough,
Materials Research Bulletin, 1983, 18, 461.
51 M. M. Thackeray, P. J. Johnson, L. A. Depicciotto, P. G. Bruce, and J. B.
Goodenough, Materials Research Bulletin, 1984, 19, 179. 52 A. J. Paterson, A. R. Armstrong, and P. G. Bruce,
Journal of the
Electrochemical Society, 2004, 151, A1552. 53 M. M. Thackeray,
Progress in Solid State Chemistry, 1997, 25, 1. 54 D. Guerard and A. Herold,
Carbon, 1975, 13, 337. 55 W. Weppner and R. A. Huggins,
Journal of the Electrochemical Society, 1978,
125, 7.
56 C. J. Wen and R. A. Huggins,
Journal of the Electrochemical Society, 1981,
128, 1181.
57 D. Larcher, L. Y. Beaulieu, O. Mao, A. E. George, and J. R. Dahn,
Journal of
the Electrochemical Society, 2000, 147, 1703.
58 P. Poizot, S. Laruelle, S. Grugeon, L. Dupont, and J. M. Tarascon,
Nature,
2000, 407, 496.
59 S. Grugeon, S. Laruelle, R. Herrera-Urbina, L. Dupont, P. Poizot, and J. M.
Tarascon, Journal of the Electrochemical Society, 2001, 148, A285. 60 D. C. S. Souza, V. Pralong, A. J. Jacobson, and L. F. Nazar,
Science, 2002, 296,
61 A. Debart, L. Dupont, R. Patrice, and J. M. Tarascon,
Solid State Sciences,
2006, 8, 640.
62 Z. W. Fu, Y. Wang, X. L. Yue, S. L. Zhao, and Q. Z. Qin,
Journal of Physical
Chapter 2. Routine experiments and characterization techniques
2-1 Routine experimental details
2-1-1 synthesis of mesoporous silica SBA-15
The synthesis of mesoporous silica SBA-15 has been reported previously by
Stucky and co-workers.1 A detailed synthesis procedure is described as following: 2 g
of Poly(ethylene glycol)-block-poly(propylene glycol)-block-poly(ethylene glycol)
P123 (average Mn ~5800, Aldrich) was mixed with 75 mL of water and 4 mL of
concentrated HCl (37 wt %, Fisher) in a beaker, followed by stirring at 40 °C until all
polymer was dissolved. 4.4 g of tetraethyl orthosilicate (TEOS, 98%, Aldrich) was
added into this solution and stirred at 40 °C for 24 h. Then, the mixture was sealed in
autoclaves and heated at 100 °C for another 24 h. After the hydrothermal treatment,
the resulting sample was filtered, washed with water for several times, dried at 60 °C.
The polymer template was removed by calcining at 500 °C for 3 h under air.
2-1-2 Synthesis of mesoporous silica KIT-6
The preparation of mesoporous silica KIT-6 was reported by Ryoo and
co-workers.2 A typical synthesis procedure is as following: 2 g of Poly(ethylene
glycol)-block-poly(propylene glycol)-block-poly(ethylene glycol) P123 (average Mn
~5800, Aldrich) was mixed with 72.5 mL of water and 3.35 mL of concentrated HCl
(37 wt %, Fisher) in a beaker. The mixture was stirred at 35 °C until a homogeneous
solution was obtained. Then, 2 g of n-butanol (99.4+%, Aldrich) was added and this
mixture was stirred for 1 h before 4.3 g of tetraethyl orthosilicate (TEOS, 98%,
Aldrich) was added. After stirring at 35 °C for 24 h, the mixture was transferred into
autoclaves which were sealed and maintained at 100 °C for another 24 h. The
resulting mixture was filtered and dried at 60 °C, followed by mixing with 200-300
mL of ethanol and 10-20 mL of concentrated HCl (37 wt %, Fisher) in an 800 mL
beaker. After stirring at room temperature for 1-2 h, it was filtered and washed with
water and ethanol for several times. The final sample was dried at 60 °C and calcined
2-2 Characterization techniques
2-2-1 Powder X-ray diffraction technique
Since the experimental observation of X-ray diffraction in 1912, W. L. Bragg
noticed the similarity of diffraction to ordinary reflection and deduced an
uncomplicated equation treating diffraction as “reflection” from planes in the crystal
lattice (see Scheme 1). A simple function, 2dsinθ=nλ (where d is the distance between
adjacent planes of atoms, θ is the angle of incident X-ray beam, n is the order of the
diffracted beam, λ is the wavelength of the X-ray beam), was established, which is
called Bragg’s law. Following this law, if the wavelength of the incident X-ray beam
is known, a set of distances between the planes of atoms can be obtained by
measuring reflection intensities at different angles. Because the X-ray diffraction
pattern is normally unique, the identification of the target material can be achieved.
Scheme 1. X-ray diffraction. P1 and P2 indicate lattice plane 1 and plane 2. O and
C are the contact points for injection lights and lattice planes.
Powder X-ray diffraction (PXRD) is widely used in many fields, such as material
science, geology, chemistry, physics and environmental science. The sample studied
in PXRD is usually in a powder form, consisting of many crystal domains with
different orientations, which is different from single crystal diffraction. After a PXRD
pattern is obtained, the phase is normally identified by searching the crystallography
database and comparing the diffraction peaks (both the d spacings and intensities).
In the studies presented in this thesis, wide-angle PXRD data were collected in a
Stoe STADI/P powder diffractometer operating in transmission mode and with a low
angle position sensitive detector. Incident radiation was generated using a FeKα1
source (λ = 1.936 Å). While low-angle PXRD measurements were carried out using a
mode and a scintillation detector. For the samples which are not air-sensitive, the
PXRD measurements are carried out at room temperature under air; while for those
air-sensitive samples, the samples were sealed in two polymer films by using vacuum
grease and all assembling work was carried out under argon in an Ar filled glove box.
2-2-2 Transmission electron microscopy technique
The Transmission Electron Microscopy (TEM) is an electron-optical microscope
that uses electromagnetic lenses to focus and direct an electron beam. Data are
collected from the beam after it passes through the sample. The reason for using an
electron beam instead of a light beam is that electrons have a much shorter
wavelength than photons. Resolution and magnification of a microscope are related to
the wavelength and the energy of the radiation. The shorter the wavelength, the better
the resolution.
TEM is widely used to characterize a lot of materials not only from the
morphological and crystallographic points of view but also for the elemental
composition. Using TEM a large variety of materials as ceramics, metals, alloys,
semiconductors, glasses and polymers can be observed. The main requirements for
the samples are: due to the high vacuum ambient of work they must not outgas and
they have to be appropriately thinned to be observed.
An electron diffraction unit is usually attached to TEM. When the electron beam
is focused onto a small part of the sample (normal several to hundreds of nanometers
by adjusting the spot size), an electron diffraction pattern can be obtained which is
normally called selected-area electron diffraction (SAED). Based on SAED
measurements, it is possible to carry out electron crystallography studies, which
means solving the crystal structure of a very small single crystal using the diffracted
electron beams in an electron microscope. First a series of SAED patterns from
different orientations are taken on a selected particle in TEM. By combining all
reflections, an electron density map may be obtained and a three-dimensional model
can be set up. Further refinement is required to determine the final structure of the
which is too small for normal PXRD studies. This includes crystals which have a
particularly short crystal dimension, such as nanocrystals, nanowire crystals, and
porous materials with nanoscale crystalline walls. Further, as the crystallography is
carried out in TEM, in principle, crystallography may be performed on different parts
of a sample which have different composition on a sub-micron scale.
TEM studies discussed in the following chapters were carried out by using a
JEOL JEM-2011 (Figure 1). This TEM uses a LaB6 filement as the electron source
and the accelerating voltage is 200 keV. TEM and HRTEM images were both
recorded by a Gatan CCD camera in a digital format. The SAED patterns were
recorded on traditional films followed by developing in a dark room and transforming
into a digital form by scanning. The camera length for recording SAED patterns was
set to 80 cm and the exposing time was varied depending on the brightness of the
diffraction spots. An energy dispersive X-ray analysis (EDXA) system was attached
to this TEM, which was used to identifying the elemental composition of the sample.
Figure 1. JEOL JEM 2011.
2-2-3 N2 adsorption-desorption technique
When nitrogen is brought into contact with a solid, part of it is taken up by the
solid, which is called nitrogen adsorption. This phenomenon has been studied
the insight needed for most applications. Two methods were widely used to calculate
the experimental data and estimate the surface area: one is Langmuir and the other is
Brunauer, Emmett and Teller (BET), which is used to calculate all the specific surface
area in all nitrogen adsorption measurements. BET method was first introduced in
1938 and is widely used to calculate the surface area of solids by physical gas
adsorption. This method extended the Langmuir theory from monolayer molecular
adsorption to multilayer adsorption. The BET equation can be expressed by the
following function:
In this function, P is the equilibrium pressure of nitrogen, P0 is the saturation pressure
of nitrogen at the adsorption temperature, ν is the quantity of adsorbed nitrogen in the
solid, c is the BET constant and νm is the quantity of adsorbed nitrogen via monolayer
mechanism. Because the linear relationship in this function only exists in the relative
pressure (P/P0) range from 0.05 to 0.35, the data for calculation of the surface area by
BET method were chosen in this pressure range.
Experimental N2 adsorption isotherms usually fall into six typical categories,
Figure 2. Classification of gas adsorption isotherms.
Type I isotherms are usually considered to be indicative of adsorption in
micropores or monolayer adsorption due to strong adsorbent-adsorbate interactions.
Adsorption on many macroporous solids proceeds via multilayer formation in such a
manner that the amount adsorbed increases gradually as the relative pressure increases,
although the multilayer buildup close to the saturation vapour pressure may be quite
rapid. This unrestricted multilayer formation process gives rise to type II and III
isotherms. Adsorption on mesoporous solids proceeding via multilayer adsorption
followed by capillary condensation gives type IV or V isotherms.
Nitrogen adsorption-desorption measurements were carried out by using a Hiden
IGA porosimeter in the current studies. The typical sample weight used in the
measurement was 10-20 mg. The outgas conditions were normally set to 120 minutes
at 120 °C under vacuum and all adsorption-desorption measurements were carried out
under liquid nitrogen temperature.
2-2-4 Superconducting quantum interference device (SQUID) technique
e.g. magnetometers, which are used to measure very small magnetic fields with
extremely high sensitivity. Based on the discovery of the Josephson Effect in 1962,
the first dc SQUID was introduced in 1964 by people from Ford Research Labs.
Because of the extremely high sensitivity to the weak magnetic field, SQUID have
been used to study many topics, such as magnetic properties of materials, biological
phenomena and in the geographical field.
The device used to measure the magnetic properties in the following studies is a
Quantum Design SQUID magnetometer, which is located in University of Edinburgh.
The sample was first weighed by using a balance and filled in a polymer container.
Then, it was placed on a sample holder, which was connected to the SQUID system.
Data were usually collected from 1.8 K to 300 K, in fields of 0.01 T after cooling first
in zero field, and then in 0.01 T field.
2-2-5 X-ray absorption spectroscopy (XAS) techniques
In the interaction of X-rays with matter, there are three main processes: elastic
scattering, inelastic scattering, and absorption due to ionisation. The absorption can be
characterised by the following equation: I1 = I0exp(-μx) where I1 is the exiting
intensity, I0 is incident intensity, x is the distance travelled through the material and μ
is the x-ray absorption coefficient of the material. The coefficient μ is energy
dependent which decreases smoothly in general, but it has certain discontinuities in its
values. These values are known as absorption edges. However, in condensed material
when the incident X-ray is energetic enough to eject one of the core electrons, the
ejected photo-electron (wave) will be scattered by neighbouring atoms. It is the
interference between the outgoing electron and the back-scattered ones which leads to
oscillations visible in the absorption spectrum above the edge, which can extend to up
to 1000 eV past the edge. These oscillations are called the Extended X-ray absorption
fine structure (EXAFS).
Based on these phenomena, X-ray absorption spectroscopy is developed to detect
number and species of the atoms immediately surrounding the selected element.
These techniques provide a practical, and relatively simple, way to determine the
chemical state and local atomic structure for a selected atomic species. XAS
techniques have been widely used in many fields, including biology, environmental
science, catalysts research, and material science. Because this technique is an atomic
probe, nearly all the elements can be measured. Moreover, XAS technique can also be
used in analyzing amorphous, poorly crystalline, and highly disordered materials,
which are difficult to be measured by traditional X-ray diffraction technique.
XAS is typically divided into X-ray absorption near-edge spectroscopy (XANES)
and extended X-ray absorption fine-structure spectroscopy (EXAFS). A typical XAS
pattern is shown in Figure 3. Though these two regions of the spectra have the same
physical origin, this distinction is convenient for the interpretation. XANES is
strongly sensitive to formal oxidation state and coordination chemistry (e.g.,
octahedral, tetrahedral coordination) of the absorbing atom, while the EXAFS is used
to determine the distances, coordination number, and species of the neighbours of the
absorbing atom.
Figure 3. A typical XAS pattern.
Many experimental techniques and sample conditions are available for XAS
measurements. For example, it is possible to carry out fast in situ XANES and
EXAFS measurements during lithium intercalation/deintercalation processes in a
changing accompanying with the lithium intercalation. XAS experiment usually
requires only a small amount of sample (~ 10 mg) which is pressed into a pellet and
put on a sample holder for the measurements. For air-sensitive samples, an aluminium
foil bag can be used to seal the material in an Ar filled glove box.
The XANES and EXAFS data were collected at the stations 7.1 and 9.3 in CLRC
Daresbury Synchrotron Radiation Source. This source has electron energy of 2 GeV
and the average current for these measurements was ~150 mA. The data were
collected in transmission mode and the beam current was measured using gas filled
ion chamber detectors. The scan range was from ~100 eV below the absorption edge
to several hundred eV beyond the edge. The raw data were treated in a conventional
manner, using the excalib, exback and dl_excurv programs provided by Daresbury
Laboratory. Phase shifts were derived from ab initio calculations within dl_excurv
program. The fitting of EXAFS spectrum with a known structural model from the
standard database was also carried out by using this program.
2-2-6 Mössbauer spectroscopy
Mössbauer spectroscopy is developed after the discovery of the Mössbauer effect,
a γ-ray resonance phenomenon in solids, by Rudolf Mössbauer in 1957. γ-ray,
normally produced by nuclear transition from a high energy state to a low energy state,
has an energy equal to the energy of this nuclear transition if the energy loss due to
recoil to the emitting atom is relatively small. This γ-ray can be absorbed by
neighbouring same type atoms. Because the recoil energy is normally negligible in
solids, this emission and absorption (resonance) can occur in the whole solid rather
than in a single atom. Also because γ-ray has a very short linewidth, it is sensitive to
small changes in the energies of nuclear transitions. This is the basis for Mössbauer
spectroscopy to monitor these interactions.
Mössbauer spectroscopy is widely used to study the structure and properties of
materials in many fields, such as nanomaterials, electrochemical reactions in
lithium-ion batteries, and magnetic devices. The Mössbauer spectroscope used in
using a 57Co(Rh) source in University of Montpellier II, France. Experimental data
were collected in a temperature range from 4 K to 300 K. The hyperfine parameters δ
(isomer shift) and Δ (quadrupole splitting) were determined by fitting Lorentzian lines
to the experimental data by the ISO software.
2-2-7 Batteries test
Coin type and Swagelok type cells were used in the electrochemical tests carried
out in this thesis. All cell parts are dried before using. A typical assembling of a coin
type cell is described as following: first dried sample is mixed with Kynar 2801 (a
co-polymer based on polyvinylidene fluoride), and Super S/Super P carbon in a
selected weight ratio, e.g. 85:5:10. THF is usually used to disperse this mixture. It is
then cast onto an Al or Cu foil from THF using a Doctor-Blade technique. After
solvent evaporation at 45 °C, the foil is cut into small discs and dried in a vacuum
oven at 80 °C for 8-12 h. After drying under vacuum, the sample discs are transported
into an Ar filled MBraun glovebox for the assembling. An active material coated disc
is first placed on a coin cell bottom part with coated side facing upward, and then two
pieces of separator are placed on the sample disc followed by adding 8-10 droplets of
electrolyte LP30 (Merck; 1M LiPF6 in 1:1 v/v ethylene carbonate:dimethyl carbonate).
A small piece of lithium metal, a steel disc, a spring and a coin cell top part with a
plastic sealing ring are placed on the top following this order. Finally the cell is sealed
by using a coin cell pressure system.
For the assembling of Swagelok type cell, the active material is mixed with Super
S carbon with a selected weight ratio, e.g. 80:20. Followed by grinding gently, the
mixture is kept in a vacuum oven at 80 °C for drying overnight. After that, it is put
into an Ar filled glovebox for assembling. A plastic film is placed inside the cell body
first and one steel pillar with PTFE liner is sealed one end of the cell body. The active
material powder is added into the body carefully and two separators are used followed
by adding 8-10 droplets of liquid electrolyte LP30 (Merck). A small piece of lithium
metal, a steel disc, and a spring are placed on the top, and this end of cell is sealed by
MACCOR and Biologic MacPile II system are used in collecting the
electrochemistry data. All tests were carried out at 30 °C in an oven. For the
characterization of electrode materials after cycling by other techniques, such as
PXRD and TEM analysis, the powder of active material was recovered from the cell
followed by washing with dimethyl carbonate (DMC) several times and drying under
vacuum without exposure to air.
2-3 references
1 D. Y. Zhao, J. L. Feng, Q. S. Huo, N. Melosh, G. H. Fredrickson, B. F.
Chmelka, and G. D. Stucky, Science, 1998, 279, 548. 2 F. Kleitz, S. H. Choi, and R. Ryoo,
Chemical Communications, 2003, 2136. 3 C. G. V. Burgess, D. H. Everett, and S. Nuttall,
Pure and Applied Chemistry,
Chapter 3. Synthesis, characterization, and magnetic properties of mesoporous
iron oxides with amorphous walls
As discussed in the introduction Chapter 1, the synthesis of mesoporous transition metal oxides by soft templating has attracted much less attention than main group oxides, such as SiO2.1-3 Very few examples of soft templated mesoporous transition metal oxides are prepared, such as TiO2 and Nb2O5.2, 3 Mesoporous iron oxides are of particular interest. Reversible Li intercalation can occur for nanoparticulate Fe2O3, while it is much more difficult to carry out such intercalation with Fe2O3 of normal particle size.4 Since the walls of a mesoporous iron oxide are of nano-dimensions, similar behaviour may be possible. The limited dimensions of the walls will also alter the magnetic behaviour from that of bulk Fe2O3. Here, the first synthesis of ordered mesoporous Fe2O3 with controllable pore structures was demonstrated. Ordered two-dimensional (2D) hexagonal mesoporous iron oxide (2DMIO) with P6mm symmetry and three-dimensional (3D) cubic mesoporous iron oxide (3DMIO) with Fm3m symmetry have been prepared by using decylamine as the template and FeIII ethoxide as the precursor. Different aging conditions were used for 2DMIO and 3DMIO. In both cases, the walls exhibit a microporous structure.5
3-1 Synthesis
3-2 Results and discussion
3-2-1 2D mesoporous Fe2O3
The successful template removal from 2D mesoporous iron oxide (2DMIO) was confirmed by CHN analysis. As-prepared 2DMIO contained 44.0% C, 9.69% H, and 4.82% N by weight, while the 2DMIO after ethanol extraction contained 6.48% C, 2.17% H, and 0.28% N. Based on the N analysis, about 94% of the template had been removed. Slightly high C and H contents were observed after template removal and this may correspond to a small amount of ethanol remaining in the pores.
Figure 1. TEM images for 2DMIO: (a, b) recorded along [001] direction and (c, d)
recorded along [110] direction. TEM images for 2DMIO after template removal
of (a) and (c) are shown in (a, inset) and (c, inset), respectively.
A transmission electron microscope (TEM) image of ordered 2DMIO was recorded along the [001] direction (Figure 1a and b) and the corresponding FFT pattern (Figure 1a, inset) confirmed a hexagonal structure over a large area. Examination of a wide range of particles demonstrated that they all had similar structures. Combining these results with the TEM result recorded along the [110] direction (Figure 1c and d) and their FFT pattern (Figure 1c, inset), it is clear that our 2DMIO has a large scale well-ordered 2D hexagonal array of mesopores, similar to those typically observed in 2D hexagonal mesoporous silica materials, such as MCM-41 and SBA-15.6, 7 After template removal, the highly ordered hexagonal mesoporous structure is maintained, based on TEM results (Figure 1e and f).
Figure 2. HRTEM images for (a) as-prepared and (b) after template removal
2DMIO.
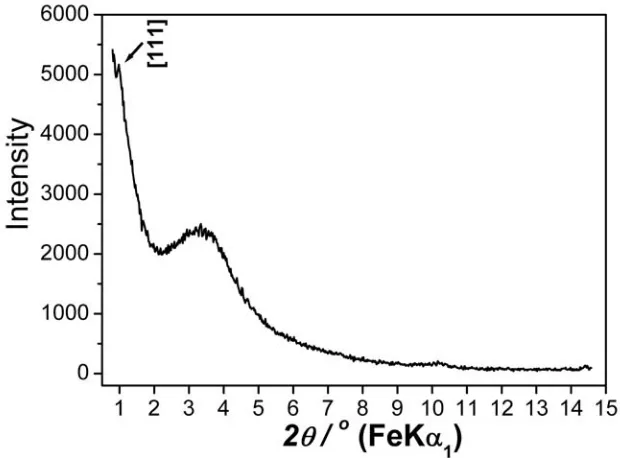
From the high-resolution transmission electron microscopy (HRTEM) image of as-prepared 2DMIO recorded along the [001] direction (Figure 2a), an average pore size of 70 Å and wall thickness of 40 Å, with a cell parameter for the mesostructurea0 of 110 Å were estimated. The low-angle powder X-ray diffraction (PXRD) pattern (Figure 3) of as-prepared 2DMIO exhibits a diffraction peak at 2θ = 1.14°, which translates to a d-spacing of 97.6 Å ( , 1.936
1 λ = α
and 2.29°, corresponding to d-spacings of 56.4 Å and 48.4 Å, for the [110] and [200] reflections, respectively. These peaks are not evident. This appears to be due, at least in part, to the existence of a broad peak in the range of 2θ from 2.2° to 4°, corresponding to d-spacings between 25 and 45 Å. Such a broad peak is consistent with disordered microporous regions within the walls as observed by HRTEM (Figure 2) and discussed later.
Figure 3. Low-angle PXRD pattern for as-prepared 2DMIO.
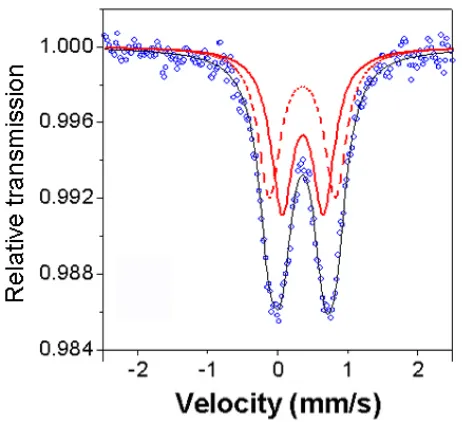
details concerning the Mössbauer studies will be discussed along with magnetic measurements on mesoporous iron oxides with amorphous/nanocrystalline/highly crystalline walls in Chapter 4-1.
Figure 4. Mössbauer data for 2DMIO.
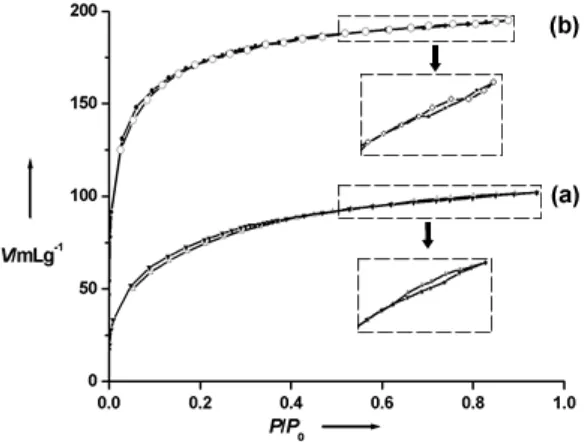
mesoporosity, we propose that the surfaces of the mesoporous walls may themselves be highly microporous resulting in even greater domination of the sorption isotherms by microporous behaviour (type I), Figure 5a. The Brunauer-Emmett-Teller (BET) surface area of 2DMIO is 340 m2g-1.
Figure 5. Nitrogen adsorption-desorption isotherms: (a) 2DMIO and (b) 3DMIO
after ethanol extraction. The inset shows an enlarge region of the curves between
relative pressures of 0.6 and 0.8.
3-2-2 3D mesoporous Fe2O3
This approach can also be use to prepare three-dimensional mesoporous iron oxide by adjusting the aging temperature. When the FeIII ethoxide-decylamine mixture is further aged at 150 °C, ordered three-dimensional (3D) cubic mesoporous iron oxide (3DMIO) with Fm3m symmetry is obtained.
TEM images recorded along different directions are shown in Figure 6. These images represent the highly ordered mesoporous structure of 3DMIO by examining many particles in different regions. Combining all the images, a cubic Fm3m symmetry of 3DMIO could be proposed.
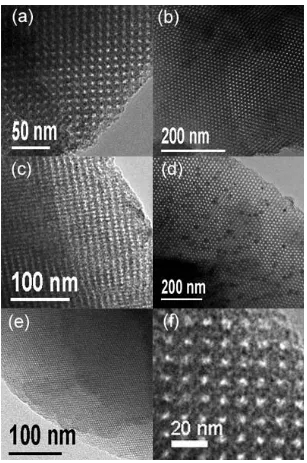
Figure 6. (a-e) TEM images for 3DMIO recorded along different directions; (f)
HRTEM image for 3DMIO.
[image:50.595.89.396.167.630.2]d-spacing of 104.6 Å. The unit cell parameter a0calculated from the PXRD pattern is 182 Å, which is in reasonable agreement with a0 = 192 Å observed from the TEM analysis. Microporosity similar to that observed in 2DMIO is seen in the 3DMIO by HRTEM (Figure 6f) and in the N2 adsorption-desorption analysis (Figure 5b). The BET surface area calculated from the desorption isotherm is approximately 610 m2g-1, which is about twice that for 2DMIO, due perhaps to the higher accessible pore surface in the three dimensional structure.
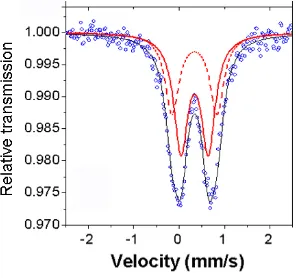
![Figure 1. TEM images for mesoporous αvery low magnification and along (b) [111], (c) [110], and (d) [311] directions; HRTEM image of (b) is shown in (e); (f) SAED patterns for mesoporous -Fe2O3 with ordered walls recorded (a) at α-Fe2O3 with ordered walls](https://thumb-us.123doks.com/thumbv2/123dok_us/8676077.377599/56.595.82.406.101.592/figure-mesoporous-magnification-directions-patterns-mesoporous-recorded-ordered.webp)
