Munich Personal RePEc Archive
An Analysis of Returns and Volatility
Spillovers and their Determinants in
Emerging Asian and Middle Eastern
Countries
Faruk, Balli and Syed Abul, Basher and Hassan, Ghassan
and Hassan, Hajhoj
23 April 2015
Online at
https://mpra.ub.uni-muenchen.de/63847/
An Analysis of Returns and Volatility Spillovers and their Determinants in
Emerging Asian and Middle Eastern Countries1
Faruk BALLI2,3
Syed Abul BASHER4,5
Hassan Belkacem GHASSAN6
Hassan Rafdan HAJHOJ7
Abstract
This study investigates the return spillovers and volatility spillovers from developed markets (e.g., Europe,
Japan and the US) into the financial markets of selected emerging countries in Asia and the Middle East
and North Africa (MENA) region. Based on constant and trend spillover models, we find evidence of
significant spillover effects from developed markets to emerging markets. The results from variance
ratios indicate the dominance of US shocks across all emerging markets, though the effect varies widely
among countries. New to these literature, we conduct an empirical analysis quantifying the underlying
determinants affecting the extent of shock spillovers. The results show that bilateral factors such as
trade volume, portfolio investment and distance are significant in explaining the spillover effects.
JEL Classification: F15, F36, G12.
Keywords: Return spillovers; Volatility spillovers; Market integration.
1 We thank two anonymous referees for their very helpful comments and suggestions and Megan Foster for help with proofreading. We gratefully acknowledge the financial support of the King Faisal University with a grant under the project number 140067.
2 School of Economics and Finance, Massey University, QB 2.47, Albany, Auckland, New Zealand. Tel.: 64 9 4140800 ext. 43445. Email: [email protected]
3 Department of International Trade and Marketing, Gediz University, Izmir, Turkey.
4 Department of Economics, East West University, Plot No-A/2, Aftabnagar Main Road, Dhaka 1219, Bangladesh. Email: [email protected]
5 Fikra Research & Policy, PO Box 2664, Doha, Qatar.
1
1. Introduction
The global economy today is characterized by the expanding internationalization of national capital
markets. Since the early 1980s, a combination of market-oriented policies such as deregulation of
interest and exchange rates as well as reductions in the barriers to foreign investments (Bekaert and
Harvey, 1997; 2000) have contributed to a spectacular integration of capital markets across the
developed countries and, lately, between the financial markets of developed and emerging countries. The
process of increased financial integration has been accompanied by a rising trend of international and
regional trade agreements among countries. Although the process and the progress of financial and
trade integration have not been symmetric across countries, with some countries or regions showing
more dynamism than others, the global financial crisis (GFC) of 2008–09 established the point that countries are more integrated today (both in terms of trade and financial integration) than they were in
the 1980s and the 1990s.
Although financial globalization and trade integration have enabled emerging countries to attain
risk-sharing through better allocations of capital and thereby higher economic development, they also
produced unwanted side-effects, including increased financial fragility and unstable long-term growth
(Bekaert et al., 2005; Levine and Zervos, 1998; Stiglitz, 2002). As emerging markets develop further and
exhibit higher co-movement with the mature markets, they automatically become more responsive to
the volatility of stock markets elsewhere in the world. Adetailed assessment of the level and the nature
of financial integration between developed and emerging markets is thus necessary. Such analysis can
shed light not only on the sources of shock spillover (an indicator of market integration) across markets
but also on the underlying determinants that characterize this integration.
The literature on equity market integration has evolved over time. Prior literature documents a
slow degree of co-movement across markets in the period before the 1990s (Hilliard, 1979). Recent
literature, however, has documented a notable increase in international co-movement of equity returns
since the mid-1990s. Various explanations have been offered for this increased market integration,
including the increase in international market co-movement linked to growing global industry factors
(Baca et al., 2000; Cavaglia et al., 2000), high market correlation after the stock market bubble in the late
1990s (Brooks and Del Negro, 2004), a general increase in market integration in the 1990s and the
2000s (Ayuso and Blanco, 2001) and an increase in international bilateral trade flows (Pretorius, 2002).
The increasing interconnectedness and flows of trade, investment and finance between the
emerging and developed countries has led to a number of empirical studies investigating this
phenomenon. Over the past few decades, various studies have provided a general understanding on the
integration of emerging markets. Bekaert and Harvey (1997, 2000), Bekaert et al. (2005) and Carrieri et
al. (2007) studied the implications of increasing integration with global markets for local returns,
volatility and cross-country correlations, covering a diverse set of emerging markets in Asia, Eastern
and Central Europe, Latin America and the Mediterranean area. A number of studies focused upon
specific regions, including Neaime (2006, 2012) and Floros (2008) on the integration of stock markets in
2
(2005, 2006), Engle et al. (2012) and Yilmaz (2010) on the dynamics of stock market integration in
emerging Asia.
However, these studies remain silent on the topic of return and volatility spillovers – let alone their determinants – between emerging and developed countries, which is the main focus of this analysis. In the context of emerging countries, Chen and Zhang (1997) found that cross-country stock
return correlations are related to trade. Although own-country volatility is important in explaining
cross-sectional returns, (bilateral) trade appears to be a major determinant in explaining (between 5%
and 40%) cross-country stock return correlations. Bracker et al. (1999) used a two-step procedure to
investigate, first, how the degree of co-movement for a given pair of markets varies over time and,
second, why this interdependence varies over time. They found that the degree of interdependence is
positively correlated with market volatility and trend but negatively correlated with exchange rate
volatility, real interest rate differentials, the return on the world index and the term structure
differentials.
A clear message emerging from the literature is that these stock markets are broadly
interdependent and driven by certain economic factors, where the emerging stock markets also exhibit
similar characteristics. However, what remains unexplored is whether the factors that drive the
co-movement among developed markets are also relevant for emerging markets and to what degree. An
open question that remains to be analysed is whether integration among emerging markets is driven by
similar factors or whether it is driven by completely different factors that are specific to the emerging
markets’ nature, given the still underdeveloped financial markets of the latter in comparison with the developed world markets (Bekaert and Harvey, 1997). Factors that have been shown to influence the
extent of integration among developed stock markets significantly include bilateral trade, exchange rate
volatility, real interest rate differentials, physical distance, regional effects, market volatility and
capitalization differentials (see, among others, Pretorius (2002), Lucey and Zhang (2010) and Graham et
al. (2012)).
The existing studies have generally pointed to increasing links among emerging stock markets as
well as links between emerging and mature markets. However, these results are difficult to reconcile
because of the differences in econometric methodologies as well as the data frequencies and periods
considered. In this paper, we quantify the extent of return and volatility spillovers from major developed
countries/regions to selected Asian and Middle Eastern countries. Furthermore, we investigate the
possible underlying determinants of the shock spillovers using a variety of bilateral and gravity
variables commonly used in the literature. To the best of our knowledge, this analysis has not been
conducted for Asian and Middle Eastern countries.
More specifically, our empirical approach comprises the following steps. First, we use a standard
GARCH (1,1) process to model return and volatility for each market, which provides the extent of the
spillovers of global shocks on the volatilities of the emerging markets. Return and volatility spillovers
are calculated using the methods proposed by Bekaert and Harvey (1997), Ng (2000) and Bekaert et al.
3
trend spillover model. The constant spillover model assumes that the degree of spillover effects remains
constant over time, which offers a general picture of the shock spillover effects. On the other hand, the
trend spillover model allows us to obtain the time-varying aspect of integration between markets.
Furthermore, we make use of variance ratios to determine how the extent of shocks from different
origins are compared vis-à-vis an individual market’s own shocks. Second, new to this literature, we employ a cross-section model to estimate the possible underlying determinants of shock spillovers from
developed to emerging markets. This will allow us to understand the characteristics of the shock
spillovers more analytically. Overall, this paper provides a general picture of how the degree of
co-movement between emerging and developed markets is governed by certain macroeconomic factors and
thus contributes to the ongoing literature and research on equity market integration in emerging
markets.
The rest of the paper is organized as follows. Section 2 describes the data and presents some
descriptive analyses. Section 3 outlines the econometric methodologies concerning the return and
volatility spillover effects. Section 4 reports the empirical results and discusses the findings in detail.
Section 5 concludes the paper.
2. Data and Descriptive Statistics
Our sample consists of 20 emerging markets from Asia and Middle East and North Africa (MENA)
countries over the period 2000–2013. These include Bangladesh, India, Indonesia, South Korea, Malaysia, Pakistan, the Philippines, Singapore, Thailand and Vietnam from Asia and Bahrain, Kuwait,
Oman, Qatar, Saudi Arabia, the United Arab Emirates (UAE), Egypt, Jordan, Morocco and Tunisia. The
MENA countries can be classified into two parts: Gulf Cooperation Council (GCC)8 versus non-GCC
MENA9 countries. The choice of countries is guided purely by the availability of data. The variables
considered in the analysis include (i) bilateral trade volumes between emerging countries and their
developed country counterparts such as US, Europe and Japan; (ii) weekly equity return data (in US
dollars); (iii) the level of equity investments by developed country in emerging markets; (iv) debt
securities issued by the emerging markets and held by the developed countries (US, Europe and Japan);
and (v) geographic distance between the capital cities of the countries in the sample.
Bilateral trade data consisting of exports and imports of goods at quarterly frequency were
collected from the International Monetary Fund’s Direction of Trade Statistics database. Weeklyequity data were extracted from the Morgan Stanley Capital International database. Annual aggregate values
of portfolio (equity and debt) investments were extracted from the International Monetary Fund’s Coordinated Portfolio Investment Survey database and geographic distance data were collected from
Mayer and Zignago (2011). The data period cover significant recent events such as the 2008–09 GFC, which imparted a material impact on the economic and financial landscape of the emerging markets.
4
A visual summary of the equity prices across the 20 emerging markets is shown in Figure 1.
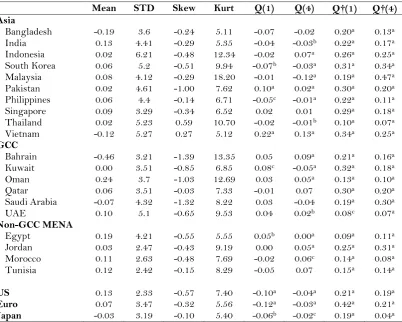
Table 1 presents the descriptive statistics for the weekly equity returns denominated in US dollars. As
Table 1 shows, the mean values of the weekly returns vary between -0.19% (Bangladesh) and 0.24%
(Oman). The standard deviation of the returns ranges from 2.42% (Tunisia) to 6.21% (Indonesia). A
higher degree of equity return volatility is generally associated with countries characterized as having
lower macroeconomic stability. The statistical distributions of the returns indicate that most of the
returns are skewed to the left and they all show excess kurtosis, extremely high kurtosis in some cases.
The last four columns of Table 1 report the Ljung and Box (1978) portmanteau test statistics Q and Q† (for the squared data) for first- and second-moment dependencies in the distribution of the emerging
market equity indices. In many cases, the Q statistic is significant, suggesting that the equity indices are
serially correlated whereas the Q† statistic is significant for almost every market, providing evidence of strong second-moment dependencies in the distribution of the equity returns.
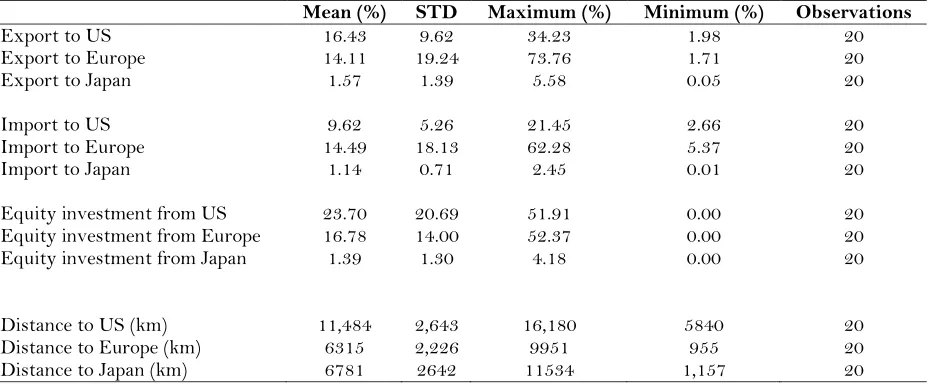
Table 2 presents the summary statistics for the cross-section determinants. For each country, the
measurement of bilateral trade is calculated in a way that normalizes the actual absolute volume in the
original trading currency unit in order to get the relative scalar measurement of trade for the different
countries. This way, we are able to measure trade as the ratio of actual annual trade volume (imports
plus exports) between an emerging country and its trading partners. Equity and debt investment
measures in emerging markets are also normalized using the ratio of actual volume held by a developed
country to the total volume of security investments issued by an emerging market.
The mean values of bilateral exports to developed countries range between 1.57% (imports by
Japan) and 16.43% (exports to the US), whereas the corresponding mean values of imports from
developed countries range from 1.14 (Japan) to 14.49 (Europe). These statistics provide an overview of
the differences in the relative amount of trade from emerging to developed countries. At the country
level, the range is more dispersed with a minimum of about 0.05% (almost no trade) to the maximum of
nearly 80%. For equity investments, the mean value varies in the range of 1.39% (Japan) to 23.70% (US).
Finally, the distance to the developed markets is in the range of 6315 km (Europe) to 11,484 km (US).
3. Methodology
We follow Bekaert and Harvey (1997) and Ng (2000) in building the spillover models for the equity
returns in the emerging markets. The effects of all return and volatility spillovers of aggregate US,
Europe and Japanese equity markets are also taken into consideration to formulate their respective
univariate AR-GARCH models.10 The conditional returns based on the aggregate equity index
of
the selected developed countries are assumed to follow an AR(1) process:
10The GARCH(1,1) model, though widely popular among applied researchers, is not the only choice for studying volatility
dynamics of equity markets. Alternative methods include the vector autoregression (VAR) model and multivariate GARCH, among others. The main advantage of the GARCH(1,1) model is its simplicity. One of the biggest challenges in multivariate GARCH modelling is finding a tradeoff between generality and feasibility, a tradeoff that is often referred to as “the curse of
5
; (1) ; (2) . (3)
The external shocks , and are assumed to be independently and identically distributed. We model the conditional returns of the emerging market return as a linear combination
of its own history and the return spillovers from all US, European and Japanese aggregate indices.
Given that our models are based on the extent of the spillovers from the developed markets to
emerging markets, we have applied a contagion test following Forbes and Rigobon (2002) to show
whether the developed markets and emerging markets (our samples) have co-movements more often
during the GFC period. Applying the contagion and interdependence test, we showed that almost all
markets (except Singapore and South Korea) demonstrated the contagion effect during the GFC.11
Accordingly, to control for the contagion effect, following Hammoudeh et al. (2009), we have added a
dummy variable for the GFC period on the top of the spillovers we detected earlier. Accordingly, the
estimated equation is as follows:
, (4)
where is the intercept; is the sensitivity to an emerging market’s own past performance; and
and are return spillovers from th4e US, European and Japanese equity markets,
respectively. The dummy variable captures the GFC period. The error term is made up from
the emerging market indices’ own shocks and shocks from the chosen economic powerhouses, as follows:
(5)
Since it is possible for both the emerging and developed markets to be driven by common news,
following Ng (2000), we use Cholesky decomposition to separate shocks that are specific to each
developed market from those that are specific to the emerging markets. We orthogonalized innovations
so that each market was driven by its own idiosyncratic shocks, which are given by:
(6) ; (7)
. (8)
These equations imply that the US is the main originator of shocks, which are then transmitted into the
European and Japanese markets. The new shocks for Europe are based on Cholesky decomposition, such
that and
.
12 Under this specification, the aggregate shock
spillovers and the nature of any time variation between return and volatility spillovers. We thank an anonymous reviewer for bringing this point to our attention.
11For the sake of brevity, we have not presented the contagion test results. The results will be available upon request. 12Under these assumptions, it is easy to show that is determined by the ratio of the covariance between the European and
US innovations and the variance of the US, which is as follows:
6
represents a shock that is unrelated to . The specification for Japan is defined in a similar
way. The corresponding volatility spillover effects are introduced by the variables , and
. Hence, we measure the volatility spillover effects of each developed market by the coefficients , and , respectively.
Intuitively, this type of recursive structure for the transmission of shocks from developed to
emerging markets can be justified on the basis that shocks originating in the US first affect financial
markets in Europe and Japan before spilling over into the emerging markets. The recent GFC provides
the best evidence to support this causal chain of shock transmission (i.e., from the subprime meltdown in
the US in 2007 into a sovereign debt crisis in Europe in 2010, followed by weakening economic
prospects in emerging countries). The tapering of the Federal Reserve’s quantitative easing program that sparked a sell-off in emerging market equities (and currencies) in recent times is another case in
point.
To get the volatility spillover effects, we assume that the idiosyncratic shock in Equation (5), , follows a normal distribution with a zero mean and conditional variance and evolves as a GARCH(1,1)
process:
. (9)
Stability conditions require , and to all be positive and + be strictly less than 1. Since the
idiosyncratic shock of Equation (1) follows a distribution similar to Equation (4), we model the
conditional variance of the unexpected return from each emerging market based on information
available at time t − 1 as:
. (10)
Equation (10) states that the conditional variance of the unexpected return of each emerging
market depends on the variance of the current aggregate US, European and Japanese equity markets as
well as its own idiosyncratic shocks. The coefficient estimates ( ) are the corresponding return
volatility spillovers from the US, European or Japan. Accordingly, the sign and significance of the
parameters and determine whether the volatility spillover effects from the developed markets are strong enough to explain the conditional variance of equity returns for the emerging
markets.
3.1 Constant spillover model
We model the spillover parameters of both return spillovers ( , ) from Equation (4) and the volatility spillovers ( , , ) from Equation (5) as being constant throughout the entire sample period. This specification is known as the constant spillover model. However, it is quite possible
that the spillover parameters are governed by a set of underlying external factors that are different from
7
the ones contemplated here or that these parameters vary with time, which would call for a different
representation of the volatility spillover models.
3.2 Trend spillover model
Given the assumption that spillover parameters change over time, we estimate the trend spillover model
(cf. Christiansen, 2007; Ozer Balli et al., 2013; Balli et al., 2013) to determine which of the parameters
have changed over time by incorporating time trends into the original analysis. We measure the
integration of the emerging market returns with the US, European or Japanese indices by letting the
spillover parameters undergo a gradual transition, taking on a different value for every year throughout
the sample period.
The return spillovers are thus as follows:
; (11)
; (12) (13)
A similar formula is applied to volatility spillovers:
; (14)
; (15) . (16)
Here, is the time-varying independent variable that takes 1 for the year 1990 and increases by 1
for each year until 2013, i.e., = 1, 2, …, 24. The trend spillover model in Equation (4) thus becomes:
+
(17)
3.3 Variance Ratios
To measure the magnitude of the shocks from developed markets on the volatility of the unexpected
return of each emerging market’s equity returns, we computed the following variance ratios (for the constant spillover model):
; (18)
; (19)
8
where , , measure the effects of shocks from the US, European, or Japanese aggregate indices, respectively, at time t on the return of emerging markets in country s. The variance
ratios are helpful for explaining how powerful the spillover effects are in influencing the unexpected
return of each market, along with own effects. By comparing the simple averages of the variance ratios,
we assess the relative magnitude of all the external shocks on the volatility of the market.
3.4 Cross-section analysis
After determining the magnitude of shocks using the variance ratios, we turn our attention to their
possible underlying determinants. Our presumption is that the extent of shocks to the markets is linked
to certain bilateral variables as well standard gravity-type variables. To measure the effects of these
factors, the following cross-section estimation for the market’s variance ratio is used:
, (21)
where is the calculated variance ratio indicating the relative magnitude of shocks from a developed
market to the emerging market of Asia or MENA countries. is the magnitude of
international trade (proxied by exports) between country and country . is the measure of
investments given by the amount of equity security issued by market (i) and held by country .
is a dummy variable that equals either 1 if countries i and j share a common language and 0 otherwise.
is the logarithm of the volume of market capitalization to capture the hypothesized size of the
emerging equity market . is another dummy variable that captures any past or current colonial
dependence between the two countries with a value of 1 if there is and 0 if there is no colonial
relationship. Finally, is the time-invariant distance i.e., the distance in kilometers between the
capital cities of countries and , which captures information frictions and remoteness.
The cross-section estimation of Equation (21) is carried out as follows: data from the variance
ratio analysis for each developed country/region (US, Japan and Europe) are merged altogether, so that
all independent variables are present in the cross-section estimation. Since we have 20 emerging
countries in our sample, the total observations equal 20 3 = 60, as we have three developed markets.
4. Empirical Analysis
4.1 Constant Spillover Model
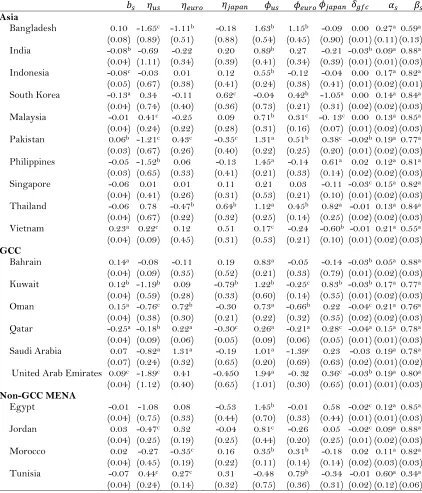
The constant spillover model estimates both return spillover and volatility spillover as being constant
throughout the period. The empirical results are grouped in three regions and are presented in Table 3.
The GARCH(1,1) models are selected using the Akiaike Information Criteria. For Asia, the results
show that there is evidence of both return spillover and volatility spillover from the US in the case of
the Philippines and Singapore, whereas there is almost no clear indication of spillovers from either
Europe or Japan to other Asian markets, except for Bangladesh, which shows a volatility spillover from
9
Masih (1999) and Gutierrez et al. (2009) who also documented a high level of interdependence and co
-movement between the equity markets of the Philippines and Singapore and developed markets,
particularly the US market. We also observed the dominance of the US spillovers on most of the Asian
markets. Figures 2a and Figure 3a present the shares of the US, Europe and Japan in the trade and
investment relationship between the Asian emerging markets and developed markets. Both figures
indicate the dominance of US shares in Asian markets. However, we also observe that in countries with
a relatively underdeveloped capital market (e.g., Bangladesh, Pakistan and the Philippines) the spillovers
are stronger. We will comment more on this phenomenon in the variance ratio analysis below. As for
the GFC dummy, we did not find a clear pattern on the models. The GFC dummy is negative and
significant only in India and Pakistan. The models contain the transmission of the shocks from
developed markets to Asia markets, since shocks contain the information about the GFC, although the
coefficients of the GFC are not significant for this region. This finding partially illustrates the contagion
effect between the Asian and developed markets.
In the GCC area, our results show mixed evidence relating to return spillovers from developed
markets. Return spillovers from the US ( ) are significant in explaining the returns of all GCC markets, whereas return spillovers from Europe ( are significant for Qatar and Oman only. Our results do not indicate significant return spillover effects from Japan ) to GCC markets, except for Qatar and Kuwait, although they have a very weak impact on the latter country. These findings are in
line with those of Hammoudeh and Choi (2004), suggesting the importance of the return spillovers from
global markets, particularly the US market. Regarding volatility spillovers, we find more synchronized
patterns across the GCC markets. Significant volatility spillover from the US markets to all GCC
emerging markets exists and also from Europe, except for Bahrain. Spillover from Japan is significant
for the markets of Kuwait, Qatar and the UAE. The strong spillover from Japan is not surprising given
the high trade in goods between Japan and these three GCC countries (Figure 3b). A similar high
degree of volatility spillover was also found by Neaime (2006), Yu and Hassan (2008) and Khalifa et al.
(2014). The GFC coefficient is negative and highly significant for GCC markets, indicating that even the
GFC by itself affected stock markets performance, even if we controlled for the shocks of the developed
markets.
In the non-GCC MENA countries (i.e., Egypt, Jordan, Morocco and Tunisia), the results
indicate the dominance of the US market, except in Morocco. Both the return and volatility spillovers
from the US markets on the non-GCC MENA markets are highly significant. Similarly, the spillovers
from European markets are also significant, except in Jordan. This finding echoes the bilateral trade
pattern between the developed and non-GCC MENA countries (see Figure 3c). Indeed, in countries
with a higher trade connection with Europe, the corresponding spillover coefficients are highly
significant. Similarly, spillovers from Japan do not appear to be significant, which is consistent with the
low trade share between Japan and the four non-GCC MENA countries.
Overall, the findings of the constant spillover model indicate that the return and volatility
10
the impacts of the shocks originating in the US are clearly more pertinent. This result is consistent with
the relatively higher trade in goods between the US and the emerging countries, compared with Europe
and Japan. For the GCC region, we find that the equity markets in these oil-exporting countries are
affected by shocks from all three developed markets, albeit at varying degrees, in line with the high
degree of openness (both financial and goods) of the GCC countries compared to other emerging
countries in our sample.
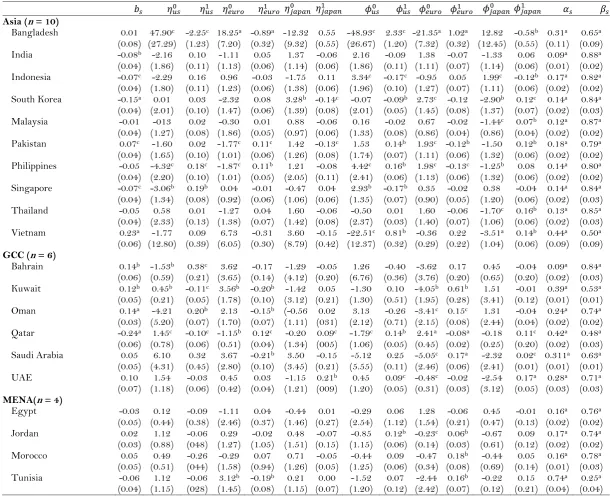
4.2 Trend Spillover Model
The trend spillover model allows the spillover parameters to increase or decrease with a constant value.
Thus the spillover parameters may change gradually during the sample period. Table 4 shows the
results of the trend spillover model and is structured in a way similar to Table 3, except that shocks
from a developed country in terms of return spillovers or volatility spillovers are classified using a pair
of coefficients ( , ) or ( and ), respectively. Generally, and give the initial magnitudes of
the return and volatility spillovers, while and show how the spillovers have changed over time.
As the time trend estimation is similar to the constant spillover estimation, there are several similarities
between the results, as expected. We are interested to know how the spillover parameters have changed
over time by examining the trend coefficients.
For the Asian markets, we observe mixed results across the 10 countries. In countries such as
Bangladesh, Pakistan, the Philippines and Vietnam, the trend spillover effect of the US is positive and statistically significant; whereas the US trend spillover coefficient is significantly negative for
equity markets in India, Indonesia, South Korea and Singapore. This indicates that as emerging equity
markets develop, the significance of the US shocks declines. The trend spillover effect from Europe
( is rather limited across the Asian markets. The impact is positive and significant for Bangladesh and is significantly negative but small in magnitude for Pakistan and the Philippines. As expected, the
trend coefficient of the Japanese spillover ( shows increasing relevance in some parts of the Asian market. For the equity markets of Pakistan, Malaysia, Thailand and Vietnam, the Japanese spillovers
have a positive and significant trend; for the rest of the Asian markets, except for Bangladesh and
Indonesia, the trend spillover effect is significantly negative.
Across the GCC markets, we document changing spillover effects from all developed markets.
The equity markets of Qatar and Saudi Arabia are affected by all three developed markets. The spillover
effect of the US ) and the Japanese markets have a significant and positive impact on Qatar, but the European market has a negative influence from. Similar effects are also observed in the UAE
from the US and Japanese equity markets. This supports the information displayed in Figure 3b, which
shows a strong trade volume between Qatar and Japan. The US and Japanese markets have a positive
11
coefficients . However, for Kuwait and Oman, only the spillover from the Euro region is significant and increased over the period.
In the non-GCC MENA markets, we find the dominance of the European spillovers (Table 4). As
can be seen for Tunisia, Jordan and Morocco, the spillover from Europe has increased throughout the
study period. We find the increased relevance of the US spillover effects only for Jordan.
Overall, across different regions, the spillover effects of developed markets have different effects,
in terms of the significance of the coefficients on the emerging markets. The results show that the
regional spillover effect from European and Japanese markets matter most for non-GCC MENA and
East Asian markets, whereas the spillover effects from the US have a general effect across all markets.
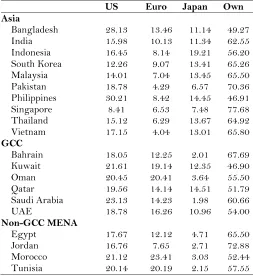
4.3 Variance Ratios
In this section, we present the results of the variance ratios that are used to measure the magnitude of
the spillover effects from developed to emerging equity markets. Table 5 presents the results for three
variance ratios of shocks, , and , in addition to the emerging markets’ own shocks. In general, the intensity of shocks in term of variance ratios from the US, Europe or Japan shows
great variation among different regions and markets. Starting with the Asian markets, we find the
dominance of US shocks in the relatively small markets such as Bangladesh (26.4%), Pakistan (19.73%)
and the Philippines (33.61%). As the emerging markets become deeper in terms of market capitalization
(e.g., Singapore (9.88%), South Korea (13.39%) and India (15.22%)), the influence of the US shocks
becomes weaker. The variance ratios of the European area are lower in the Asian markets. For
Bangladesh only, it is around 16.03%; for the remaining countries, the variance ratios of the European
spillovers are less than 10%. In contrast, the spillover effects from Japan on the volatility of the
emerging equity markets are higher than those from the European markets. Almost all variance ratios
are in double digits (except for India, Pakistan and Singapore). Once again, compared to the US, the
variance ratios of Japanese market spillovers are closer to (or higher than) US spillover effects, except in
the Philippines, Bangladesh and Pakistan.
For the GCC stock markets, the variance ratios again underscore the dominance of the US’s spillover effects. The results show that, on average, around 20% of the shocks to the GCC equity
markets can be attributed to shocks originating in the US. The impact of European spillovers are also
significant at around 15%, reflecting the strong financial and trade integration between Europe and the
GCC. The impact of the Japanese spillover shocks are generally higher for Qatar and the UAE, which
have a strong trading relationship with Japan compared to Bahrain, Oman and Saudi Arabia, where the
impact of the spillover effects is rather limited. The information depicted in Figures 2b and 3b support
this finding. As Figures 2b and 3b show that except for Qatar and the UAE, which have a higher level of
goods trade with Japan, for the remaining GCC countries, the dominance of the US and Europe areas in
terms of investment/trade flows are clearly visible and corroborate the findings of the variance ratios.
For the non-GCC MENA markets, the dominance of the US and European markets is
12
for Morocco and Tunisia, whereas in Jordan, there is some evidence of spillover effects from the US.
Figures 2b and 3b reassert the dominance of the US and Europe for non-GCC MENA markets due to
higher trade/investment flows. On the other hand, the variance ratios of the spillover effects from Japan
on the non-GCC MENA countries are smaller, due to comparatively low bilateral trade/investment
flows.
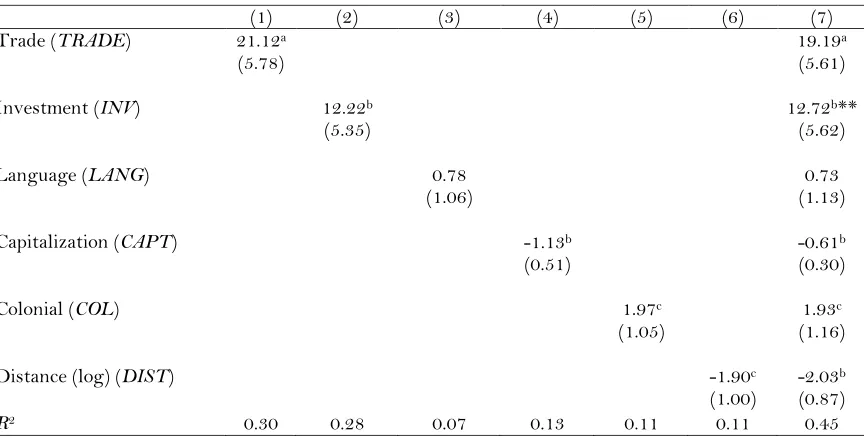
4.4 Cross-Section Analysis
In estimating the cross-section model given in Equation (21), we are able to quantify the impact of
various determinants affecting the extent of the shocks given by the variance ratios based on the
constant spillover model. To examine the effect on both the sign and loading of each control variable on
the dependent variable (the variance ratios), we include the control variables separately in the regression
estimation. This yields seven models, where the final model presents the results of the full model.
The results are presented in Table 6. Models [1] and [2] show highly substantive evidence for
trade and financial investment flows having positive parameter values at 16.25 and 10.45, respectively.
The results show that a 1% increase in the level of bilateral trade causes a corresponding increase of
0.16% in the variance ratio of shocks. This finding is in line with studies by Bodurtha et al. (1989),
Campbell and Hamao (1992) and Bracker et al. (1999), who found bilateral trade to be a major
determinant of international stock market co-movement. Similarly, a 1% increase in the level of asset
investment leads to an increase of 0.10% in the variance ratio of shocks. This is a new result in the
literature on equity market integration in emerging countries. The impact of a common language,
although positive, is statistically insignificant in explaining the magnitude of variance ratios.
According to Model [4], a higher level of domestic market capitalization is negatively associated
with the magnitude of the variance ratios. This suggests that as emerging markets become stronger, the
influence of shock spillovers from developed countries diminishes. The estimated coefficient of past
colonial ties is positive and significant, suggesting that culture has a role in explaining the level of
spillover effects. Similar to the findings of empirical trade studies, the role of distance also has a
significantly negative effect on the magnitude of the spillover effects from advanced to emerging
countries. The negative impact of distance can be interpreted as a proxy for information asymmetries
and other non-standard costs in the asset markets. Model [7] in Table 6 shows the results for the full
model. We find that the magnitude and sign (along with their significance levels) of the model’s parameters did not change much. The R2 of the full model indicates that about 50% of the variations in
the level of the spillover effects (measured by the variance ratios) are explained by the factors considered
in the cross-section regression. Overall, the findings indicate that bilateral trade, foreign portfolio
investment, domestic market capitalization, past colonial ties and distance play important roles in
13
5. Conclusions
The purpose of this paper has been to study the dynamics of the equity market integration between
Asian and MENA emerging markets and selected developed countries. The results show that shock
spillovers from major developed markets exert a heterogeneous effect on emerging markets and that the
magnitude of the shocks also varies widely across the countries in our sample. These results reconcile
the different stages of financial and economic development experienced by the Asian and MENA
emerging countries over the past decade. Our paper makes a distinctive contribution to the literature on
equity market integration in emerging markets by investigating the role of the underlying determinants
in explaining the shock spillovers from advanced to emerging equity markets. The results indicate that
bilateral trade, foreign portfolio investment, domestic market capitalization, past colonial ties and
distance play important roles in explaining the return and volatility spillovers from advanced to
emerging countries.
One implication for policy arising from these results is that as emerging countries become more
integrated with developed markets or have a greater amount of foreign flows invested in their markets,
they should strengthen prudential regulations to mitigate rising risks of financial spillovers. New
research indicates that the asset management industry could potentially be a source of vulnerability for
emerging asset markets (Miyajima and Shim, 2014). Therefore, any existing prudential policy
framework that focuses on microprudential and consumer protection needs to change its perspective
towards macroprudential regulation to deal with vulnerabilities created by asset managers. Another
lesson for policy is the importance of fostering stronger and more liquid capital markets to help improve
the resilience of emerging financial markets against shocks. However, this itself requires more granular
and timely information from market participants. Emerging markets can use big data to improve
14 RE F E R E N C E S
Ayuso, J., & Blanco, R. (2001). Has financial market integration increased during the nineties? Journal of International Financial Markets, Institutions and Money, 11(3-4), 265-287.
Baca, S.P., Garbe, B.L., & Weiss, R.A. (2000). The rise of sector effects in major equity markets. Financial Analysts Journal, 56(5), 34-40.
Baele, L., (2005). Volatility spillover effects in European equity markets. Journal of Financial and Quantitative Analysis, 40(2), 373-401.
Balli, F., Basher, S.A., & Jean Louis, R. (2013). Sectoral equity returns and portfolio diversification opportunities across the GCC region. Journal of International Financial Markets, Institutions and Money, 25(July), 33-48.
Bauwens, L., Laurent, S. & Rombotus, J.V.K. (2006). Multivariate GARCH models: a survey. Journal of Applied Econometrics, 21(1), 79-109.
Bekaert, G., & Harvey, C.R. (1997). Emerging equity market volatility. Journal of Financial Economics, 43(1), 29-77.
Bekaert, G., & Harvey, C.R. (2000). Foreign speculators and emerging equity markets. Journal of Finance, 55(2), 565-613.
Bekaert, G., Harvey, C.R., & Lumsdaine, R.L. (2002). The dynamics of emerging market equity flows. Journal of International Money and Finance, 21(3), 295-350.
Bekaert, G., Harvey, C.R., & Lundblad, C. (2005). Does financial liberalization spur growth? Journal of financial Economics, 77(1), 3-55.
Bodurtha, J.N., Cho, D.C., & Senbet, L.W. (1989). Economic forces and the stock market: an international perspective. Global Finance Journal, 1(1), 21-46.
Bracker, K., Docking, D.S., & Koch, P.D. (1999). Economic determinants of evolution in international stock market integration. Journal of Empirical Finance, 6(1), 1-27.
Brooks, R., & Del Negro, M. (2004). The rise in comovement across national stock markets: market integration or IT bubble? Journal of Empirical Finance, 11(5), 659-680.
Campbell, J.Y., & Hamao, Y. (1992). Predictable stock returns in the United States and Japan: a study of long‐term capital market integration. Journal of Finance, 47(1), 43-69.
Caporale, G.M., Cipollini, A., & Spagnolo, N. (2005). Testing for contagion: a conditional correlation analysis. Journal of Empirical Finance, 12(3), 476-489.
Caporale, G.M., Pittis, N., & Spagnolo, N. (2006). Volatility transmission and financial crises. Journal of Economics and Finance, 30(3), 376-390.
Carrieri, F., Errunza, V., & Hogan, K. (2007). Characterizing world market integration through time. Journal of Financial and Quantitative Analysis, 42(4), 915-940.
Cavaglia, S., Brightman, C., & Aked, M. (2000). The increasing importance of industry factors. Financial Analysts Journal, 56(5), 41-54.
Chen, G.-M., Firth, M., & Meng Rui, O. (2002). Stock market linkages: evidence from Latin America. Journal of Banking and Finance, 26(6), 1113-1141.
Chen, N.-F., & Zhang, F. (1997). Correlations, trades and stock returns of the Pacific-Basin markets. Pacific-Basin Finance Journal, 5(5), 559-577.
Christiansen, C. (2007). Volatility‐spillover effects in European bond markets. European Financial Management, 13(5), 923-948.
Diamandis, P.F. (2009). International stock market linkages: evidence from Latin America. Global Finance Journal, 20(1), 13-30.
Diebold, F.X., & Yilmaz, K. (2009). Measuring financial asset return and volatility spillovers, with application to global equity markets. Economic Journal, 119(534), 158-171.
Engle, R., Gallo, G., & Velucchi, M. (2012). Volatility spillovers in East Asian financial markets: a MEM-based approach. Review of Economics and Statistics, 94(1), 222-223.
Floros, C. (2008). Modelling volatility using GARCH models: evidence from Egypt and Israel. Middle Eastern Finance and Economics, 2, 31-41.
Forbes, K.J., & Rigobon, R. (2002). No contagion, only interdependence: measuring stock market comovements. Journal of Finance, 57(5),2223-2261.
15
Gutierrez, J.A., Martinez, V., & Tse, Y. (2009). Where does return and volatility come from? The case of Asian ETFs? International Review of Economics and Finance, 18(4), 671-679.
Hammoudeh, S., & Choi, K. (2004). Volatility regime-switching and linkage among GCC stock markets. Paper presented at the the 11th ERF Conference, Egypt.
Hammoudeh, S.M., Yuan, Y., & McAleer, M. (2009). Shock and volatility spillovers among equity sectors of the Gulf Arab stock markets. Quarterly Review of Economics and Finance, 49(3), 829-842.
Hilliard, J.E. (1979). The relationship between equity indices on world exchanges. Journal of Finance, 34(1), 103-114.
Jinjarak, Y., Wongswan, J., & Zheng, H. (2011). International fund investment and local market returns. Journal of Banking and Finance, 35(3), 572-587.
Khalifa, A., Hammoudeh, S., & Otranto, E. (2014). Patterns of volatility transmissions within regime switching acrss GCC and global markets. International Review of Economics and Finance, 29(January), 512-524.
Levine, R., & Zervos, S. (1998). Capital control liberalization and stock market development. World Development, 26(7), 1169-1183.
Ljung, G.M., & Box, G.E. (1978). On a measure of lack of fit in time series models. Biometrika, 65(2), 297-303.
Lucey, B.M., & Zhang, Q. (2010). Does cultural distance matter in international stock market comovement? Evidence from emerging economies around the world. Emerging Markets Review, 11(1), 62-78.
Masih, A.M., & Masih, R. (1999). Are Asian stock market fluctuations due mainly to intra-regional contagion effects? Evidence based on Asian emerging stock markets. Pacific-Basin Finance Journal, 7(3-4), 251-282.
Mayer, T., & Zignago, S. (2011). Notes on CEPII's distances measures : the GeoDist Database. CEPII Working Paper 2011-25.
Miyajima, K., & Shim, I. (2014). Asset managers in emergign market economies. BIS Quartelry Review, September, 19-34.
Neaime, S. (2006). Volatilities in emerging MENA stock markets. Thunderbird International Business Review, 48(4), 455-484.
Neaime, S. (2012). The global financial crisis, financial linkages and correlations in returns and volatilities in emerging MENA stock markets. Emerging Markets Review, 13(3), 268-282.
Ng, A. (2000). Volatility spillover effects from Japan and the US to the Pacific-Basin. Journal of International Money and Finance, 19(2), 207-233.
Ozer Balli, H., Balli, F., & Jean Louis, R. (2013). Time-varying spillover effects on sectoral equity returns. International Review of Finance, 13(1), 67-91.
Pretorius, E. (2002). Economic determinants of emerging stock market interdependence. Emerging Markets Review, 3(1), 84-105.
Scheicher, M. (2001). The comovements of stock markets in Hungary, Poland and the Czech Republic. International Journal of Finance and Economics, 6(1), 27-39.
Stiglitz, J. E. (2002). Information and the change in the paradigm in economics. American Economic Review, 92(3), 460-501.
Susmel, R. (2001). Extreme observations and diversification in Latin American emerging equity markets. Journal of International Money and Finance, 20(7), 971-986.
Tay, N.S., & Zhu, Z. (2000). Correlations in returns and volatilities in Pacific-Rim stock markets. Open Economies Review, 11(1), 27-47.
Umutlu, M., Akdeniz, L., & Altay-Salih, A. (2010). The degree of financial liberalization and aggregated stock-return volatility in emerging markets. Journal of Banking and Finance, 34(3), 509-521. Worthington, A., & Higgs, H. (2004). Transmission of equity returns and volatility in Asian developed
and emerging markets: a multivariate GARCH analysis. International Journal of Finance & Economics, 9(1), 71-80.
Yang, J., Hsiao, C., Li, Q., & Wang, Z. (2006). The emerging market crisis and stock market linkages: further evidence. Journal of Applied Econometrics, 21(6), 727-744.
Yilmaz, K. (2010). Return and volatility spillovers among the East Asian equity markets. Journal of Asian Economics, 21(3), 304-313.
16
Table 1 – Stock Return Statistics
Mean STD Skew Kurt Q(1) Q(4) Q†(1) Q†(4)
Asia
Bangladesh -0.19 3.6 -0.24 5.11 -0.07 -0.02 0.20a 0.13a
India 0.13 4.41 -0.29 5.35 -0.04 -0.03b 0.22a 0.17a
Indonesia 0.02 6.21 -0.48 12.34 -0.02 0.07a 0.26a 0.25a
South Korea 0.06 5.2 -0.51 9.94 -0.07b -0.03a 0.31a 0.34a
Malaysia 0.08 4.12 -0.29 18.20 -0.01 -0.12a 0.19a 0.47a
Pakistan 0.02 4.61 -1.00 7.62 0.10a 0.02a 0.30a 0.20a
Philippines 0.06 4.4 -0.14 6.71 -0.05c -0.01a 0.22a 0.11a
Singapore 0.09 3.29 -0.34 6.52 0.02 0.01 0.29a 0.18a
Thailand 0.02 5.23 0.59 10.70 -0.02 -0.01b 0.10a 0.07a
Vietnam -0.12 5.27 0.27 5.12 0.22a 0.13a 0.34a 0.25a
GCC
Bahrain -0.46 3.21 -1.39 13.35 0.05 0.09a 0.21a 0.16a
Kuwait 0.00 3.51 -0.85 6.85 0.08c -0.05a 0.32a 0.18a
Oman 0.24 3.7 -1.03 12.69 0.03 0.05a 0.13a 0.10a
Qatar 0.06 3.51 -0.03 7.33 -0.01 0.07 0.30a 0.20a
Saudi Arabia -0.07 4.32 -1.32 8.22 0.03 -0.04 0.19a 0.30a
UAE 0.10 5.1 -0.65 9.53 0.04 0.02b 0.08c 0.07a
Non-GCC MENA
Egypt 0.19 4.21 -0.55 5.55 0.05b 0.00a 0.09a 0.11a
Jordan 0.03 2.47 -0.43 9.19 0.00 0.05a 0.25a 0.31a
Morocco 0.11 2.63 -0.48 7.69 -0.02 0.06c 0.14a 0.08a
Tunisia 0.12 2.42 -0.15 8.29 -0.05 0.07 0.15a 0.14a
US 0.13 2.33 -0.57 7.40 -0.10a -0.04a 0.21a 0.19a
Euro 0.07 3.47 -0.32 5.56 -0.12a -0.03a 0.42a 0.21a
Japan -0.03 3.19 -0.10 5.40 -0.06b -0.02c 0.19a 0.04a
17
Table 2 – Determinant Factor Statistics
Mean (%) STD Maximum (%) Minimum (%) Observations
Export to US 16.43 9.62 34.23 1.98 20
Export to Europe 14.11 19.24 73.76 1.71 20
Export to Japan 1.57 1.39 5.58 0.05 20
Import to US 9.62 5.26 21.45 2.66 20
Import to Europe 14.49 18.13 62.28 5.37 20
Import to Japan 1.14 0.71 2.45 0.01 20
Equity investment from US 23.70 20.69 51.91 0.00 20
Equity investment from Europe 16.78 14.00 52.37 0.00 20
Equity investment from Japan 1.39 1.30 4.18 0.00 20
Distance to US (km) 11,484 2,643 16,180 5840 20
Distance to Europe (km) 6315 2,226 9951 955 20
Distance to Japan (km) 6781 2642 11534 1,157 20
18
Table 3 – Constant Spillover Analysis
Asia
Bangladesh 0.10 -1.65c -1.11b -0.18 1.63b 1.15b -0.09 0.00 0.27a 0.59a (0.08) (0.89) (0.51) (0.88) (0.54) (0.45) (0.90) (0.01) (0.11) (0.13) India -0.08b -0.69 -0.22 0.20 0.89b 0.27 -0.21 -0.03b 0.09a 0.88a
(0.04) (1.11) (0.34) (0.39) (0.41) (0.34) (0.39) (0.01) (0.01) (0.03) Indonesia -0.08c -0.03 0.01 0.12 0.55b -0.12 -0.04 0.00 0.17a 0.82a
(0.05) (0.67) (0.38) (0.41) (0.24) (0.38) (0.41) (0.01) (0.02) (0.01) South Korea -0.13a 0.34 -0.11 0.62c -0.04 0.42b -1.05a 0.00 0.14a 0.84a
(0.04) (0.74) (0.40) (0.36) (0.73) (0.21) (0.31) (0.02) (0.02) (0.03) Malaysia -0.01 0.41c -0.25 0.09 0.71b 0.31c -0. 13c 0.00 0.13a 0.85a
(0.04) (0.24) (0.22) (0.28) (0.31) (0.16) (0.07) (0.01) (0.02) (0.03) Pakistan 0.06b -1.21c 0.43c -0.35c 1.31a 0.51b 0.38c -0.02b 0.19a 0.77a
(0.03) (0.67) (0.26) (0.40) (0.22) (0.25) (0.20) (0.01) (0.02) (0.03) Philippines -0.05 -1.52b 0.06 -0.13 1.45a -0.14 0.61a 0.02 0.12a 0.81a
(0.03) (0.65) (0.33) (0.41) (0.21) (0.33) (0.14) (0.02) (0.02) (0.03) Singapore -0.06 0.01 0.01 0.11 0.21 0.03 -0.11 -0.03c 0.15a 0.82a
(0.04) (0.41) (0.26) (0.31) (0.53) (0.21) (0.10) (0.01) (0.02) (0.03) Thailand -0.06 0.78 -0.47b 0.64b 1.12a 0.45b 0.82a -0.01 0.13a 0.84a
(0.04) (0.67) (0.22) (0.32) (0.25) (0.14) (0.25) (0.02) (0.02) (0.03) Vietnam 0.23a 0.22c 0.12 0.51 0.17c -0.24 -0.60b -0.01 0.21a 0.55a
(0.04) (0.09) (0.45) (0.31) (0.53) (0.21) (0.10) (0.01) (0.02) (0.03)
GCC
Bahrain 0.14a -0.08 -0.11 0.19 0.83a -0.05 -0.14 -0.03b 0.05a 0.88a (0.04) (0.09) (0.35) (0.52) (0.21) (0.33) (0.79) (0.01) (0.02) (0.03) Kuwait 0.12b -1.19b 0.09 -0.79b 1.22b -0.25c 0.83b -0.03b 0.17a 0.77a
(0.04) (0.59) (0.28) (0.33) (0.60) (0.14) (0.35) (0.01) (0.02) (0.03) Oman 0.15a -0.76c 0.72b -0.30 0.73a -0.66b 0.22 -0.04c 0.21a 0.76a
(0.04) (0.38) (0.30) (0.21) (0.22) (0.32) (0.35) (0.02) (0.02) (0.03) Qatar -0.25a -0.18b 0.22a -0.30c 0.26a -0.21a 0.28c -0.04a 0.15a 0.78a
(0.04) (0.09) (0.06) (0.05) (0.09) (0.06) (0.05) (0.01) (0.01) (0.03) Saudi Arabia 0.07 -0.82a 1.31a -0.19 1.01a -1.39c 0.23 -0.03 0.19a 0.78a
(0.07) (0.24) (0.32) (0.65) (0.20) (0.69) (0.63) (0.02) (0.01) (0.02) United Arab Emirates 0.09c -1.89c 0.41 -0.450 1.94a -0. 32 0.36c -0.03b 0.19a 0.80a
(0.04) (1.12) (0.40) (0.65) (1.01) (0.30) (0.65) (0.01) (0.01) (0.03)
Non-GCC MENA
Egypt -0.01 -1.08 0.08 -0.53 1.45b -0.01 0.58 -0.02c 0.12a 0.85a (0.04) (0.75) (0.33) (0.44) (0.70) (0.33) (0.44) (0.01) (0.01) (0.03) Jordan 0.03 -0.47c 0.32 -0.04 0.81c -0.26 0.05 -0.02c 0.09a 0.88a
(0.04) (0.25) (0.19) (0.25) (0.44) (0.20) (0.25) (0.01) (0.02) (0.03) Morocco 0.02 -0.27 -0.35c 0.16 0.35b 0.31b -0.18 0.02 0.11a 0.82a
(0.04) (0.45) (0.19) (0.22) (0.11) (0.14) (0.14) (0.02) (0.03) (0.03) Tunisia -0.07 0.44c 0.27c 0.31 -0.48 0.79b -0.34 -0.01 0.60a 0.34a
(0.04) (0.24) (0.14) (0.32) (0.75) (0.36) (0.31) (0.02) (0.12) (0.06)
The constant spillover model for the emerging markets is defined as follows:
where is the conditional return of the emerging market s at time t; is the intercept; is the sensitivity to an emerging market’s own past performance; , and are in order the return spillovers
from US, European and Japanese equity markets and is the error term. The GARCH model is
19
Table 4 – Trend Spillover Analysis
Asia (n = 10)
Bangladesh 0.01 47.90c -2.25c 18.25a -0.89a -12.32 0.55 -48.93c 2.33c -21.35a 1.02a 12.82 -0.58b 0.31a 0.65a (0.08) (27.29) (1.23) (7.20) (0.32) (9.32) (0.55) (26.67) (1.20) (7.32) (0.32) (12.45) (0.55) (0.11) (0.09) India -0.08b -2.16 0.10 -1.11 0.05 1.37 -0.06 2.16 -0.09 1.38 -0.07 -1.33 0.06 0.09a 0.88a
(0.04) (1.86) (0.11) (1.13) (0.06) (1.14) (0.06) (1.86) (0.11) (1.11) (0.07) (1.14) (0.06) (0.01) (0.02) Indonesia -0.07c -2.29 0.16 0.96 -0.03 -1.75 0.11 3.34c -0.17c -0.95 0.05 1.99c -0.12b 0.17a 0.82a
(0.04) (1.80) (0.11) (1.23) (0.06) (1.38) (0.06) (1.96) (0.10) (1.27) (0.07) (1.11) (0.06) (0.02) (0.02) South Korea -0.15a 0.01 0.03 -2.32 0.08 3.28b -0.14c -0.07 -0.09b 2.73c -0.12 -2.90b 0.12c 0.14a 0.84a
(0.04) (2.01) (0.10) (1.47) (0.06) (1.39) (0.08) (2.01) (0.05) (1.45) (0.08) (1.37) (0.07) (0.02) (0.03) Malaysia -0.01 -013 0.02 -0.30 0.01 0.88 -0.06 0.16 -0.02 0.67 -0.02 -1.44c 0.07b 0.12a 0.87a
(0.04) (1.27) (0.08) (1.86) (0.05) (0.97) (0.06) (1.33) (0.08) (0.86) (0.04) (0.86) (0.04) (0.02) (0.02) Pakistan 0.07c -1.60 0.02 -1.77c 0.11c 1.42 -0.13c 1.53 0.14b 1.93c -0.12b -1.50 0.12b 0.18a 0.79a
(0.04) (1.65) (0.10) (1.01) (0.06) (1.26) (0.08) (1.74) (0.07) (1.11) (0.06) (1.32) (0.06) (0.02) (0.02) Philippines -0.05 -4.32c 0.18c -1.87c 0.11b 1.21 -0.08 4.42c 0.16b 1.98c -0.13c -1.25b 0.08 0.14a 0.80a
(0.04) (2.20) (0.10) (1.01) (0.05) (2.05) (0.11) (2.41) (0.06) (1.13) (0.06) (1.32) (0.06) (0.02) (0.02) Singapore -0.07c -3.06b 0.19b 0.04 -0.01 -0.47 0.04 2.93b -0.17b 0.35 -0.02 0.38 -0.04 0.14a 0.84a
(0.04) (1.34) (0.08) (0.92) (0.06) (1.06) (0.06) (1.35) (0.07) (0.90) (0.05) (1.20) (0.06) (0.02) (0.03) Thailand -0.05 0.58 0.01 -1.27 0.04 1.60 -0.06 -0.50 0.01 1.60 -0.06 -1.70c 0.16b 0.13a 0.85a
(0.04) (2.33) (0.13) (1.38) (0.07) (1.42) (0.08) (2.37) (0.03) (1.40) (0.07) (1.06) (0.06) (0.02) (0.03) Vietnam 0.23a -1.77 0.09 6.73 -0.31 3.60 -0.15 -22.51c 0.81b -0.36 0.22 -3.51a 0.14b 0.44a 0.50a
(0.06) (12.80) (0.39) (6.05) (0.30) (8.79) (0.42) (12.37) (0.32) (0.29) (0.22) (1.04) (0.06) (0.09) (0.09)
GCC (n = 6)
Bahrain 0.14b -1.53b 0.38c 3.62 -0.17 -1.29 -0.05 1.26 -0.40 -3.62 0.17 0.45 -0.04 0.09a 0.84a (0.06) (0.59) (0.21) (3.65) (0.14) (4.12) (0.20) (6.76) (0.36) (3.76) (0.20) (0.65) (0.20) (0.02) (0.03) Kuwait 0.12b 0.45b -0.11c 3.56b -0.20b -1.42 0.05 -1.30 0.10 -4.05b 0.61b 1.51 -0.01 0.39a 0.53a
(0.05) (0.21) (0.05) (1.78) (0.10) (3.12) (0.21) (1.30) (0.51) (1.95) (0.28) (3.41) (0.12) (0.01) (0.01) Oman 0.14a -4.21 0.20b 2.13 -0.15b (-0.56 0.02 3.13 -0.26 -3.41c 0.15c 1.31 -0.04 0.24a 0.74a
(0.03) (5.20) (0.07) (1.70) (0.07) (1.11) (031) (2.12) (0.71) (2.15) (0.08) (2.44) (0.04) (0.02) (0.02) Qatar -0.24a 1.45c -0.10c -1.15b 0.12c -0.20 0.09c -1.79c 0.14b 2.41a -0.08a -0.18 0.11c 0.42a 0.48a
(0.06) (0.78) (0.06) (0.51) (0.04) (1.34) (005) (1.06) (0.05) (0.45) (0.02) (0.25) (0.20) (0.02) (0.03) Saudi Arabia 0.05 6.10 0.32 3.67 -0.21b 3.50 -0.15 -5.12 0.25 -5.05c 0.17a -2.32 0.02c 0.311a 0.63a
(0.05) (4.31) (0.45) (2.80) (0.10) (3.45) (0.21) (5.55) (0.11) (2.46) (0.06) (2.41) (0.01) (0.01) (0.01) UAE 0.10 1.54 -0.03 0.45 0.03 -1.15 0.21b 0.45 0.09c -0.48c -0.02 -2.54 0.17a 0.28a 0.71a
(0.07) (1.18) (0.06) (0.42) (0.04) (1.21) (009) (1.20) (0.05) (0.31) (0.03) (3.12) (0.05) (0.03) (0.03)
MENA(n = 4)
Egypt -0.03 0.12 -0.09 -1.11 0.04 -0.44 0.01 -0.29 0.06 1.28 -0.06 0.45 -0.01 0.16a 0.76a (0.05) (0.44) (0.38) (2.46) (0.37) (1.46) (0.27) (2.54) (1.12) (1.54) (0.21) (0.47) (0.13) (0.02) (0.02) Jordan 0.02 1.12 -0.06 0.29 -0.02 0.48 -0.07 -0.85 0.12b -0.23c 0.06b -0.67 0.09 0.17a 0.74a
(0.03) (0.88) (048) (1.27) (1.05) (1.51) (0.15) (1.15) (0.06) (0.14) (0.03) (0.61) (0.12) (0.02) (0.02) Morocco 0.05 0.49 -0.26 -0.29 0.07 0.71 -0.05 -0.44 0.09 -0.47 0.18b -0.44 0.05 0.16a 0.78a
(0.05) (0.51) (044) (1.58) (0.94) (1.26) (0.05) (1.25) (0.06) (0.34) (0.08) (0.69) (0.14) (0.01) (0.03) Tunisia -0.06 1.12 -0.06 3.12b -0.19b 0.21 0.00 -1.52 0.07 -2.44 0.16b -0.22 0.15 0.74a 0.25a (0.04) (1.15) (028) (1.45) (0.08) (1.15) (0.07) (1.20) (0.12) (2.42) (0.07) (0.12) (0.21) (0.04) (0.04)
Notes:The trend spillover model for the emerging markets is defined as follows:
+
20
Table 5 – Variance Ratios
US Euro Japan Own
Asia
Bangladesh 28.13 13.46 11.14 49.27
India 15.98 10.13 11.34 62.55
Indonesia 16.45 8.14 19.21 56.20
South Korea 12.26 9.07 13.41 65.26
Malaysia 14.01 7.04 13.45 65.50
Pakistan 18.78 4.29 6.57 70.36
Philippines 30.21 8.42 14.45 46.91
Singapore 8.41 6.53 7.48 77.68
Thailand 15.12 6.29 13.67 64.92
Vietnam 17.15 4.04 13.01 65.80
GCC
Bahrain 18.05 12.25 2.01 67.69
Kuwait 21.61 19.14 12.35 46.90
Oman 20.45 20.41 3.64 55.50
Qatar 19.56 14.14 14.51 51.79
Saudi Arabia 23.13 14.23 1.98 60.66
UAE 18.78 16.26 10.96 54.00
Non-GCC MENA
Egypt 17.67 12.12 4.71 65.50
Jordan 16.76 7.65 2.71 72.88
Morocco 21.12 23.41 3.03 52.44
Tunisia 20.14 20.19 2.15 57.55
This table represents the percentage variance ratios of spillover shocks for the constant spillover model from the US, European and Japanese market and the emerging market’s own shocks. Shocks from
developed markets are given by Rsust us 2 us t2 hs t , Rst
euro euro2 euro t2
hs t and Rst
apan apan2 apan t2 hs t , where
21
Table 6 – Aggregate Cross-Section Analysis
(1) (2) (3) (4) (5) (6) (7)
Trade (TRADE) 21.12a 19.19a
(5.78) (5.61)
Investment (INV) 12.22b 12.72b**
(5.35) (5.62)
Language (LANG) 0.78 0.73
(1.06) (1.13)
Capitalization (CAPT) -1.13b -0.61b
(0.51) (0.30)
Colonial (COL) 1.97c 1.93c
(1.05) (1.16)
Distance (log) (DIST) -1.90c -2.03b
(1.00) (0.87)
R2 0.30 0.28 0.07 0.13 0.11 0.11 0.45
This table shows the cross section estimation results for all three developed markets together following the
formula: where is the
calculated variance ratio of shocks from developed market to emerging market , is the bilateral trade variable, is the variable of security investments, is a dummy variable for common language,
22
Figure 1: Stock prices in selected Asian and MENA countries
BD, Bangladesh; IN, India; ID, Indonesia; KO, South Korea; MY, Malaysia; PK, Pakistan; PH, the Philippines; SG, Singapore; TH, Thailand; VN, Vietnam; BH, Bahrain; EG, Egypt; JO, Jordan; KW,
Kuwait; MA, Morocco; OM, Oman; QA, Qatar; SA, Saudi Arabia; TN, Tunisia; AE, United Arab Emirates
0
2000
4000
6000
01jan2000 01jan2005 01jan2010 01jan2015
BD IN ID MY KO
PK PH SG TH VN
(a) Asian countries
0
1000
2000
3000
4000
5000
01jan2000 01jan2005 01jan2010 01jan2015
BH EG JO KW MA
OM QA SA TN AE