Morphology of Compounds Formed by Isothermal Reactive Diffusion
between Solid Fe and Liquid Al
Yasuhiko Tanaka
*1and Masanori Kajihara
*2Department of Materials Science and Engineering, Tokyo Institute of Technology, Yokohama 226-8502, Japan
The morphology of the compounds formed by the reactive diffusion between solid Fe and liquid Al was experimentally observed using Fe/ Al diffusion couples. The diffusion couples were prepared by an isothermal bonding technique and then immediately annealed at temperatures of T¼973, 1023 and 1073 K for various times up tot¼2:4103s. At these temperatures, Fe is solid, but Al is liquid. During annealing, a
compound region consisting of Fe2Al5and FeAl3is formed at the Fe/Al interface in the diffusion couple and grows towards the Fe solid
specimen. However, FeAl2and FeAl were not detected clearly. The thickness is much smaller for FeAl3than for Fe2Al5, and thus the compound
region is mainly composed of Fe2Al5. AtT¼973{1073K, FeAl3is produced as a rather uniform thin layer. On the other hand, the Fe2Al5
region shows the irregular tongue-like morphology atT¼973{1023K but the uniform layer morphology atT¼1073K. The irregularity of the Fe2Al5region is attributed to the anisotropy for the interdiffusion coefficient of Fe2Al5. The temperature dependence of the irregularity implies
that the anisotropy is large atT¼973{1023K but small atT¼1073K. The mean thickness of the compound region is proportional to a power function of the annealing time. Although the activation enthalpy of the proportionality coefficient is evaluated with an Arrhenius equation, the morphology of the Fe2Al5region varies depending on the annealing temperature. In such a case, the rate-controlling process for the growth of
the compound region cannot be readily estimated from the activation enthalpy. [doi:10.2320/matertrans.M2009128]
(Received April 9, 2009; Accepted June 22, 2009; Published August 5, 2009)
Keywords: reactive diffusion, intermetallic compounds, aluminization, bulk diffusion, iron-aluminum system
1. Introduction
In many binary alloy systems, intermetallic compounds appear as stable phases.1) If a diffusion couple is prepared from two different pure metals in such a binary system and then isothermally annealed at an appropriate temperature, some compounds may be formed as layers at the interface between the two metals after certain periods due to reactive diffusion. For various alloy systems, the kinetics of the reactive diffusion was experimentally studied by many investigators.2–61) However, all the stable compounds indicated in the equilibrium phase diagram1) may not be necessarily recognized in the diffusion couple. For instance, the reactive diffusion between Au and Sn was experimentally examined at solid-state temperatures in previous studies.37–40) In these experiments, Au/Sn diffusion couples were prepared by a diffusion bonding technique, and then isothermally annealed in the temperature range of 393–473 K. In this temperature range, AuSn4, AuSn2, AuSn, Au5Sn and are
the stable compounds in the binary Au–Sn system.1)After annealing, however, AuSn4, AuSn2 and AuSn layers were
discerned at the Au/Sn interface in the diffusion couple, but Au5Sn and were not observed clearly. In contrast, the
reactive diffusion between Ag and Sn was experimentally examined at temperatures of 433–473 K using the Ag/Sn diffusion couples prepared by the diffusion bonding tech-nique in a previous study.43) In this case, all the stable compounds of Ag3Sn andare formed as layers at the Ag/Sn
interface in the diffusion couple due to annealing. Thus, the formation behavior of compounds during reactive diffusion varies depending on the combination of metals and/or alloys.2–61)
The reactive diffusion between liquid Al and solid Fe or Fe-base alloys has been experimentally studied by many
researchers.62–72)In an experiment by Bouche´et al.,69)Fe/Al diffusion couples were prepared by a melt bath technique, and then isothermally annealed at temperatures of 973– 1173 K. A similar experiment was conducted by Bouayadet al.71)In the binary Fe–Al system,1)FeAl3, Fe2Al5, FeAl2and
FeAl are the stable compounds at these temperatures. According to their experimental results,69,71)however, only Fe2Al5 and FeAl3 are formed as visible layers at the Fe/Al
interface in the diffusion couple owing to annealing. The thickness is much smaller for the FeAl3 layer than for the
Fe2Al5 layer, and irregular tongue-like morphology is
realized for the Fe2Al5 layer. Such formation behavior of
Fe2Al5 and FeAl3was reported also in the other studies.
Recently, the reactive diffusion between liquid Al and solid Cu was experimentally observed in a previous study.73) In this experiment, Cu/Al diffusion couples were prepared by an isothermal bonding technique, and then isothermally annealed at temperatures of 973–1073 K. At these temper-atures, the,1and"2phases are the stable compounds in the
binary Cu–Al system.1)Unlike the binary Fe–Al system, all the stable compounds are produced as uniform layers at the Cu/Al interface in the diffusion couple due to annealing. In the isothermal bonding technique,73)the Al melt and the Cu solid specimen are separately preheated at the same temper-ature as the annealing tempertemper-ature in a vacuum. After sufficient preheating, the melt and the solid specimen are bonded each other, and then annealed immediately. Thus, in the isothermal bonding technique, the temperatures of the melt and the solid specimen are equivalent and remain constant during preheating, bonding and annealing. On the other hand, in the melt bath technique,69,71) the solid specimen is preheated at a certain temperature lower than that of the melt, and then immersed in the melt for annealing. During annealing, compound layers are formed at the interface between the solid specimen and the melt. However, the temperature of the solid specimen gradually increases with increasing annealing time in the early stages, and *1Graduate Student, Tokyo Institute of Technology
were cut from a commercial rod of pure Fe with a diameter of 8 mm and purity of 99.7%. The Fe rod contains a trace of C, 0.01 mass% of Si, 0.25 mass% of Mn, 0.004 mass% of P, 0.004 mass% of S, 0.01 mass% of Cu, 0.01 mass% of Ni and 0.01 mass% of Cr as impurities. The columnar specimens were separately annealed in evacuated silica capsules at a temperature of 1173 K for a time of 2 h, followed by air cooling without breaking the capsules. The top and bottom flat-surfaces of each annealed columnar specimen were mechanically polished on 800–4000 emery papers.
A commercial rod of pure Al with a diameter of 6 mm and purity of 99.99% was cut into columnar specimens with a length of 9.6 mm. Each polished Fe specimen was encapsu-lated together with a columnar Al specimen in an evacuated silica capsule with an inner diameter of 8.5 mm. The silica capsule was isothermally preheated for 1:8103s at 973,
1023 and 1073 K. During preheating, the Fe solid specimen was separated from the Al melt in the silica capsule. After preheating, a flat surface of the Fe solid specimen was immediately contacted with that of the Al melt with a diameter of 8.5 mm and a length of 4.8 mm to prepare a columnar Fe/Al diffusion couple. The diffusion couple was isothermally annealed for various times up to 2:4103s at
the same temperature as preheating, followed by water quenching without breaking the capsule. The annealing temperature and time are denoted byT andt, respectively.
Cross-sections of the annealed diffusion couple were mechanically polished on 800–4000 emery papers and then finished using diamond with a diameter of 1mm. The microstructure of the cross-section was observed with a back-scattered electron image (BEI) by scanning electron microscopy (SEM). The SEM observation was carried out also for the cross-section chemically etched with nitro-hydrochloric acid at room temperature for 75 s. Concentra-tions of Fe and Al in each phase on the cross-section were measured by electron probe microanalysis (EPMA).
3. Results and Discussion
3.1 Microstructure
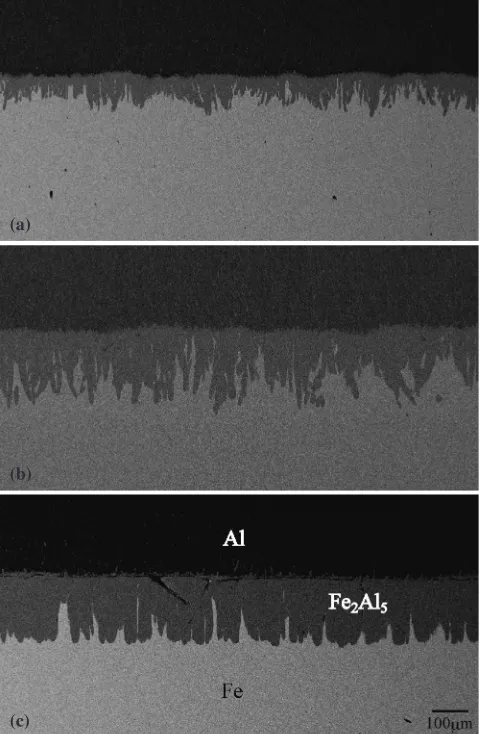
Typical BEI micrographs of the cross-section for various diffusion couples are shown in Fig. 1. Figure 1(a), (b) and (c) indicates the micrographs of the diffusion couples annealed at T ¼973, 1023 and 1073 K, respectively, for t¼1:5 102s. In this figure, the brightest region on the lower side is
the Fe specimen, and the darkest region on the upper side is the Al specimen. As can be seen, a compound region of tongue-like morphology with an intermediate contrast is observed between the Fe and Al specimens. The EPMA measurement indicates that this compound region is com-posed of Fe2Al5 and FeAl3. Here, Fe2Al5 and FeAl3 are
formed on the Fe and Al sides, respectively, in the compound region. However, the thickness is much smaller for FeAl3
than for Fe2Al5, and hence FeAl3 cannot be clearly
recognized in Fig. 1. Since the thickness of FeAl3 is
negligible, the compound region is merely called the Fe2Al5
region as long as attention is focused on the morphology of Fe2Al5. The Fe2Al5 region grows mainly into the Fe
specimen. Hence, the irregularly wavy Fe/Fe2Al5 interface
migrates towards the Fe specimen, but the rather smooth FeAl3/Al interface is almost stationary.
A BEI micrograph for the Fe2Al5region on the chemically
etched cross-section of the diffusion couple withT¼973K andt¼1:2103s is shown in Fig. 2. As can be seen, each tongue of the Fe2Al5region consists of polycrystalline grains.
Here, Fe2Al5 possesses the orthorhombic crystal structure
with lattice parameters ofa¼0:76573nm,b¼0:64087nm and c¼0:42265nm.74) Recently, the reactive diffusion between liquid Al and solid Fe was experimentally observed
(b)
(c)
Fig. 1 Back-scattered electron images of cross-section for the Fe/Al diffusion couples annealed for t¼1:5102s at (a) T¼973K, (b)
[image:2.595.307.547.75.442.2]by Nishimoto et al.72)In their experiment, Fe/Al diffusion couples were prepared by the melt bath technique, and then annealed at T ¼1023K. Using such diffusion couples, the crystallographic orientation relationship of the polycrystal-line grain in the Fe2Al5region was measured by an electron
back-scattered diffraction (EBSD) technique. The EBSD measurement indicates that thecaxis of each grain is almost perpendicular to the initial Fe/Al interface but the aandb axes are randomly distributed on a plane mostly parallel to the Fe/Al interface. The interdiffusion coefficient of Fe2Al5
is much greater along thecaxis than along theaandbaxes.64) The most predominant parameter governing the growth rate of a compound during reactive diffusion is the interdiffusion coefficient of the growing compound.75)Although the growth rate is not necessarily a simple mathematical function of the interdiffusion coefficient, it is surely a monotonically increasing function of the interdiffusion coefficient.75–84) In the early stages, many fine Fe2Al5 grains with random
crystallographic orientations are produced at the Fe/Al interface.72) Of these random grains, those with the c axis nearly perpendicular to the Fe/Al interface preferentially grow along thecaxis over long distances without impinge-ment. As a result, the irregular tongue-like morphology is realized in the Fe2Al5 region.
Within the experimental annealing times, Fe2Al5 and
FeAl3were recognized as visible layers, but FeAl2and FeAl
were not detected by EPMA and SEM. As mentioned above, the interdiffusion coefficient of a growing compound is the most predominant parameter controlling the growth rate of
the compound.75) If compounds and are formed by
reactive diffusion in a diffusion couple and the interdiffusion
coefficient is much smaller for compound than for
compound , the growth is much more sluggish for
compoundthan for compound. At realistic experimental annealing times, the thickness becomes sufficiently large for
compound but not for compound . The compound with
negligible thicknesses cannot be observed in a metallo-graphical manner, even if the compound is actually formed in the diffusion couple. In the binary Fe–Al system, Fe2Al5and
FeAl3 correspond to compound, but FeAl2 and FeAl may
be compound.79)This is the reason why Fe
2Al5and FeAl3
are visible but FeAl2and FeAl are invisible under the present
experimental conditions.
3.2 Irregularity of Fe2Al5region
A BEI micrograph for the diffusion couple with T ¼1073K and t¼2:4103s is shown in Fig. 3. Unlike
Figs. 1 and 2, Fig. 3 indicates the Fe2Al5region with uniform
layer morphology. Except the early stages like Fig. 1(c), the uniform layer morphology was realized at most of the annealing times forT ¼1073K. Thus, the irregularity of the Fe2Al5 region varies depending on the annealing
temper-ature. In this section, the dependence of the irregularity on the annealing temperature will be discussed quantitatively.
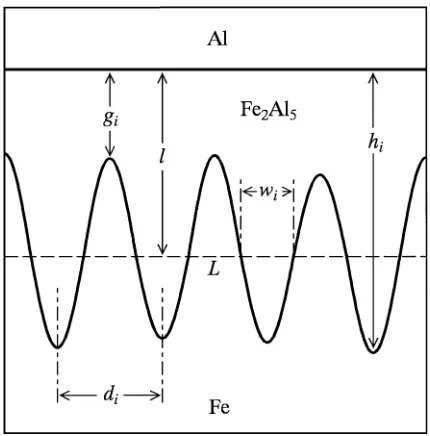
The morphology of the Fe2Al5 region is schematically
depicted in Fig. 4. Since attention is focused on the morphology, FeAl3 in the Fe2Al5 region is omitted in this
figure. From the cross-sectional BEI micrographs like Fig. 1, the mean interspacingd between the neighboring tongues in the Fe2Al5region was evaluated by the equation
Fig. 2 Back-scattered electron image of chemically etched cross-section for the Fe/Al diffusion couple annealed atT¼973K fort¼1:2103s.
Fig. 3 Back-scattered electron image of cross-section for the Fe/Al diffusion couple annealed atT¼1073K fort¼2:4103s.
[image:3.595.49.288.71.251.2] [image:3.595.307.547.71.253.2] [image:3.595.319.534.303.521.2]d¼ 1 N
XN
i¼1
di¼
L
N: ð1Þ
Here,diis the interspacing between the neighboring tongues along the test line with the lengthLparallel to the initial Fe/ Al interface, andNis the number of the tongues intersected by the test line. The results ofT ¼973, 1023 and 1073 K are shown as open triangles, squares and circles, respectively, in Fig. 5. In this figure, the ordinate indicates the logarithm of the mean interspacing d, and the abscissa shows the logarithm of the annealing time t. As can be seen, the interspacing d monotonically increases with increasing annealing time t. This means that the coarsening of the polycrystalline microstructure takes place in the Fe2Al5
region. The plotted points at each annealing temperature lie well on a straight line. Hence, d is expressed as a power function oftby the following equation:41)
d¼kdðt=t0Þm: ð2Þ
Here,t0is unit time, 1 s. It is adopted to make the argument
t=t0of the power function dimensionless. The proportionality
coefficientkdhas the same dimension asd, but the exponentn is dimensionless. From the plotted points in Fig. 5,kdandm were evaluated by the least-squares method. The evaluated values are indicated in Fig. 5. Using these values, d was calculated as a function of t from eq. (2). The results of T ¼973, 1023 and 1073 K are shown as dotted, dashed and solid lines, respectively, in Fig. 5. At each annealing time, the interspacing d increases with increasing annealing temperature T. Thus, the higher the annealing temperature is, the faster the coarsening occurs.
The fraction f of the width for the tongues along the test line was evaluated by the equation
f ¼1
L XN
i¼1
wi; ð3Þ
wherewiis the width of tongueiintersected with the test line
as shown in Fig. 4. The results ofT ¼973, 1023 and 1073 K fort¼6:0102s are shown as open triangles, squares and
circles, respectively, in Fig. 6. In this figure, the ordinate indicates the fraction f, and the abscissa shows the distancex measured from the position with f ¼0:5along the direction perpendicular to the initial Fe/Al interface. As the distancex increases, the fraction f monotonically decreases from 1 to 0
within x¼80mm at T ¼973{1023K but within x¼
20mm at T ¼1073K. Therefore, the irregularity of the Fe2Al5 region is considerably large atT ¼973{1023K but
small at T¼1073K. As previously mentioned, for most of the polycrystalline grains in the Fe2Al5region, thecaxis is
closely perpendicular to the initial Fe/Al interface, and thea andbaxes are randomly distributed on a plane almost parallel to the Fe/Al interface.72) Furthermore, the interdiffusion coefficient of Fe2Al5 is much greater along thecaxis than
along the a and b axes.64) Thus, the Fe
2Al5 grain grows
rapidly along the c axis but sluggishly along the a and b axes. Consequently, the irregular tongue-like morphology is actualized in the Fe2Al5region as shown in Fig. 2. According
to the result in Fig. 6, however, the irregularity of the Fe2Al5
region is markedly reduced atT¼1073K. This implies that the anisotropy for the interdiffusion coefficient of Fe2Al5
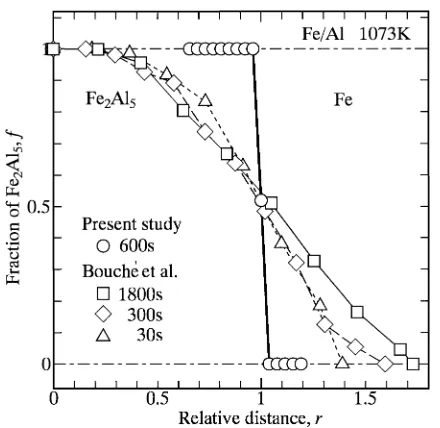
considerably decreases at temperatures around 1073 K. The result ofT¼1073K in Fig. 6 is represented as open circles in Fig. 7. In this figure, the ordinate shows the fraction f, and the abscissa indicates the relative distancerdefined as
r¼ ðxþlÞ=l: ð4Þ
Here,lis the mean thickness of the Fe2Al5region evaluated
by the equation
l¼A=L; ð5Þ
whereAis the total area of the Fe2Al5region corresponding
to the length L of the test line. In Fig. 7, open triangles, rhombuses and squares indicate the results of T ¼1073K for t¼3:0101, 3:0102 and 1:8103s, respectively,
Fig. 5 The interspacingdof the Fe2Al5region versus the annealing timet
for the Fe/Al diffusion couple atT¼973, 1023 and 1073 K shown as open triangles, squares and circles, respectively. Straight lines indicate the calculations from eq. (2).
Fig. 6 The fractionf versus the distancexin the Fe/Al diffusion couples annealed fort¼6:0102s atT¼973, 1023 and 1073 K shown as open
[image:4.595.64.279.68.286.2] [image:4.595.313.536.74.285.2]reported by Bouche´ et al.69)In the present study, f almost discontinuously decreases from 1 to 0 with increasing value of r at r¼1. On the other hand, in the study by Bouche´ et al.,69) f gradually decreases from 1 to 0 with increasing value ofrfromr¼0:2tor¼1:4{1:7.
The minimum thicknesslmin and the maximum thickness lmax of the Fe2Al5region are estimated as
lmin¼
1 N
XN
i¼1
gi ð6aÞ
and
lmax¼ 1
N XN
i¼1
hi; ð6bÞ
respectively. Here,giandhiare the thicknesses of the Fe2Al5
region at bottomiand topi, respectively, as shown in Fig. 4. Using the thicknessesl,lminandlmax, the ratiozwas defined as
z¼ ðlmaxlminÞ=l: ð7Þ
On the basis of the results in Fig. 6, z¼0:679, 0.684 and 0.077 were obtained from eq. (7) at T¼973, 1023 and 1073 K, respectively, fort¼6:0102s. The values ofzfor
T ¼973, 1023 and 1073 K are shown as an open triangle, inverse-triangle and circle, respectively, in Fig. 8. In this figure, the ordinate indicates z, and the abscissa shows the logarithm oft. On the other hand, the results ofT ¼973and 1073 K reported by Bouche´ et al.69) are indicated as open squares and rhombuses, respectively, and that ofT ¼1073K reported by Bouayadet al.71)is shown as open double-circles. For convenience’ sake, the present study is called study A, and the studies by Bouche´ et al. and Bouayad et al. are designated studies B and C, respectively. In the early stages,z is slightly greater than unity in studies B and C. As t increases, however,zincreases in study B, but decreases in study C. Nevertheless,zis much greater in both studies B and C than in study A. The results in Figs. 7 and 8 indicate that
the irregularity of the Fe2Al5region is much smaller in study
A than in studies B and C. In study B,69)the Fe solid specimen was preheated above the Al melt in a vacuum chamber before immersion into the melt. Due to the temperature gradient in the chamber, however, the preheating temperature of the Fe solid specimen may be lower than the immersion temperature of the Al melt. In contrast, the preheating temperature of the Fe solid specimen was 473 K independent of the immersion temperature in study C.71)In studies B and C, the tempera-ture of the Fe solid specimen continuously increases with increasing immersion time and then finally reaches to the immersion temperature. During continuous heating, Fe2Al5
is formed at the Fe/Al interface and grows towards the Fe solid specimen. According to the result in study A, however, the Fe2Al5 region is uniform atT¼1073K but irregular at
T <1073K. Therefore, in studies B and C, the Fe2Al5region
with irregular tongue-like morphology is produced during continuous heating at T <1073K, and grows during iso-thermal annealing atT ¼1073K. Consequently, it is not so easy to obtain the Fe2Al5 region with uniform layer
morphology by the melt bath technique.
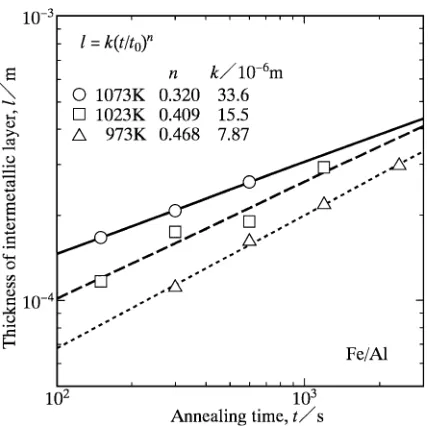
3.3 Growth behavior of intermetallic layer
In Section 3.2, the mean thicknesslof the Fe2Al5region
was evaluated by eq. (5). As mentioned in Section 3.1, however, a very thin FeAl3 layer exists between the Al
specimen and Fe2Al5. Consequently, the Fe2Al5 region is
actually composed of Fe2Al5 and FeAl3, and hence l
corresponds to the summation for the thicknesses of Fe2Al5
and FeAl3. Hereafter, the region consisting of Fe2Al5 and
FeAl3 is merely called the intermetallic layer. The values
of l for T ¼973, 1023 and 1073 K are plotted against the annealing time t as open triangles, squares and circles, respectively, in Fig. 9. In this figure, the ordinate and the abscissa show the logarithms oflandt, respectively. As can be seen, the thicknesslof the intermetallic layer monotoni-Fig. 7 The fractionf versus the relative distancerin the Fe/Al diffusion
couple annealed atT¼1073K fort¼6:0102s shown as open circles.
The results ofT¼1073K by Bouche´et al.69)are also indicated as various open symbols.
Fig. 8 The ratioz versus the annealing timet in the Fe/Al diffusion couples annealed fort¼6:0102s atT¼973, 1023 and 1073 K shown
[image:5.595.60.280.68.282.2] [image:5.595.316.538.69.282.2]cally increases with increasing annealing timet. The plotted points at each annealing temperature are located well on a straight line. Thus,lis expressed as a power function oftby the following equation:38–40)
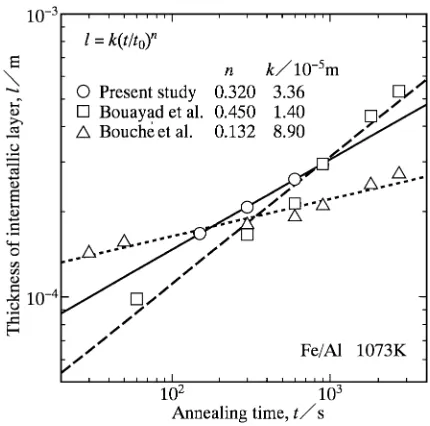
l¼kðt=t0Þn: ð8Þ
From the plotted points in Fig. 9, the proportionality coefficient k and the exponent n were evaluated by the least-squares method. The evaluated values are indicated in Fig. 9. These values provide the dependencies oflontwith dotted, dashed and solid lines forT ¼973, 1023 and 1073 K, respectively. At each experimental annealing time, the thicknessl increases with increasing annealing temperature T. Thus, the higher the annealing temperature is, the faster the intermetallic layer grows.
In the isothermal bonding technique,73) the Al melt is directly contacted with the inner wall of the silica capsule. Consequently, silica may be deoxidized by the Al melt during preheating and annealing, and Si will penetrate into the diffusion couple during annealing. In order to test the penetration, the concentration of Si for each phase in the diffusion couple was measured by EPMA. Hereafter, the concentration of component i is described using the mol fraction yi. According to the EPMA measurement, ySi is smaller than 0.02 for the Al melt, smaller than 0.005 for Fe2Al5, and equal to 0 for the Fe specimen. As previously
mentioned, the growth of the intermetallic layer is predom-inantly determined by the interdiffusion across the interme-tallic layer.75) Since the concentration in Fe
2Al5 is much
smaller for Si than for Fe and Al, however, the diffusional flux of Si across the intermetallic layer scarcely contributes to the interdiffusion. In contrast, the interdiffusion of Fe and Al across the intermetallic layer is influenced by Si through the thermodynamic interaction between Si and Fe and that between Si and Al. However, these thermodynamic inter-actions are very small atySi<0:005.85)Hence, the influence of Si on the interdiffusion is negligible. As a consequence,
p¼2pffiffiffiffiffiDt ð9Þ
Here,Dis the interdiffusion coefficient between Fe and Al in the Al melt. The temperature dependence of D is usually described by the equation
D¼D0expðQ=RTÞ; ð10Þ
where D0 is the pre-exponential factor, Qis the activation
enthalpy, andRis the gas constant. Since the solubility of Fe in Al is yFe¼0:014{0:033 atT ¼973{1073K, respective-ly,1) D is almost equal to the self or tracer diffusion coefficient of Fe in Al. As to this tracer diffusion coefficient, the following parameters are reported by Duet al.:86)D0¼
2:34107m2/s and Q¼35:0kJ/mol. These parameters giveD¼3:09109,3:82109and4:63109m2/s at T ¼973, 1023 and 1073 K, respectively. On the other hand, as shown in Figs. 5 and 9, the longest annealing time tm is 2:4103,1:2103 and6:0102s atT ¼973, 1023 and
1073 K, respectively. From eq. (9), p¼5:4, 4.3 and 3.3 mm are estimated forT ¼973, 1023 and 1073 K, respectively, at t¼tm. As mentioned in Section 2, the lengthsAl of the Al melt and thatsFeof the Fe solid specimen are 4.8 and 5 mm, respectively, for the Fe/Al diffusion couple. Since pis close to sAl at t¼tm, the Fe/Al diffusion couple may no longer be a semi-infinite diffusion couple in the late stages of annealing.
As mentioned in Section 1, the reactive diffusion between liquid Al and solid Cu was experimentally observed in a previous study.73) In this experiment, the Cu/Al diffusion couples were isothermally annealed at T¼973{1073K for various times up tot¼2:4103s. Like the Fe/Al diffusion
couple, the lengths of the Al melt and the Cu solid specimen aresAl¼4:8mm andsCu¼5mm, respectively, for the Cu/ Al diffusion couple. During annealing, the,1and"2phases
are produced as uniform layers at the initial Cu/Al interface in the diffusion couple, and the "2/Al interface migrates
towards the Cu specimen. The migration rate of the "2/Al
interface is more than one order of magnitude greater than the overall growth rate of the ,1 and"2 layers. Furthermore,
the migration distance of the "2/Al interface increases in
proportion to the square root of the annealing time. Such a relationship is called the parabolic relationship. Usually, it is believed that the parabolic relationship holds only in a semi-infinite diffusion couple. In the late stages of annealing, however, the penetration distance p of Cu into the Al melt Fig. 9 The mean thicknesslof the intermetallic layer versus the annealing
[image:6.595.63.278.69.282.2]from the Cu specimen exceeds the lengthsAl of the Al melt, and thus the Cu/Al diffusion couple becomes a finite diffusion couple.73) Nevertheless, the parabolic relationship holds even in the late stages at each annealing temperature. Such unexpected migration behavior of the "2/Al interface
was numerically analyzed using a mathematical model in a previous study.87) In this model, the migration rate of the "2/Al interface is determined by the diffusional flux in the
Al melt at the"2/Al interface,88)and the diffusional flux is
proportional to the concentration gradient. Furthermore, D¼1:36109, 2:40109 and 4:00109m2/s
eval-uated at T ¼973, 1023 and 1073 K, respectively, in a previous study80) were adopted for the interdiffusion coef-ficient between Cu and Al in the Al melt. According to the numerical analysis,87) the concentration gradient in the Al melt at the"2/Al interface is mostly equivalent between the
semi-infinite and finite diffusion couples even in the late stages unless p is much greater thansAl. Therefore, almost the same migration rate of the"2/Al interface is realized in
both the semi-infinite and finite diffusion couples. This is the reason why the parabolic relationship holds within the experimental annealing times for the Cu/Al diffusion couple. On the other hand, in the case of the Fe/Al diffusion couple, p¼5:4, 4.3 and 3.3 mm are estimated att¼tmfrom eq. (9) using D¼3:09109,3:82109 and4:63109m2/s
for T¼973, 1023 and 1073 K, respectively, as mentioned earlier. Thus, at each annealing temperature,pis close to but not much greater than sAl¼4:8mm, and D takes similar values for the Al melt between the Cu/Al and Fe/Al diffusion couples. Consequently, the concentration gradient in the Al melt at the FeAl3/Al interface is close to each other
between the semi-infinite and finite diffusion couples even in the late stages. As a result, the Fe/Al diffusion couple is also considered to be effectively a semi-infinite diffusion couple within the experimental annealing times.
The result ofT¼1073K in Fig. 9 is represented as open circles in Fig. 10. In this figure, the corresponding results of T ¼1073K in studies B69)and C71)are also plotted as open triangles and squares, respectively. As mentioned in Section 3.2, the values of lin Fig. 9 were evaluated by eq. (5). On the other hand,lwas estimated by the following equation in studies B and C.
l¼ 1
N XN
i¼1
giþhi
2 ð11Þ
If the shape of the Fe/Fe2Al5interface on the cross-section in
Fig. 4 is a symmetric curve like a sine curve, both eqs. (5) and (11) provide the equivalent value ofl. However, the Fe/ Fe2Al5 interface usually possesses an asymmetric shape. In
such a case, different values oflare obtained from eqs. (5) and (11) even for the identical intermetallic layer. Further-more, at T ¼1073K, the intermetallic layer is irregular in studies B and C but uniform in study A. The preheating temperature Tp is equal to the annealing temperature Ta in study A but lower thanTain studies B and C. However,Tpis not equivalent between studies B and C. As a result, the growth of the intermetallic layer occurs under different heating conditions, and thus the morphology of the inter-metallic layer becomes dissimilar in studies A–C. The interdiffusion across the intermetallic layer takes place in a
simple one-dimensional manner for the uniform morphology but in a complicated three-dimensional manner for the irregular morphology. Hence, the growth behavior of the intermetallic layer varies depending on the interdiffusion manner and thus on the morphology. Nevertheless, in Fig. 10, the values of l for studies A–C are close to one another att¼1:5102{6:0102s.
[image:7.595.319.534.70.283.2]The values of kand kd are plotted against the annealing temperature T as open circles and squares, respectively, in Fig. 11. In this figure, the ordinates on the left-hand and right-hand sides show the logarithms of k and kd, respec-tively, and the abscissa indicates the reciprocal ofT. As can be seen, the open symbols lie well on the corresponding straight line. Therefore, the temperature dependencies of k andkd are expressed as
[image:7.595.311.542.343.545.2]Fig. 10 The result ofT¼1073K in Fig. 9 is represented as open circles with a solid line. The results by Bouche´et al.69)and Bouayadet al.71)are also shown as open triangles with a dotted line and open squares with a dashed line, respectively.
and the growths of the tongue along the perpendicular and parallel directions are merely designated the perpendicular and parallel growths, respectively. Since the coarsening of the polycrystalline microstructure occurs in the intermetallic layer during annealing as mentioned in Section 3.2, a coarsening mechanism similar to Ostwald ripening may contribute to the parallel growth. For simplicity, however, the nomenclator ‘‘growth’’ is used for the parallel direction. The valueQkd¼40:1kJ/mol is relevant to the parallel growth. On the other hand, the interdiffusion for the perpendicular growth is affected by the mass transport for the parallel growth. As a result, the parallel growth as well as the perpendicular growth influences the growth behavior of the intermetallic layer. Such influence is much more remarkable for the irregular morphology atT ¼973{1023K than for the uniform morphology atT ¼1073K. Since the intermetallic layer possesses the polycrystalline microstructure, the growth of the intermetallic layer can be governed by the volume and boundary diffusion in the polycrystalline microstructure. Furthermore, for the irregular morphology at T ¼973{ 1023K, the interface diffusion proceeds along the Fe/Fe2Al5
interface, and hence the perpendicular growth may be controlled by the volume, boundary and interface diffusion. Therefore, the valueQk¼126kJ/mol will be related to this complex diffusion. In such a case, the growth of the inter-metallic layer is not described by any simple mathematical models reported in previous studies.75–84)As a consequence, the rate-controlling process for the growth of the inter-metallic layer cannot be estimated from the value ofQkin a straightforward manner.
In a previous study,83)the kinetics of the reactive diffusion controlled by boundary and volume diffusion was numeri-cally analyzed for a hypothetical binary alloy system consisting of one compound and two primary solid-solution phases using a mathematical model of a semi-infinite diffusion couple. Here, the diffusion couple is initially composed of the two primary solid-solution phases. During isothermal annealing at a certain temperature, a polycrystal-line layer of the compound with a uniform thickness is formed at the initial interface in the diffusion couple due to the reactive diffusion between the primary solid-solution phases. In order to simplify the analysis, the one-dimensional volume and boundary diffusion along the direction perpen-dicular to the interface is treated in this mathematical model. When the growth of the compound layer is purely controlled
in Section 3.2, the intermetallic layer possesses the crystalline microstructure and the coarsening of the poly-crystalline microstructure actually occurs during annealing. However, the intermetallic layer indicates the irregular tongue-like morphology in the whole range of t at T ¼ 973{1023K and in the early stages at T ¼1073K. For the irregular tongue-like morphology, the complex three-dimensional diffusion contributes to the layer growth as previously mentioned. In such a case, the conclusions drawn from the one-dimensional numerical analysis83) cannot be readily applicable to the growth of the intermetallic layer.
4. Conclusions
In order to examine experimentally the morphology of the compounds produced by the reactive diffusion between solid Fe and liquid Al, Fe/Al diffusion couples were prepared by the isothermal bonding technique and then immediately annealed in the temperature range of T ¼973{1073K. In this temperature range, FeAl3, Fe2Al5, FeAl2 and FeAl are
the stable compounds in the binary Fe–Al system.1)During annealing, however, only Fe2Al5 and FeAl3 are formed as
visible layers at the Fe/Al interface in the diffusion couple. The thickness is much smaller for the FeAl3layer than for the
Fe2Al5 layer. Although the FeAl3 layer is rather uniform at
T ¼973{1073K, the Fe2Al5 layer indicates the irregular
tongue-like morphology atT ¼973{1023K but the uniform layer morphology at T ¼1073K. The anisotropy of the interdiffusion coefficient of Fe2Al5 causes the irregularity of
the Fe2Al5 layer. According to the temperature dependence
of the irregularity, we may conclude that the anisotropy is large at T ¼973{1023K but considerably decreases at T ¼1073K. The total thickness of the Fe2Al5 and FeAl3
layers increases in proportion to a power function of the annealing time. The temperature dependence of the propor-tionality coefficient is expressed by an Arrhenius equation. However, the morphology of the Fe2Al5 layer varies
depending on the annealing temperature. Consequently, the activation enthalpy calculated from the Arrhenius equation cannot provide the rate-controlling process for the growth of the Fe2Al5and FeAl3layers.
Acknowledgements
Tokyo Institute of Technology, Japan for stimulating discussions. The present study was supported by a Grant-in-Aid for Scientific Research from the Ministry of Education, Culture, Sports, Science and Technology of Japan.
REFERENCES
1) T. B. Massalski, H. Okamoto, P. R. Subramanian and L. Kacprzak:
Binary Alloy Phase Diagrams, (ASM International, Materials Park, OH, 1990), vol. 1–3.
2) B. Lustman and R. F. Mehl: Trans. Met. Soc. AIME147(1942) 369– 394.
3) D. Horstmann: Stahl. Eisen.73(1953) 659–665.
4) S. Storchheim, J. L. Zambrow and H. H. Hausner: Trans. Met. Soc. AIME200(1954) 269–274.
5) L. S. Castleman and L. L. Seigle: Trans. Met. Soc. AIME209(1957) 1173–1174.
6) L. S. Castleman and L. L. Seigle: Trans. Met. Soc. AIME212(1958) 589–596.
7) N. L. Peterson and R. E. Ogilvie: Trans. Met. Soc. AIME218(1960) 439–443.
8) Y. Adda, M. Beyeler, A. Kirianenko and M. F. Mauruce: Mem. Sci. Rev. Met.58(1961) 716–724.
9) L. S. Birks and R. E. Seebold: J. Nucl. Mater.3(1961) 249–259. 10) R. E. Seebold and L. S. Birks: J. Nucl. Mater.3(1961) 260–266. 11) G. V. Kidson and G. D. Miller: J. Nucl. Mater.12(1964) 61–69. 12) W. E. Sweeney, Jr. and A. P. Batt: J. Nucl. Mater.13(1964) 87–91. 13) K. Shibata, S. Morozumi and S. Koda: J. Japan Inst. Met.30(1966)
382–388.
14) K. Hirano and Y. Ipposhi: J. Japan Inst. Met.32(1968) 815–821. 15) T. Nishizawa and A. Chiba: J. Japan Inst. Met.34(1970) 629–637. 16) Y. Funamizu and K. Watanabe: Trans. JIM12(1971) 147–152. 17) M. M. P. Janssen: Metall. Trans.4(1973) 1623–1633.
18) G. F. Bastin and G. D. Rieck: Metall. Trans.5(1974) 1817–1826. 19) M. Onishi and H. Fujibuchi: Trans. JIM16(1975) 539–547. 20) Y. Iijima, T. Igarashi and K. Hirano: J. Mater. Sci.14(1979) 474–479. 21) D. S. Williams, R. A. Rapp and J. P. Hirth: Metall. Trans. A12A(1981)
639–652.
22) K. Osamura, S. Ochiai, S. Kondo, M. Namatame and M. Nosaki: J. Mater. Sci.21(1986) 1509–1516.
23) E. I.-B. Hannech and C. R. Hall: Mater. Sci. Tech.8(1992) 817–824. 24) K. Bhanumurthy and G. B. Kale: J. Mater. Sci. Lett.12(1993) 1879–
1881.
25) M. Lorenz, D. Bergner and H. Baum: Fresenius J. Anal. Chem.349 (1994) 253–254.
26) P. T. Vianco, P. F. Hlava and A. L. Kilgo: J. Electron. Mater.23(1994) 583–594.
27) V. I. Dybkov and O. V. Duchenko: J. Alloy. Compd.234(1996) 295– 300.
28) M. Watanabe, Z. Horita and M. Nemoto: Int. Sci.4(1997) 229–241. 29) P. C. Tortorici and M. A. Dayananda: Metall. Mater. Trans. A30A
(1999) 545–550.
30) S. Choi, T. R. Bieler, J. P. Lucas and K. N. Subramanian: J. Electron. Mater.28(1999) 1209–1215.
31) O. V. Duchenko, V. M. Vereshchaka and V. I. Dybkov: J. Alloy. Compd.288(1999) 164–169.
32) M. J. H. van Dal, D. G. G. M. Huibers, A. A. Kodentsov and F. J. J. van Loo: Intermetallics9(2001) 409–421.
33) C. Milanese, V. Buscaglia, F. Maglia and U. Anselmi-Tamburini: Acta Mater.50(2002) 1393–1403.
34) O. Taguchi, G. P. Tiwari and Y. Iijima: Mater. Trans.44(2003) 83–88. 35) A. Paul, A. A. Kodentsov, G. de With and F. J. J. van Loo:
Intermetallics11(2003) 1195–1203.
36) B. Tryon, Q. Feng and T. Pollock: Intermetallics12(2004) 957–962. 37) M. Kajihara, T. Yamada, K. Miura, N. Kurokawa and K. Sakamoto:
Netsushori43(2003) 297–298.
38) T. Yamada, K. Miura, M. Kajihara, N. Kurokawa and K. Sakamoto: J. Mater. Sci.39(2004) 2327–2334.
39) T. Yamada, K. Miura, M. Kajihara, N. Kurokawa and K. Sakamoto: Mater. Sci. Eng. A390(2005) 118–126.
40) M. Kajihara and T. Takenaka: Mater. Sci. Forum 539–543(2007) 2473–2478.
41) T. Takenaka, M. Kajihara, N. Kurokawa and K. Sakamoto: Mater. Sci. Eng. A406(2005) 134–141.
42) T. Takenaka, S. Kano, M. Kajihara, N. Kurokawa and K. Sakamoto: Mater. Sci. Eng. A396(2005) 115–123.
43) K. Suzuki, S. Kano, M. Kajihara, N. Kurokawa and K. Sakamoto: Mater. Trans.46(2005) 969–973.
44) T. Takenaka, S. Kano, M. Kajihara, N. Kurokawa and K. Sakamoto: Mater. Trans.46(2005) 1825–1832.
45) M. Mita, M. Kajihara, N. Kurokawa and K. Sakamoto: Mater. Sci. Eng. A403(2005) 269–275.
46) Y. Muranishi and M. Kajihara: Mater. Sci. Eng. A404(2005) 33–41. 47) M. Mita, K. Miura, T. Takenaka, M. Kajihara, N. Kurokawa and K.
Sakamoto: Mater. Sci. Eng. B126(2006) 37–43.
48) Y. Yato and M. Kajihara: Mater. Trans.47(2006) 2277–2284. 49) T. Takenaka, M. Kajihara, N. Kurokawa and K. Sakamoto: Mater. Sci.
Eng. A427(2006) 210–222.
50) Y. Yato and M. Kajihara: Mater. Sci. Eng. A428(2006) 276–283. 51) T. Hayase and M. Kajihara: Mater. Sci. Eng. A433(2006) 83–89. 52) A. Furuto and M. Kajihara: Mater. Sci. Eng. A445–446(2006) 604–
610.
53) D. Naoi and M. Kajihara: Mater. Sci. Eng. A459(2007) 375–382. 54) S. Sasaki and M. Kajihara: Mater. Trans.48(2007) 2642–2649. 55) K. Mikami and M. Kajihara: J. Mater. Sci.42(2007) 8178–8188. 56) T. Sakama and M. Kajihara: J. Alloy. Compd.475(2009) 608–613. 57) M. Yamakami and M. Kajihara: Mater. Trans.50(2009) 130–137. 58) T. Sakama and M. Kajihara: Mater. Trans.50(2009) 266–274. 59) S. Tanaka and M. Kajihara: J. Alloy. Compd. (2009), doi: 10.1016/
j.jallcom.2009.04.077, in press.
60) M. Kajihara and Y. Tejima: J. Phys. Conf. Sers.165(2009) 012091, 1–4. 61) K. Masui and M. Kajihara: J. Alloy. Compd. (2009), doi: 10.1016/
j.jallcom.2009.05.100, in press.
62) E. Gebhardt and W. Obrowski: Z. Metallkde.44(1953) 154–160. 63) G. Gu¨rtler and K. Sagel: Z. Metallkde.46(1955) 738–741. 64) T. Heumann and S. Dittrich: Z. Metallkde.50(1959) 617–625. 65) S. G. Denner and R. D. Jones: Metals Tech.4(1977) 167–174. 66) V. N. Yeremenko, Y. V. Natanzon and V. I. Dybkov: J. Mater. Sci.16
(1981) 1748–1756.
67) G. Eggeler, W. Auer and H. Kaesche: Z. Metallkde.77(1986) 239– 244.
68) V. I. Dybkov: J. Mater. Sci.25(1990) 3615–3633.
69) K. Bouche´, F. Barbier and A. Coulet: Mater. Sci. Eng. A249(1998) 167–175.
70) S. Kobayashi and T. Yakou: Mater. Sci. Eng. A338(2002) 44–53. 71) A. Bouayad, Ch. Gerometta, A. Belkebir and A. Ambari: Mater. Sci.
Eng. A363(2003) 53–61.
72) S. Nishimoto, S. Kobayashi, N. Takada, T. Matsuo and M. Takeyama: Collected Abstracts of 2008 Autumn Meeting of the Japan Inst. Metals, (2008) p. 82.
73) Y. Tanaka, M. Kajihara and Y. Watanabe: Mater. Sci. Eng. A445–446 (2006) 355–363.
74) A. Griger, V. Stefa´niay and T. Turmezey: Z. Metallkde.77(1986) 30– 35.
75) M. Kajihara: Acta Mater.52(2004) 1193–1200. 76) M. Kajihara: Mater. Sci. Eng. A403(2005) 234–240. 77) M. Kajihara: Mater. Trans.46(2005) 2142–2149. 78) M. Kajihara: Diffus. Defect Forum249(2006) 91–96. 79) M. Kajihara: Mater. Trans.47(2006) 1480–1484.
80) Y. Tanaka and M. Kajihara: Mater. Trans.47(2006) 2480–2488. 81) M. Kajihara and T. Yamashina: J. Mater. Sci.42(2007) 2432–2442. 82) M. Kajihara: Mater. Trans.49(2008) 715–722.
83) A. Furuto and M. Kajihara: Mater. Trans.49(2008) 294–303. 84) M. Kajihara: J. Mater. Sci.44(2009) 2109–2118.
85) J. S. Kirkaldy and D. J. Young: Diffusion in the Condensed State, (Inst. Metals, London, 1987) p. 150.
86) Y. Du, Y. A. Chang, B. Huang, W. Gong, Z. Jin, H. Xu, Z. Yuan, Y. Liu, Y. He and F. Y. Xie: Mater. Sci. Eng. A363(2003) 140–151. 87) Y. Tanaka and M. Kajihara: Mater. Sci. Eng. A459(2007) 101–110. 88) W. Jost: Diffusion of Solids, Liquids, Gases, (Academic Press, New