Softening and Microstructural Coarsening without Twin Formation in FCC Metals
with Low Stacking Fault Energy after Processing by High-Pressure Torsion
Hirotaka Matsunaga and Zenji Horita
Department of Materials Science and Engineering, Faculty of Engineering, Kyushu University, Fukuoka 819-0395, Japan
Gold (Au), silver (Ag) and copper (Cu) were severely deformed through the process of high pressure torsion (HPT). The grain sizes were reduced to the submicrometer range and the hardness increased significantly by the HPT process. However, after holding at room temperature, Au and Ag exhibited grain growth and thus softening without heating. The softening and microstrcutural coarsening occurred rather quickly in Ag and moderately in Au but nothing changed in Cu even after keeping for prolonged time. No twins were formed along with the grain growth in the HPT-processed Au and Ag. High density lattice defects and enhanced diffusivity in the metals are responsible for such an unusual softening behavior. [doi:10.2320/matertrans.MF200921]
(Received January 26, 2009; Accepted April 27, 2009; Published June 25, 2009)
Keywords: severe plastic deformation, high pressure torsion, gold, silver, copper, grain growth, twin, stacking fault energy
1. Introduction
It is well known that gold (Au), silver (Ag) and copper (Cu) are all based on the face centered cubic (fcc) structure. They are easily deformed to a large extent by rolling, extrusion, drawing so that they can be used in various shapes and design. They have almost similar melting points as 1337, 1235, and 1356 K for Au, Ag and Cu, respectively. The room temperature of the metals then corresponds to 0.224, 0.243, and 0.221 when normalized by each of the melting points. These temperatures are generally too low for the annealing and softening to occur because the atomic diffusion at such normalized temperatures is very slow. There have been technical reports that high purity Ag is softened during long time storage at room temperature and becomes very susceptible to surface scratching even after hardening by straining.1) Recent study reported2) that softening of Ag
occurs after storage at room temperature following heavy deformation by equal-channel angular pressing (ECAP), which is known as a process of severe plastic deformation (SPD) for microstructural refinement.3)
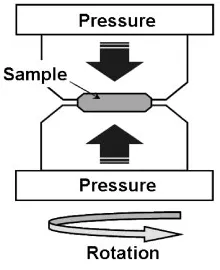
In this study, the three fcc metals, Au, Ag and Cu, are deformed by the SPD process to compare each of the softening behavior after processing. The process of high pressure torsion (HPT) as illustrated in Fig. 14)is used in this study, which is known as a typical SPD process3)and it can produce much greater strain than the ECAP process.5,6)Thus,
this study aims to conduct a systematic investigation for the effect of imposed strain on the variation of mechanical properties and microstructure with respect to time after processing the three fcc metals with HPT.
2. Experimental Procedures
Rods of high purity Au (99.999%), Ag (99.99%) and Cu (99.99%) with 10 mm diameter were sliced to disks with 0.8 mm thickness. They were annealed at 873, 803 and 884 K for 1 h, respectively, where all temperatures correspond to 0.65 of the melting points. The average grain sizes after
the annealing were 100mm for Au and Cu and 60mm
for Ag.
HPT was conducted by placing a disk in a shallow hole of the upper and lower anvils and were rotated with respect to each other at room temperature at a rotation speed of 1 rpm under an applied pressure of 6 GPa. The rotation was terminated after 5 revolutions.
The disks after HPT including those before HPT were polished to mirror-like surfaces and the Vickers micro-hardness was measured along the radii from the center to edge at 6 different radial directions. The average was taken from the 6 measurements at the same distance from the center of each disk. Hardness measurement was undertaken with an application of 50 g for 15 s in Au and Cu and of 25 g for 15 s in Ag using an Akashi MVK-E3 testing machine.
The polished samples were etched for optical microscopy. Electron backscatter diffraction (EBSD) analysis was con-ducted using a Hitachi S-4300SE scanning electron micro-scope equipped with a field emission gun at an accelerating voltage of 20 kV. Data acquisition and subsequent analysis were performed using a TSL orientation image microscopy software (v.3.5). A cleaning-up procedure was applied to all EBSD images to adjust points with confidence index (CI) lower than 0.1. Misorientations less than 2 were excluded from the analysis because of the limitations of the angular resolution of the EBSD technique.7)
Transmission electron microscopy (TEM) was also con-ducted for Ag after processing with HPT. Disks with 3 mm in diameter were punched out from outer edge regions of the
Fig. 1 Schematic illustration of HPT. Special Issue on New Functions and Properties of Engineering Materials Created by Designing and Processing
[image:1.595.372.482.301.436.2]HPT disks. The disks for TEM were ground mechanically to a thickness of 0.1 mm and further thinned with a twin-jet electro-chemical polisher in a solution of CH3
COOH-(115 ml)-H2SO4(43 ml)-CH3OH(350 ml)-CH4N2S (77 g). A
Hitachi H-8100 transmission electron microscope was operated at 200 kV. Selected area electron diffraction (SAED) patterns were taken using an aperture size of 6.3mm.
3. Results
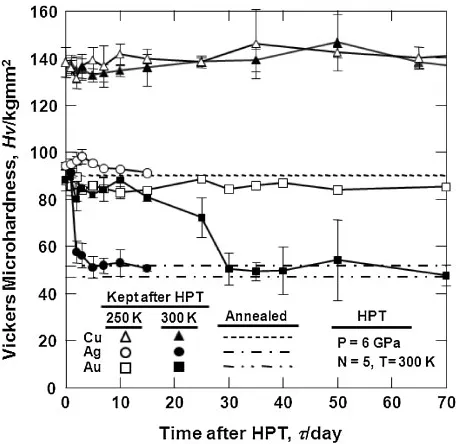
Figure 2 shows variations of Vickers microhardness with respect to the time after processing by HPT. The closed and open symbols represent the variations with time when the HPT samples are kept at room temperature (300 K) and in a freezer at 250 K, respectively. Note that the hardness values in Fig. 2 are plotted from recording at positions 3 mm away from the center of the disk. It is apparent that, when the HPT samples are kept at room temperature, the hardness begins to decrease after1:5days for Ag and25days for Au but the hardness remains unchanged in Cu even after keeping for 70 days. (This study confirmed that the Cu hardness did not change even after 130 days.) However, no change in hardness occurs in all HPT samples when they are kept at 250 K.
Figure 3 plots the time before the hardness decrease with respect to the equivalent strain. Here, the time to the hardness decrease is taken when the hardness of Ag and Au is decreased by 90% of the hardness sooner after HPT processing, 90%(Hv)o. The equivalent strain"is calculated
through the following equation8)
"¼ ðr=tÞ=pffiffiffi3 ð1Þ
whereris the distance from the disk center,is the rotation angle in radian andtis the thickness of the disk. The hardness decreases more easily as the strain is imposed, although the decrease occurs much faster in Ag than Au. These results
indicate that strain energy should be a driving force for the decrease in the hardness.
An optical micrograph and an orientation image before HPT for Ag are shown in Figs. 4(a) and (b), respectively, and those for Au are shown in Figs. 5(a) and (b). The micro-strutures of both metals are typical of annealed samples with well defined grain boundaries and twin boundaries which are often observed in metals having high stacking fault energies. The average grain sizes without twins are60mmfor Ag and 100mmfor Au.
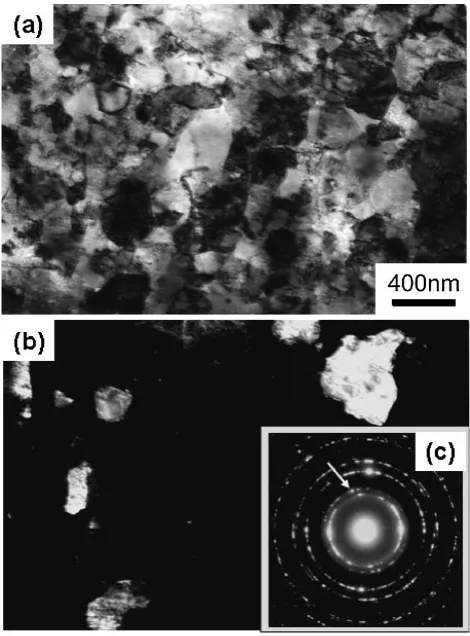
TEM micrographs after HPT processing but before the hardness decrease are shown in Fig. 6 where (a) is a bright field image, (b) a dark field image and (c) an SAED pattern. The microstructure consists of grains with the average size of 480nm. Individual grains seem separated by high-angle boundaries because diffracted beams form rings in the SAED pattern. There are some grains containing few dislocations despite the fact that the large strain was introduced through the HPT process. Microstructural observation for Au after HPT but before the decrease in hardness was performed using EBSD analysis and the results are shown in Fig. 7. Note that the dark regions appeared because of the difficulty in determining the crystal orientation due to the presence of intense strain. Nevertheless, large regions still appears with colors and this EBSD analysis revealed that the micro-structure consists of grains with the average grain size of 520nm and with different orientations as indicated by the difference in colors.
Optical micrographs and orientation images well after the decrease in hardness are shown in Figs. 8(a) and (b) for Ag, respectively, and Figs. 9(a) and (b) for Au, respectively. Note that the micrographs and EBSD images are after 15 days for Ag and 70 days for Au. It is apparent that grain growth occurred and microstructure are very similar to the ones after annealing but before HPT with the average grain sizes of 100mmfor both Ag and Au. However, there is a significant difference from the former. That is the absence of the twins: twins are not visible after prolonged holding at room temperature.
Fig. 2 Variations of Vickers microhardness with time after processing of Au, Ag and Cu by HPT at 6 GPa for 5 revolutions. Open and closed symbols represent samples kept at freezer (250 K) and room temperature (300 K), respectively. Hardness levels in annealed conditions are indicated by three different dotted lines.
[image:2.595.54.286.71.293.2] [image:2.595.322.528.73.257.2]4. Discussion
It is most likely that HPT can produce an enormous number of lattice defects and thus introduces significant enhancement of atomic diffusion. Let us then first estimate Fig. 5 (a) Optical micrograph and (b) orientation image after annealing but
before HPT for Au, showing well defined grain boundaries and twin boundaries.
Fig. 6 TEM micrographs of Ag after HPT but before hardness decrease: (a) bright field image, (b) dark field image and (c) selected area electron diffraction (SAED) pattern.
Fig. 4 (a) Optical micrograph and (b) orientation image after annealing but before HPT for Ag, showing well defined grain boundaries and twin boundaries.
Fig. 7 Orientation image of Au after HPT but before hardness decrease.
Fig. 8 (a) Optical micrograph and (b) orientation image after HPT and after hardness decrease for Ag, showing well defined grain boundaries but no twin boundaries.
[image:3.595.333.519.72.324.2] [image:3.595.56.286.72.190.2] [image:3.595.53.285.250.371.2] [image:3.595.311.541.359.487.2] [image:3.595.51.286.431.749.2] [image:3.595.313.542.544.669.2]the diffusion distance through a relation ofLðDÞ1=2using the lattice self diffusion coefficients in the three metals,9)
D¼DoexpðQ=RTÞ
whereDois0:26105,0:41105and3:5105m2s1
for Au, Ag and Cu, respectively, and Q is 166.9, 169.8 and 203.6 kJmol1 for Au, Ag and Cu, respectively,10) Ris
the gas constant andT is the absolute temperature in Kelvin. Therefore, it follows that the diffusion distances at 300 K are L6:98106nm after 25 days in Au and L1:20
106nm after 1.5 days in Ag where the hardness begins to
decrease, andL3:73108nm after 130 days in Cu where
no change in hardness occurs but it is the total holding time in the present experiment. However, any of the calculated diffusion distances are significantly small and they are even much smaller than the lattice parameters.
Because of the introduction of high density lattice defects, the atomic diffusion may occur through lattice defects such as dislocations and grain boundaries. It is generally considered that the activation energy may be reduced to two thirds to half when such lattice defects contribute to the diffusion. Estimation of the diffusion distance using Q/2 instead of Q leads to L130nm after 25 days in Au andL30nm after 1.5 days in Ag for the beginning of the hardness decrease. These diffusion distances are now closer to the grain sizes of 500nm after HPT, but they are still much smaller than the grain sizes of 100mm after complete grain growth. The estimation gives rise to 220 nm and 90 nm after holding for 70 days and 15 days for Au and Ag, respectively, where the grain growth has completed.
Using Q/3 which can be equivalent to the surface
diffusion, the diffusion distances now become L35mm
andL9mmfor Au and Ag, respectively, at the beginning of the hardness decrease, and L60mm and L30mmfor the level after grain growth. These diffusion distances are comparable to the grain sizes shown in Fig. 8 and Fig. 9. For the samples stored at 250 K, estimation of the diffusion distances leads toL4mmandL0:9mmwhich are still well smaller than for the storage at room temperature and these diffusion distances are small enough to keep the hardness at the higher levels. It is then reasonable that the grain growth and the subsequent decrease in hardness should be attributed to the enhanced diffusion with the activation energy equivalent to1=3of the lattice diffusion.
In addition to the enhanced diffusivity, it is important to consider the effect of stacking fault energy (SFE) on the grain growth during storage at room temperature. All of Au, Ag and Cu are based on the fcc structure and the SFE of Ag is the lowest and Cu is the highest and Au is between them. The SFEs are 16, 32 and 45 mJ/m2 for Ag, Au and Cu,
respectively.11) It is generally accepted that, if the SFE is
small, more dislocations are accumulated because of lower rates of dislocation annihilation and recovery. It is considered that the largest population of lattice defects is available in Ag, which then facilitates the grain growth not only by the enhancement of driving force but also of atomic diffusion through the lattice defects.
A final important question arises why no twins form despite the fact the grain growth occurs. It is a general phenomenon that many twins form after annealing especially
for the metals and alloys with low SFEs such as Ag, Au and Cu but it is hardly the case for metals with high SFEs as Al. It was said that the twin formation was accompanied by grain growth or grain boundary migration.12) However, as it is
evident, this does not account for the present case because the grain growth occurred to almost the same grain size as the one before HPT. It was suggested that the temperature dependence of twin formation is weak or the twin density is higher at lower temperature.13)However, any of them is an
opposite trend observed in this study. Although the mech-anism for the formation of annealing twins is not clearly understood,14) it is reasonable that the formation of twins occurs as a consequence of local strain adjustment and energy minimization required during recrystalization and grain growth. In this study, construction of pole figures was attempted from the EBSD orientation images shown in Fig. 8(b) and Fig. 9(b) and it was found that a strong cube texture developed along with the grain growth. It is considered that the texture development results in the local strain adjustment and energy minimization as expected from twin formation. Thus, the twin formation was little required for this study because a strong texture developed. Further investigation is now in progress for clarifying the absence of annealing twins in metals with low SFEs. It is important to note that the investigation for the absence of annealing twins will provide opportunity for understanding the mechanism of the formation of annealing twins.
5. Conclusions
(1) When Ag and Au are processed by HPT, they exhibit softening and microstructural coarsening during storage at room temperature. Such changes occur rather quickly in Ag and moderately in Au and they are more pronounced with intense straining in both metals. However, nothing changes in Cu even after keeping for prolonged time.
(2) Unlike a normal annealing process, no twins form despite the microstructural coarsening in the HPT-processed Ag and Au. High density lattice defects in metals with low stacking fault energies should be responsible for such an unusual softening and coarsen-ing behavior.
Acknowledgements
We would like to thank Mr. K. Kimura and Mr. K. Tatsumi of Nippon Steel Corporation for providing the high purity Au and Ag samples. This work was supported in part by a Grant-in-Aid for Scientific Research from the Ministry of Education, Culture, Sports, Science and Technology, Japan, in Priority Areas ‘‘Giant Straining Process for Advanced Materials Containing Ultra-High Density Lattice Defects’’ and in part by Kyushu University Interdisciplinary Programs in Education and Projects in Research Development (P&P).
REFERENCES
html/index.html
2) J. Gubicza, N. Q. Chinh, J. L. Labar, Z. Hegedus, P. Szommer, G. Tichy and T. G. Langdon: J. Mater. Sci.43(2008) 5672.
3) R. Z. Valiev, Y. Estrin, Z. Horita, T. G. Langdon, M. J. Zehetbauer and Y. T. Zhu: JOM58(2006) 33.
4) P. W. Bridgman: Studies in Large Plastic Flow and Fracture, (McGraw-Hill, New York, NY 1952).
5) R. Z. Valiev, R. K. Islamgaliev and I. V. Alexandrov: Prog. Mater. Sci. 45(2000) 103.
6) A. P. Zhilyaev and T. G. Langdon: Prog. Mater. Sci.53(2008) 893. 7) F. J. Humphreys: Scr. Mater.51(2004) 771.
8) F. Wetscher, A. Vorhauer, R. Stock and R. Pippan: Mater. Sci. Eng. A387–A389(2004) 809.
9) P. G. Shewmon: Diffision in Solids, (McGraw-Hill, New York, NY, 1963).
10) H. Mehrer: Numerical Data and Functional Relationships in Science and Technology, Vol. 26, Diffusion in Solid Metals and Alloys, (Springer-Verleg, Berlin, 1990).
11) J. P. Hirth and J. Lothe: Theory of Dislocations, (McGraw-Hill, New York, NY, 1968).
12) S. Mahajan, C. S. Pande, M. A. Imam and B. B. Rath: Acta Mater.45 (1997) 2633.
13) C. S. Pande, M. A. Imam and B. B. Rath: Metall. Trans. A21A(1990) 2891.