(Received February 10, 2009; Accepted April 3, 2009; Published June 25, 2009)
Keywords: three dimensional x-ray diffraction (3DXRD), kinetics, recrystallization, boundary migration
1. Introduction
Characterization of materials microstructures is a key element when the aim is to understand materials processing and properties. ‘‘Quantum leaps’’ in the understanding of the fundamentals of microstructure evolution have generally followed the development of new major characterization techniques. The best example of this is electron microscopy which still by far is the most powerful microstructural characterization technique material scientists have at hand. A limitation of electron microscopy is however the penetration power of the electrons which limits the technique to 2 (or 2.5) D characterization. This also means that for bulk microstructures, electron microscopy can be used only for static characterizations at discrete processing intervals (i.e. post mortem analysis) and not forin-situcharacterization of the dynamics of the 3D microstructural development.
3D X-ray diffraction (3DXRD) microscopy offers the possibility of time resolved three dimensional mapping of microstructures to the micrometer scale.1–4)
In the measuring and reconstructing 3D images by 3DXRD, some principles inspired by tomography measure-ments are used. The two methods, 3DXRD and tomography, are, however, quite different and can often be used to complement each other. This shall be described and discussed in this review paper.
3DXRD has been used for studies of a range of scientific themes most of which are shown schematically in Fig. 1. Of special interest for the authors of this paper have beenin-situ
3DXRD studies of recrystallization of deformed metals. Here we will present a new analysis of growth rates determined from an investigation filming a grain growing inside a deformed aluminum single crystal.3) These new results as
well as earlier results give input for understanding of boundary migration which shall be discussed.
2. 3DXRD
The 3DXRD concept is based on measuring local crystallographic orientations and thereby generating a map of the microstructure. To ensure high penetration depth e.g. 5 mm in steel and 4 cm in Al, high energy (50–100 keV)
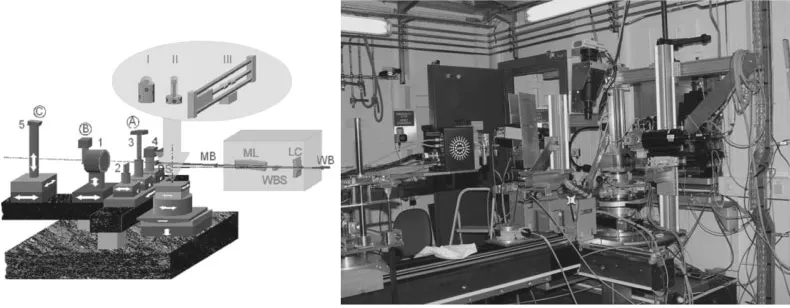
X-rays are used. A sketch and a photo of the set-up is shown in Fig. 2. The beam is penetrating the entire sample so with one setting of the sample, diffraction occurs from all cells/ subgrains/grains etc. inside the illuminated gauge volume which fulfill the Bragg condition. The diffracted signals are recorded on one or more 2D detectors behind the sample (see Fig. 2). To probe the complete sample structure within the gauge volume, the sample is rotated ! around an axis perpendicular to the incoming beam. At present the mapping precision is about 5mm5mm1mm, while microstruc-tural elements down to 70 nm can be detected provided that they have a sufficient crystallographic orientation difference to avoid overlap with major diffraction spots on the detector. The angular resolution is 0.05 degrees.
The aim of 3DXRD is not only to get 3D orientation resolved pictures of the microstructure but to be able to do the measurements so fast that kinetics can be followed in-situ. Our first concept for the 3DXRD microscope was based on a cross beam technique where slits defined the incoming and recorded diffracted signals. Each measurement thus gave information about a small 3D defined gauge volume inside the sample. To get a picture of the whole sample, the sample should be translated relative to the beams. This method is simple but slow—generally too slow to be used forin-situ
measurements.
[image:1.595.307.548.309.442.2]Thus presently the 3DXRD concept relies on recording the whole sample thickness in one go. This means that typically many more cells/subgrains/grains etc. contribute to the dif-fracted signals recorded by the detectors and lots of diffrac-tion spots are thus observed. By using advanced in-house developed software the diffraction spots can be identified and each diffracting grain indexed (i.e. its crystallographic orientation is calculated). To get a 3D map of the grains with their exact shapes, tomography principles are used. This is possible because also in diffraction, the recorded signal for a selected grain gives a footprint of the shape of the grain. By combining several (typically more than 10) footprints of the grain its 3D shape is determined. This reconstruction method is thus very similar to that of tomography, only it is more complicated as diffraction spots of course only occurs at a limited number of diffraction angles (given by the orientation of the grain) whereas absorption based tomography gives a footprint image for each!position.
The 3DXRD methodology can at present be tailored to provide dynamic data on a hierarchy of levels. The simplest approach is to measure the diffracted intensity from selected, structural elements as function of time; this provides the volume kinetics of individual elements with a time resolution of seconds or even subseconds. On the highest level, full shape change information can be acquired by repeating the acquisition of microstructure maps.
Sample auxiliaries include a series of furnaces, which operates up to 1500C, and a 25 kN Instron tensile machine.
For further information on the 3DXRD method, the best reference is Ref. 2).
Traditionally, grain maps have been reconstructed from data collected on a high resolution detector positioned close to the sample (near field detector). By introducing a second near field detector positioned slightly further away from the sample the quality of the grain maps are improved. This is especially the case for deformed samples where the diffracted rays diverge. By having intensity distributions at two distances the ability to determine the correct divergence is enhanced considerably. Such a detector is currently under construction at Risø-DTU and is expected to be commis-sioned at beamline ID-11 in spring 2009.
3. Comparison with Other 3D Methods
The classical way to obtain 3D data from opaque samples is by serial sectioning. Recently, this classic method has been revived to ease the required hard manual work. Prominent among the new automated methods are focused ion beaming in dual beam scanning electron microscopes. An overview of these new methods is given in a Scripta Materialia viewpoint set.5) Although much improved the new serial sectioning methods can by nature only provide 3D data by destroying the sample and thus in-situ kinetics studies are impossible. For kinetics studies, x-rays—in particular x-rays from synchrotron sources, are ideal to use. Broadly speaking 2 classes of x-ray methods exist for mapping materials micro-structures—imaging by tomography methods and diffraction to give crystallographic orientation contrast (e.g. 3DXRD).
In this paper focus is on 3DXRD. Besides the 3DXRD facility at ESRF other equipments exist elsewhere. At the Advanced Photon Source (APS) at Argonne National Laboratory a 3DXRD instrument optimized for high angular resolution is in operation e.g. Ref. 6).
Another instrument called a three-dimensional crystal microscope is also in operation at the APS.7,8) This instru-ment is, however, significantly different from the 3DXRD microscope: it operates at lower X-ray energies; applies polychromatic microbeams; and performs scanning to get three-dimensional information. This means that the APS three-dimensional crystal microscope has better spatial resolution but shorter penetration depths and much worse time resolution than the 3DXRD microscope at ESRF.
At HASYLAB in Hamburg, Bunge and coworkers9–11)
have developed a ‘sweeping detector’ technique that allows spatially resolved measurements of textures of materials with high orientation resolution. This technique is unique for textural information but does not at present allow three-dimensional mapping of microstructures.
A very interesting possibility is to combine 3DXRD with tomography. A dream experiment could be to measure local strains by recording movements of particles by high resolution tomography12) and local changes in crystallo-graphic orientations by 3DXRD. It would thus be possible to
[image:2.595.99.494.74.228.2]directly correlate strain and slip locally in individual grains inside polycrystals and thus getting experimental data to test deformation models.
4. Growth of Grains During Recrystallization
3DXRD is an ideal technique to follow growth in-situ
during recrystallization. Several papers have been published on the recrystallization kinetics of individual grains e.g. Ref. 13) and one paper has been published on directly filming the growth of a single grain during its growth.3) The
following analysis is based on this latter result. So first a short resume of the experiment shall be given.
The idea of the experiment was to study growthin-situin a slightly deformed single crystal in which nucleation was artificially stimulated by a surface hardness indents. This is the same experiment Beck and others did in the 1950– 60’ies14–17) but whereas experimental limitations only allowed Beck and others to look at static pictures (post mortem) of the microstructure after growth, 3DXRD allows direct filming of the growth. The single crystal in the 3DXRD experiment was Al of thef110gh001iorientation cold-rolled to 42% reduction in thickness.3) The rolling introduces
a fairly homogeneous deformation microstructure with a maximum of about 7 misorientation across deformation
induced dislocation boundaries. The growth of af2144gh22011i
oriented grain in this matrix has been filmed by 3DXRD. A storyboard is shown in Fig. 3. The main phenomena observed from the film are:
(1) The boundary migration does generally not occur at a constant rate
(2) Facets may form
(3) Local protrusions are often seen
Phenomenon 1 above has in the present work been analyzed in detail with the aim of determining growth rates versus time curves along different directions for the growing grain. For this purpose specific 2D sections within the 3D grain (see Fig. 4) are selected and the size of the grain along the macroscopic axis RD, TD and ND as well as along the crystallographic directions 100, 010 and 011 are measured. It is important to notice that when doing these measurements, it is the motion of one specific grain boundary segment which is analyzed when measuring along one direction (e.g. RD). A neighboring boundary segment may well have a quite different motion profile. Similarly for measurements along TD ND etc. The results of the measurements along RD TD
Fig. 3 Storyboard from a film showing the growth of a grain within a 42% deformed Al single crystal off110gh001iorientation.3)
(A) (B) (C)
[image:3.595.155.443.70.304.2] [image:3.595.85.515.345.453.2]and ND are shown in Fig. 5. The figure clearly reveals that migrations of the grain boundaries generally do not occur smoothly at a constant rate, instead a given boundary segment may be immobile for a while, and then moves forward rapidly for tens of micrometers, stop, migrate again etc. On average, however, growth along RD is faster with an average rate of 23.4mm/h at 280C whereas growth along
TD and ND is slower on an average at 4.8 and 4.9mm/h at 280C.
For growth along TD the rate increases from 4.8mm/h at 280C to 10.9mm/h at 290C. These two values can be used to calculate the activation energyQ
lnV1
V2
¼ Q
R
1
T1
1
T2
Where Ris the gas constant. Q¼212kJ/mol is the result. Considering the magnitude of the steps on the growth curves (see Fig. 5), this value is surprisingly close to literature values of 172–217 kJ/mol.18,19)
As the deformed matrix is fairly homogeneous neither large changes in misorientation between the growing grain and the matrix or big changes in driving force can be the reason for the observed stop-go type boundary migration. This result is substantiated by very recent EBSP observations of deformed Ni.20)Impurities could be of importance and so could the plane of the grain boundary. One may, however, also speculate that the boundary migration process during recrystallization may be a quite complex process involving local incorporation of dislocations and dislocation walls into the moving boundary segment. This could well include local reorientations of the microstructure in front of the boundary as observed earlier by TEM.21,22)This may require time to
occur and thus boundary migration may occur in steps. Altogether a much more complex process than single atom diffusion across a boundary (whereby the boundary moves) which is generally considered for grain growth and for simplicity often adapted to recrystallization.
Phenomenon 2 above—facets—has been analyzed using a method suggested by Rowenhorst et al.23)for 3D crystallo-graphic and morphological analysis of coarse martensite. The method has shown also to be useful for analysis of the
in-situ3DXRD data of recrystallizing grains.24)
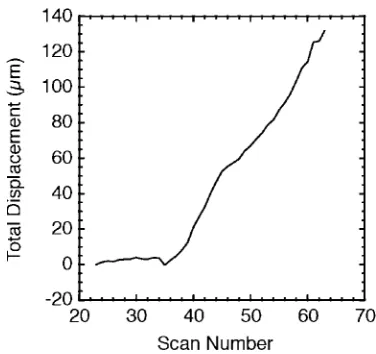
For the investigated grain, 7 facets have been identified, which can be seen in Fig. 6. Some of these facets are artefacts given by the selected limits of the sampled gauge volume in the 3DXRD measurements and the sample surface. Only migration of facet #1 can be analyzed further here. This facet exists and extends in size as the grain is growing. Facet #1 shows up around scan 20 and remains until scan 64 after which facet #2 (see Fig. 4) takes over (moving faster) and parts of facet #1 seem to reorient into facet #2. However, during the scans 20–64 the displacement perpendicular to the facet plane can be determined. The result is shown in Fig. 7. It can be seen that during the low temperature anneal the facet hardly moves, but after the temperature is increased to 290C it moves at a fairly
constant rate of about 12mm/h. This is comparable to the average migration rate of a ‘‘normal’’ grain boundary segment along TD. It is, however, remarkable, that the ‘‘normal’’ grain boundary segment migrates in steps (see Fig. 5) whereas the facet moves much more homogene-ously. A reason for this difference could relate to the fact that the facet represents a well-ordered grain boundary,
Fig. 5 Growth curves along RD, TD and ND measured as described in Fig. 4. The vertical lines indicate the transitions from one annealing temperature to the next.
Fig. 6 Facets on the boundary of the recrystallizing grain (see also in Fig. 3).24)
[image:4.595.307.545.70.249.2] [image:4.595.54.282.73.216.2] [image:4.595.331.519.305.482.2]moved further forward than the neighboring parts of the boundary. Also depressions, boundary segments being held back locally for a certain time, are seen. A likely explanation for development of protrusions/depressions is local varia-tions in the driving force (i.e. stored energy) in the deformed matrix in front of the boundary surrounding the recrystall-izing grain.
Three modeling approaches have been suggested to simulate boundary migration with small scale local varia-tions in driving force.25–28) A driving force simply varying
sinodally has been applied to a flat boundary leading to evolution of protrusions on the migrating boundary.25)Also
a phase field approach has been used to simulate boundary migration during recrystallization.26) A series of typical dislocation networks are assumed and in some of the cases clear protrutions are observed. It is, however, also found that protrusions sometimes shrink back if the driving force is locally exhausted at the interphase.26) More atomistic insight can be obtained by MD simulations. A first series of such MD simulations has been carried out for a system with a regular arrangement of dislocations in linear dis-location walls perpendicular to a high angle boundary surrounding a recrystallizing grain using different poten-tials.27,28) Also in these simulations it is observed that
protrusions can develop locally. A second series of MD simulations reveal that the actual dislocation arrangement and type have a strong effect on weather protrusions develop or not.28)
5. Conclusions
3DXRD has proven to be a powerful tool in many fields of Materials Science. It allows measurements of microstructural processes which before could only be analyzed theoretically and it has shown that well accepted knowledge in several cases cannot explain the experimental observations.
Boundary migration during recrystallization has been filmed. Three characteristics are observed namely that the migration generally not occur at a constant rate but in steps, facets may form and local protrusions/depressions are often seen. The local deformation structure in front of
1) H. F. Poulsen, S. Garbe, T. Lorentzen, D. Juul Jensen, F. W. Poulsen, N. H. Andersen, T. Frello, R. Feidenhansl and H. Graafsma: J. Synchr. Radiation4(1997) 147.
2) H. F. Poulsen: Three-Dimensional X-Ray Diffraction microscopy, Mapping polycrystals and their dynamics, (Springer, Berlin, 2004). 3) S. Schmidt, S. F. Nielsen, C. Gundlach, L. Margulies, X. Huang and
D. Juul Jensen: Science305(2004) 229.
4) S. Schmidt and D. Juul Jensen: Arch. Metall. Mater.50(2005) 181. 5) G. Spanos: Scr. Mater.55(2006) 3.
6) W. Pantleon, H. F. Poulsen, J. Almer and U. Lienert: Mater. Sci. Eng. A 387(2004) 339.
7) B. C. Larson, W. Yang, G. E. Ice, J. D. Budai and J. Z. Tischler: Nature 415(2002) 887.
8) G. E. Ice: Materials World8(2000) 20.
9) H. J. Bunge, L. Wcislak, H. Klein, U. Garbe and J. R. Schneider: Adv. Eng. Mater.4(2002) 300.
10) H. J. Bunge: Textures Microstruct.35(2003) 253.
11) A. Preusser, H. Klein and H. J. Bunge: Texture Anisotropy of Polycryst. Ii105(2005) 3.
12) M. Kobayashi, H. Toda, Y. Kawai, T. Ohgaki, K. Uesugi, D. S. Wilkinson, T. Kobayashi, Y. Aoki and M. Nakazawa: Acta Mater.56 (2008) 2167.
13) E. M. Lauridsen, H. F. Poulsen, S. F. Nielsen and D. Juul Jensen: Acta Mater.51(2003) 4423.
14) P. A. Beck, P. R. Sperry and H. Hu: J. Appl. Phys.21(1950) 420. 15) B. Liebmann, K. Lucke and G. Masing: Zeitschrift fur Metallkunde
47(1956) 57.
16) S. Kohara, M. N. Parthasarathi and P. A. Beck: Trans. Metall. Soc. AIME212(1958) 875.
17) H. Yoshida, B. Liebmann and K. Lucke: Acta Metall.7(1959) 51. 18) T. Furu and E. Nes: Mater. Sci. Forum113–115(1993) 311. 19) R. A. Vandermeer and D. Juul Jensen: Interface Sci.6(1998) 95. 20) Y. B. Zhang, A. Godfey, Q. Liu, W. Liu and D. Juul Jensen: Acta
Mater., (2009) in press.
21) A. R. Jones, B. Ralph and N. Hansen: Proc. Roy. Soc. A368(1979) 345.
22) G. L. Wu and D. Juul Jensen: Acta Mater.55(2007) 4955.
23) D. J. Rowenhorst, A. Gupta, C. R. Feng and G. Spanos: Scr. Mater.55 (2006) 11.
24) D. Juul Jensen, D. J. Rowenhorst and S. Schmidt: Mater. Sci. Forum 558–559(2007) 85.
25) M. A. Martorano, M. A. Fortes and A. F. Padilha: Acta Mater.54 (2006) 2769.
26) S. Sreekala and M. Haataja: Phys. Rev. B76(2007).
27) R. B. Godiksen, Z. T. Trautt, M. Upmanyu, J. Schiotz, D. Juul Ensen and S. Schmidt: Acta Mater.55(2007) 6383.