Optimization of Strength, Ductility and Corrosion Resistance
in Ti-Mo Base Alloys by Controlling Mo Equivalency and Bond Order
X. H. Min
1, K. Tsuzaki
1;2, S. Emura
1, T. Nishimura
1and K. Tsuchiya
1;21National Institute for Materials Science, Tsukuba 305-0047, Japan
2Graduate School of Pure and Applied Sciences, University of Tsukuba, Tsukuba 305-0047, Japan
The crevice corrosion resistance in high chloride and high acidic solution at high temperature in Ti-15Mo-5Zr and Ti-15Mo-5Zr-1Fe alloys and the tensile properties at ambient temperature in Ti-15Mo-5Zr-1Fe alloy were investigated in this study. The crevice corrosion resistance in Ti-15Mo-5Zr alloy with a Mo equivalency of 18.2 mass%, which was previously reported to show a combination of the high yield strength and the significant uniform elongation, was almost twice as high as that in Ti-15Mo alloy when the bond order (Bo) increased from 2.8126 to 2.8232. A linear correlation between the crevice corrosion resistance and the Bo was confirmed in the Ti-Mo base alloys with the Bo between 2.7900 and 2.8232. Although the high crevice corrosion resistance, Ti-15Mo-5Zr-1Fe alloy with a Mo equivalency of 21.2 mass% showed high yield strength but negligible uniform elongation due to the deformation by dislocation slip. This study suggested that the two parameters of the Mo equivalency and the Bo are useful for an optimization of strength, ductility and corrosion resistance in Ti-Mo base alloys.
[doi:10.2320/matertrans.M2011124]
(Received April 22, 2011; Accepted May 25, 2011; Published July 13, 2011)
Keywords: beta titanium alloy, phase stability, bond order, tensile property, corrosion resistance
1. Introduction
Titanium and its alloys are widely used as the structural materials due to their good mechanical properties and high corrosion resistance. However, they are susceptible to corrosion attack when exposed to highly acidic environments
at high temperature.1,2)To overcome this drawback,
enhance-ment of the stability of the surface oxide film has been paid much attention through adding the noble alloying elements
such as Pd and Ru.3–5)Meanwhile, it has been reported that
titanium alloys with sufficient content of Mo provides the
high corrosion resistance.6–9)
Nishimura8) found that a Ti-15Mo alloy (mass%), which
was developed in the 1950s as a corrosion resistance
titanium alloy,10) exhibits an extremely high corrosion
resistance in highly acidic solution at 373 K, which is able to against the crevice corrosion in seawater at the high temperature. However, this alloy shows a low yield strength in the as-solution treated condition because of its deformation
byf332gh113itwinning.11,12)If the yield strength of this alloy
can be improved along with its high corrosion resistance, it will be a desirable structural material using in sever corrosion environments such as chemical plants, oil well tubes and offshore structures instead of Ru- or Pd-bearing titanium alloys.
It is well known that the tensile properties of titanium
alloys depend significantly on the deformation modes,13–15)
i.e. f332gh113i twinning and dislocation slip, which are
sensitive to thephase stability. The twinning occurs in the
alloys with low phase stability and leads to the low yield strength and large uniform elongation, while the slip occurs in the alloys with high phase stability and leads to the high yield strength and negligible uniform elongation. From an engineering point of view, a coexistence of high strength and large uniform elongation is crucial to ensure good formability under complex loading conditions.
In the previous study, the present authors16)found that a
combination of the above-mentioned twinning and slip
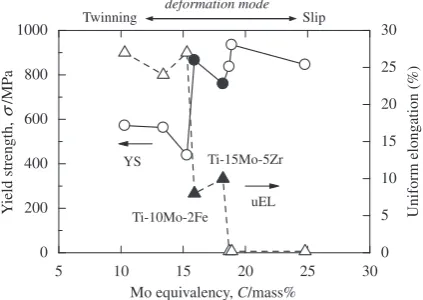
deformation modes is an effective for achieving the high yield strength and large uniform elongation in Ti-10Mo-2Fe and Ti-15Mo-5Zr alloys among Ti-Mo base alloys as shown in Fig. 1, where the Mo equivalency was designed to be between 15.3 and 18.7 mass%. Note that the Mo equivalency, which is the ratio of the level of a given stabilizer to the one
of Mo required for the same degree of phase stability, is
useful parameter for evaluating thephase stability.17–19)
On the other hand, the corrosion resistance of titanium alloys is affected by various factors such as chemical
composition and microstructure.20–23) Morishita et al.20)
investigated the effects of alloying elements on the corrosion
resistance of various kinds of titanium alloys in both
10% HCl and 10% H2SO4, and concluded that the alloys
containing the elements with the higher bond order (Bo) showed the lower active corrosion rate. Note that the Bo is a measure of the covalent bond strength between the titanium
and the alloying element.24,25)Matsugiet al.26)reported that
a ratio of weight loss to initial weight obtained from the
5 10 15 20 25 30
0 200 400 600 800 1000
0 5 10 15 20 25 30
Mo equivalency, C/mass%
Y
ield strength,
σ
/MP
a
Uniform elongation (%)
YS
uEL Ti-15Mo-5Zr
Ti-10Mo-2Fe deformation mode
Slip Twinning
Fig. 1 Changes in the yield strength (YS) and the uniform elongation (uEL) against the Mo equivalency in Ti-Mo base alloys,16)showing that a
[image:1.595.321.533.338.488.2]immersion test for 21.6 ks in Na2SO4-NaCl molten salt at
923 K decreases with increasing the Bo in some þand
titanium alloys. These results indicated that an increase
in the covalent bond strength between the atoms, i.e. an increase in the Bo, leads to high corrosion resistance of the
titanium alloys. In addition, the present authors27,28)reported
that the corrosion resistance of Ti-10Mo and Ti-15Mo alloys in the highly acidic solution at high temperature deteriorates by Fe addition, which is interpreted in terms of the Bo between 2.7900 and 2.8126. Although Ti-15Mo alloy with the Bo of 2.8126 exhibits the high crevice corrosion resistance, the alloy with the higher corrosion resistance is desirable to achieve on the basis of the Bo. Thus, the correlation between the corrosion resistance and the Bo is needed to further confirm in the alloy with a larger range value of the Bo.
Therefore, both of the Mo equivalency and the Bo should be considered to design the alloy for an optimization of strength, ductility and corrosion resistance. As shown in Fig. 2, the Mo equivalency increases by Zr and Fe addition in Ti-15Mo alloy. Meanwhile, the Bo increases by Zr addition in the alloy, while it decreases by Fe addition. Note that the Bo value for Ti, Mo, Zr and Fe in bcc Ti is 2.790, 3.063, 3.086 and 2.651, respectively. Although Ti-15Mo-5Zr alloy with a Mo equivalency of 18.2 mass% shows the high yield strength of 760 MPa and significant uniform elongation of
10% as mentioned before,16) the change in the crevice
corrosion resistance has not been investigated in the case of an increase in the Bo of 2.8232, which is determined as the atomic compositional average of above-mentioned Bo values on the basis of the analyzed chemical compositions. In addition, the tensile property of the alloy with the larger Bo is needed to further confirm when the Mo equivalency is larger than that of 18.7 mass% as shown in Fig. 1. Thus, Ti-15Mo-5Zr-1Fe alloy is also selected for this study with a Mo equivalency of 21.2 mass% and a Bo of 2.8209, which will be shown later (Table 3).
The aim of this study is to investigate the corrosion resistance in high chloride and high acidic solution at high temperature in Ti-15Mo-5Zr and Ti-15Mo-5Zr-1Fe alloys and the tensile property at ambient temperature in Ti-15Mo-5Zr-1Fe alloy, and to discuss an effectiveness for optimizing the strength, ductility and corrosion resistance by controlling the Mo equivalency and the bond order.
2. Experimental
2.1 Materials preparation
15Mo-5Zr and 15Mo-5Zr-1Fe alloys along with
Ti-15Mo and Ti-Ti-15Mo-1Fe alloys27)as the reference alloys were
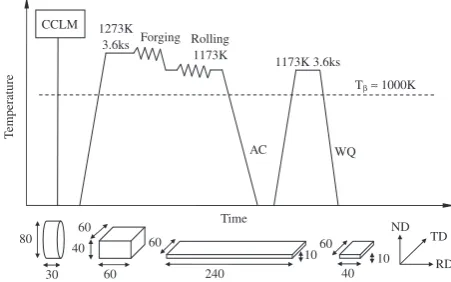
prepared by cold crucible levitation melting. Each ingot had 80 mm in diameter and 30 mm in length. Figure 3 shows a schematic drawing of the heat treatment for these alloys. The ingots were homogenized at 1273 K for 3.6 ks, hot forged at
1273 K into blocks of 60 mm (l)60 mm (w)40 mm (t),
and then hot rolled into plates of 240 mm (l)60 mm
(w)10 mm (t) at 1173 K followed by air cooling. The
plates were cut into 40 mm (l)60 mm (w)10 mm (t)
pieces and were solution treated at 1173 K for 3.6 ks followed by water quenching. The heat treatments were carried out in the air. The principal axes of the rolled specimens corre-sponding to normal direction (ND), rolling direction (RD) and transverse direction (TD) are defined as shown in Fig. 3. The analyzed chemical compositions of the alloys after the solution treatment are listed in Table 1.
2.2 Microstructural characterization
The specimens were mechanically polished and etched by using a solution of distilled water, nitric acid and hydrofluoric
acid (100 : 3 : 2in volume) and then observed by an optical
microscope (OM). Transmission electron microscope (TEM) observations were performed by a JEOL-2000FX system operating at 200 kV. Thin foils were prepared by a twin-jet electro-polisher in a solution of methanol, 1-butanol and
perchloric acid (10 : 6 : 1in volume) at 228 K with a voltage
of 20 V. A field emission scanning electron microscope (FE-SEM) equipped with an orientation imaging microscope was employed to conduct the electron backscattered diffraction
0 1 2 3 4 5 6
10 15 20 25 30
2.80 2.81 2.82 2.83
Zr and Fe content, C/mass%
Mo equi
v
alenc
y,
C
/mass%
Bond order
, Bo
Ti-15Mo-xFe Ti-15Mo-xZr
Mo Eq. Bo
Fig. 2 Changes in the Mo equivalency (Eq.) and the bond order (Bo) with content of Zr and Fe in Ti-15Mo alloy.
AC WQ
T
emperature
CCLM 1273K
3.6ks Forging Rolling
1173K 1173K 3.6ks
Tβ≈ 1000K
Time
30
80 60
240
10 40 60
10 ND
RD TD 40
60 60
[image:2.595.63.278.73.209.2]Fig. 3 A schematic drawing of heat treatment of Ti-15Mo-5Zr and Ti-15Mo-5Zr-1Fe alloys. CCLM, AC and WQ refer to cold crucible levitation melting, air cooling and water quenching, respectively.
Table 1 Nominal and analyzed chemical compositions of Ti-15Mo-5Zr and Ti-15Mo-5Zr-1Fe alloys along with Ti-15Mo and Ti-15Mo-1Fe alloys (mass%).
[image:2.595.312.538.75.216.2] [image:2.595.306.549.303.368.2](EBSD) analysis with a step size of 1mm performed on a JSM-7001F system.
2.3 Corrosion test
The specimens were cut into 10 mm (l)10 mm (w)
2 mm (t) pieces along the RD and TD of the plates for the
corrosion test. The corrosion resistance was evaluated by using the electrochemical impedance spectroscopy (EIS). The EIS measurements were carried out in a water solution of 10% NaCl with a pH value of 0.5 at 370 K (hereafter referred to as the simulated crevice solution), which was used to simulate the crevice inner solution with high chloride and low pH. Note that the highest temperature of the solution in chemical plants is usually around 373 K because of the boiling point of the solution, specially the seawater. A platinum counter electrode and a saturated calomel reference electrode (SCE) were used to carry out the EIS measure-ments. The specimens used as the working electrodes were covered with epoxy resin, and then mechanically polished so that only one metal surface would be in contact with the simulated crevice solution after deaeration by argon gas. A frequency response analyzer (FRA) was used for the EIS measurements with an amplitude of 10 mV and a frequency range of 0.003 Hz to 20 kHz. The electrochemical impedance spectra were obtained in an open circuit potential (OCP) condition after the specimens were immersed into the simulated crevice solution at 370 K for 1.8 ks to reach the steady state condition.
2.4 Tensile test
The tensile specimens with a width of 4 mm and a thickness of 2 mm in the gage section with a length of 18 mm were cut by electric discharge machining along the RD and TD of the plates. The tensile tests were carried out at ambient
temperature with a cross-head speed of5103mm s1.
3. Results
3.1 Microstructure
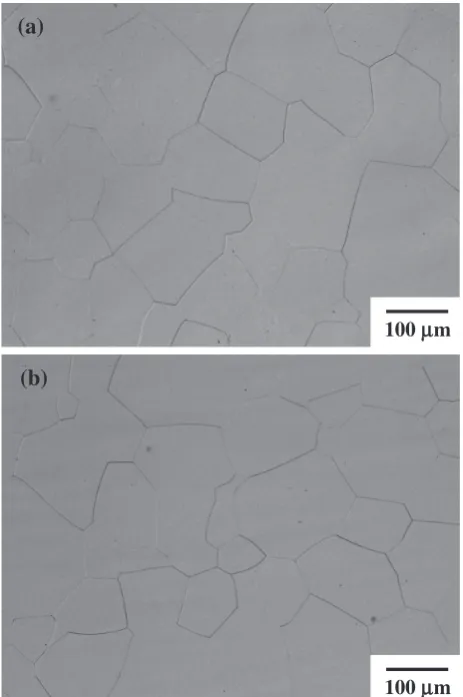
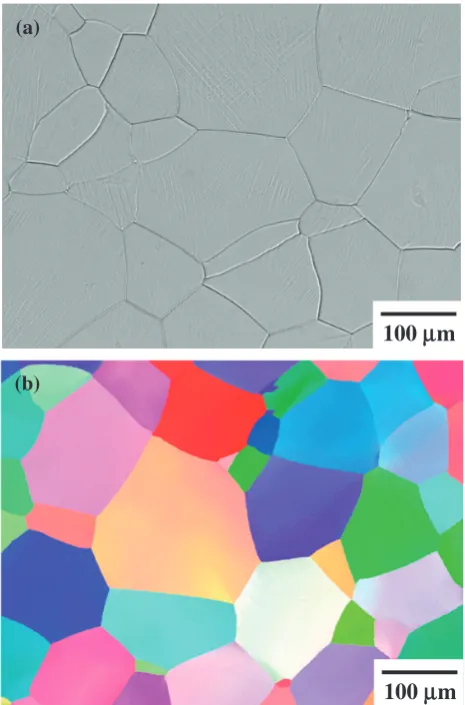
Figure 4 shows the optical micrographs of Ti-15Mo-5Zr and Ti-15Mo-5Zr-1Fe alloys. The OM observations revealed
that both alloys consist ofphase with an average grain size
of 100mm, which is no significant difference compared to
that of Ti-15Mo and Ti-15Mo-1Fe alloys.28)Figure 5 shows
the selected area diffraction (SAD) patterns. The presences
of thephase are confirmed in both alloys. In addition, the
diffraction spots for the athermal!phase are clearly detected
in Ti-15Mo-5Zr alloy as shown in Fig. 5(a), while it becomes weaker and diffuse in Ti-15Mo-5Zr-1Fe alloys in Fig. 5(b).
This difference in the athermal !phase between the alloys
is caused by the different phase stability. Here, it should
be emphasized that the effect of the athermal ! phase on
the corrosion resistance is thought to be small as mentioned
in the previous study27)since the chemical compositions of
the athermal!phase are the same as that of thephase.
3.2 Crevice corrosion resistance
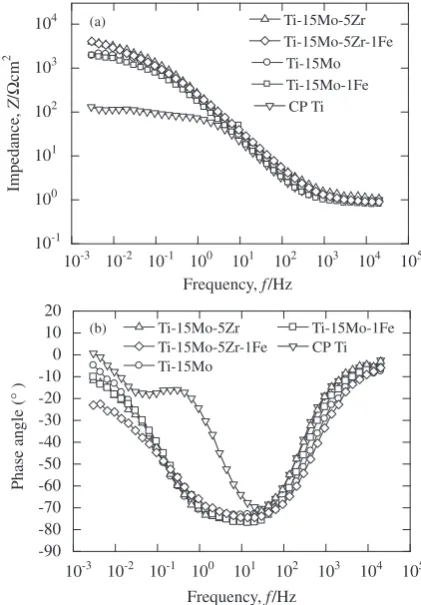
Figure 6 shows the electrochemical impedance spectra of Ti-15Mo-5Zr and Ti-15Mo-5Zr-1Fe alloys along with Ti-15Mo and Ti-15Mo-1Fe alloys and commercially pure
titanium Grade 2 (CP Ti). The electrochemical impedance spectra are used to investigate the effect of alloying elements on the corrosion resistance of the passive film against the crevice attack. Figure 6(a) and (b) shows the changes in the impedance and the phase angle with the frequency, respectively. Each spectrum of 5Zr and Ti-15Mo-5Zr-1Fe alloys like those of Ti-15Mo and Ti-15Mo-1Fe alloys indicates two corrosion resistance components and one capacitance component. As shown in Fig. 6(a), the impe-dance in the high frequency region from 1 to 20 kHz reflects the solution resistance, and the one in the low frequency region from 0.003 to 0.01 Hz reflects the passive film
resistance.8) On the basis of Fig. 6(b), the spectrum of
Ti-15Mo-5Zr and Ti-Ti-15Mo-5Zr-1Fe alloys shows one capaci-tance at around 30 Hz, while the one of the CP Ti shows two capacitances at around 0.06 Hz and 30 Hz, respectively. Note that the capacitance in the high frequency region at around 30 Hz is the passive film capacitance, and the one in the low frequency region at around 0.06 Hz is the double layer
capacitance, which corresponds to the active condition.8)The
high impedance value in the low frequency region and the passive film capacitance indicate that the alloys are passi-vated and exhibit the high corrosion resistance under the severe environment of high chloride and high acidic solution at high temperature; however, the active dissolution of the CP Ti occurs under the same environment.
100μμm
(b)
100μm
(a)
[image:3.595.311.543.72.421.2]Although all the alloys can be kept in the passive state, the different impedance values in the low frequency region as shown in Fig. 6(a) indicate that the alloying elements affect the corrosion resistance. Note that the higher impedance indicates that the passive film formed on the alloy is more stable and the alloy has the higher corrosion resistance. To evaluate the difference quantitatively, the average impedance was obtained for each alloy in a low frequency region from 0.003 to 0.01 Hz and listed in Table 2. The Ti-15Mo-5Zr and Ti-15Mo-5Zr-1Fe alloys exhibit higher impedance of
3584 and 3482cm2, respectively, than that of 2029 and
1785cm2 in Ti-15Mo and Ti-15Mo-1Fe alloys,
respec-tively. The Ti-15Mo-5Zr alloy shows the highest value among the alloys.
Figure 7 shows that the change in the average impedance against the Bo in Ti-15Mo base alloys along with the CP Ti. Since the largest Bo of 2.8232 among the alloys, Ti-15Mo-5Zr alloy shows the highest corrosion resistance. In addition, the Ti-15Mo-5Zr-1Fe alloy shows the higher corrosion resistance since the Bo of 2.8209 is larger than that of 2.8126 in Ti-15Mo alloy, although the corrosion resistance is slightly lower than that of Ti-15Mo-5Zr alloy.
3.3 Tensile property
Figure 8 shows the nominal stress-strain curves of Ti-15Mo-5Zr-1Fe alloy along with Ti-15Mo-5Zr alloy. Al-though the flow stress level is similar, Ti-15Mo-5Zr-1Fe alloy exhibits a significantly different shape of the stress-strain curve compared to that of Ti-15Mo-5Zr alloy. Table 2 lists the tensile properties of 0.2% proof stress (YS), tensile strength (TS), uniform elongation (uEL), total elongation (tEL) for Ti-15Mo base alloys and the CP Ti. The Ti-15Mo-5Zr-1Fe alloy shows a high yield strength of 800 MPa and a large total elongation of 21%, which are comparable to those of 5Zr alloy. On the other hand, Ti-15Mo-5Zr-1Fe alloy shows the uniform elongation of almost 0%
000
0002
011
200 222
(b)
000
0002
011
200 222
(a)
β
β
β β
ω
β β
ω
Fig. 5 Selected area diffraction patterns of (a) Ti-15Mo-5Zr alloy and (b) Ti-15Mo-5Zr-1Fe alloy. The zone axis is parallel to½011.
10-3 10-2 10-1 100 101 102 103 104 105 10-1
100 101 102 103 104
CP Ti
Frequency, f/Hz
Impedance,
Z
/
Ω
cm
2 Ti-15Mo
Ti-15Mo-1Fe Ti-15Mo-5Zr Ti-15Mo-5Zr-1Fe
(a)
10-3 10-2 10-1 100 101 102 103 104 105 -90
-80 -70 -60 -50 -40 -30 -20 -10 0 10 20
CP Ti
Frequency, f/Hz
Phase angle (
°
)
Ti-15Mo
Ti-15Mo-1Fe Ti-15Mo-5Zr
Ti-15Mo-5Zr-1Fe
(b)
Fig. 6 Electrochemical impedance spectra of 5Zr and Ti-15Mo-5Zr-1Fe alloys along with Ti-15Mo and Ti-15Mo-1Fe alloys and the commercially pure titanium Grade 2 (CP Ti)27)at an open circuit potential
[image:4.595.72.268.69.460.2]condition in a water solution of 10% NaCl with a pH value of 0.5 at 370 K. (a) impedance and (b) phase angle.
Table 2 Corrosion resistance for the average impedance (Rt) in a low frequency region from 0.003 to 0.01 Hz, and tensile properties for 0.2% proof stress (YS), tensile strength (TS), uniform elongation (uEL) and total elongation (tEL) in Ti-15Mo base alloys and the commercially pure titanium Grade 2 (CP Ti).
Alloys Rt (cm2)
YS (MPa)
TS (MPa)
uEL (%)
[image:4.595.320.531.72.375.2] [image:4.595.306.547.514.599.2]like Ti-15Mo-1Fe alloy, while Ti-15Mo-5Zr alloy has the value of 10%.
Figure 9 shows the microstructures of the specimen after being deformed to a tensile strain of 4.0% in Ti-15Mo-5Zr-1Fe alloy. As shown in Fig. 9(a), the slip traces are clearly
observed in the grains without thef332gh113itwins from the
optical observation. The EBSD inverse pole figure further confirms that the mechanical twins are absent in this alloy as shown in Fig. 9(b). These results indicate that the deforma-tion in Ti-15Mo-5Zr-1Fe alloy is dominated by the disloca-tion slip to result in the high strength and negligible uniform elongation like previously reported in 15Mo-1Fe,
Ti-10Mo-3Fe and Ti-10Mo-5Fe alloys.27,28)
4. Discussion
The previous studies27,28) investigated the crevice
corro-sion resistance in the high chloride and high acidic solution at high temperature in Ti-10Mo and Ti-15Mo alloys with Fe addition, and found that the corrosion resistance decreases with decreasing the Bo when the Bo is between 2.7987 and 2.8126 as shown in Table 3. This study further investigated the corrosion resistance in Ti-15Mo-5Zr and Ti-15Mo-5Zr-1Fe alloys with the larger Bo from 2.8126 to 2.8232, and
found that corrosion resistance increases with increasing the Bo.
[image:5.595.310.543.71.424.2]Note that a direct comparison of the corrosion resistance becomes difficult between Ti-15Mo base alloys and Ti-10Mo base alloys since the measured impedance by the EIS is sensitively affected by many factors such as different
Table 3 Calculated Mo equivalency (Eq.) and bond order (Bo) by the analyzed chemical compositions, 0.2% proof stress (YS), uniform elongation (uEL) and normalized impedance (nRt) in Ti-Mo base alloys along with the commercially pure titanium Grade 2 (CP Ti).
Alloys Mo Eq. (mass%) Bo
YS (MPa)
uEL
(%) nRt Ref. Ti-15Mo-5Zr 18.2 2.8232 760 10 1.767 Ti-15Mo-5Zr-1Fe 21.2 2.8209 800 0.2 1.716 Ti-15Mo 15.3 2.8126 439 27 1 28) Ti-15Mo-1Fe 18.7 2.8111 837 0.2 0.880 28) Ti-10Mo 10.3 2.8048 572 27 0.607 27) Ti-10M-1Fe 13.4 2.8037 563 24 0.606 27) Ti-10Mo-2Fe 15.9 2.8020 866 8 — 16) Ti-10Mo-3Fe 18.9 2.8015 935 0.2 0.573 27) Ti-10Mo-5Fe 24.8 2.7987 846 0.2 0.566 27) CP Ti — 2.7900 275 — 0.055 28)
2.78 2.79 2.80 2.81 2.82 2.83 2.84
0 1000 2000 3000 4000
Ti-15Mo-1Fe Ti-15Mo-5Zr
Ti-15Mo-5Zr-1Fe
Ti-15Mo
Bond order, Bo
A
v
erage impedance,
Z
/
Ω
cm
2
CP Ti
Fig. 7 Change in the average impedance in a low frequency region from 0.003 to 0.01 Hz against the bond order (Bo) in Ti-15Mo base alloys and the commercially pure titanium Grade 2 (CP Ti).
0 10 20 30 40
0 200 400 600 800 1000
Strain (%)
Stress,
σ
/MP
a
Ti-15Mo-5Zr
Ti-15Mo-5Zr-1Fe
Fig. 8 Nominal stress-strain curves of Ti-15Mo-5Zr-1Fe alloy along with Ti-15Mo-5Zr alloy.
100
μμ
m
(b)
100
μ
m
(a)
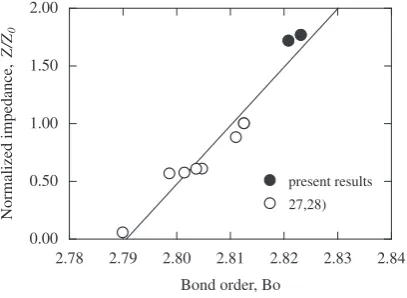
[image:5.595.63.282.74.226.2] [image:5.595.67.273.295.442.2] [image:5.595.306.548.547.694.2]solution, measurement condition. Here, it is needed to emphasis that Ti-15Mo alloy as a reference material was used not only for experimental series of Ti-15Mo base alloys but also for the one of Ti-10Mo base alloys. Therefore, in the present study, the average impedance of each alloy in a low frequency region from 0.003 to 0.01 Hz was normalized by that of Ti-15Mo alloy. Table 3 provides the normalized impedance of the alloys. Figure 10 shows the change in the normalized impedance against the Bo. Consequently, a linear correlation between the corrosion resistance and the Bo is obtained in the alloys with a large range value of the Bo between 2.7900 and 2.8232. In addition, when the Bo increases from 2.8126 to 2.8232, the corrosion resistance in Ti-15Mo-5Zr alloy is almost twice as high as that in Ti-15Mo alloy.
On the other hand, the present authors16)reported that the
change in the tensile properties in Ti-Mo base alloys with the Mo equivalency from 10.3 to 24.8 mass% (Table 3), and found that a combination of high yield strength and significant uniform elongation can be achieved when the Mo equivalency is between 15.3 and 18.7 mass% as shown in Fig. 1. This study further confirmed the tensile properties when the Mo equivalency is larger than 18.7 mass%, i.e. high strength and negligible uniform elongation, by using Ti-15Mo-5Zr-1Fe alloy. Although the high corrosion resistance and high yield strength, Ti-15Mo-5Zr-1Fe alloy shows the negligible uniform elongation. As mentioned in Section 1, Ti-15Mo alloy shows the high corrosion resistance and large uniform elongation, but the low yield strength. In addition, Ti-10Mo-2Fe alloy shows a combination of high yield
strength and significant uniform elongation,16) while its
corrosion resistance could be lower than that in Ti-15Mo alloy, although the corrosion test was not carried out. Here, it is should be emphasized that Ti-15Mo-5Zr alloy shows the high yield strength, significant uniform elongation and high corrosion resistance. Therefore, two parameters of the Mo equivalency and the Bo would be useful to optimize the strength, ductility and corrosion resistance.
5. Summary
The crevice corrosion resistance in the high chloride and high acidic solution at high temperature in Ti-15Mo-5Zr and 15Mo-5Zr-1Fe alloys and the tensile properties in Ti-15Mo-5Zr-1Fe alloy were investigated in this study. It can be concluded that the crevice corrosion resistance linearly increases with the Bo from 2.7900 to 2.8232 in Ti-Mo base alloys. A good combination of strength, ductility and corrosion resistance is obtainable when the Mo equivalency is designed to be between 15.3 and 18.7 mass% and the Bo is higher than 2.8126 of Ti-15Mo alloy.
REFERENCES
1) B. Vicentini, D. Sinigaglia and G. Taccani: Corros. Sci. 15(1975) 479–483.
2) L. A. Yao, F. X. Gan, Y. X. Zhao, C. L. Yao and J. L. Bear: Corrosion
47(1991) 420–423.
3) D. G. Kolman and J. R. Scully: J. Electrochem. Soc.140(1993) 2771– 2779.
4) S. Y. Yu, C. W. Brodrick, M. P. Ryan and J. R. Scully: J. Electrochem. Soc.146(1999) 4429–4438.
5) C. S. Brossia and G. A. Cragnolino: Corros. Sci.46(2004) 1693–1711. 6) N. D. Tomashov, R. M. Altovsky and G. P. Chernova: J. Electrochem.
Soc.108(1961) 113–119.
7) N. D. Tomashov, G. P. Chernova, Y. S. Ruscol and G. A. Ayuyan: Electrochim. Acta19(1974) 159–172.
8) T. Nishimura: J. Power Energy Syst.2(2008) 530–537.
9) S. Tamilselvi, T. Nishimura, X. H. Min and K. Tsuzaki: Mater. Trans.
50(2009) 2545–2551.
10) I. Weiss and S. L. Semiatin: Mater. Sci. Eng. A243(1998) 46–65. 11) A. W. Bowen: Scr. Mater.5(1971) 709–716.
12) X. H. Min, S. Emura, T. Nishimura, L. Zhang, S. Tamilselvi, K. Tsuchiya and K. Tsuzaki: Mater. Sci. Eng. A527(2010) 1480–1488. 13) S. Hanada and O. Izum: Trans. Jpn. Ins. Met.25(1986) 755–764. 14) S. Hanada and O. Izumi: Metall. Trans. A17(1986) 1409–1420. 15) S. Hanada and O. Izumi: Metall. Trans. A18(1987) 265–271. 16) X. H. Min, K. Tsuzaki, S. Emura and K. Tsuchiya: Mater. Sci. Eng. A
528(2011) 4569–4578.
17) P. J. Bania: Beta Titanium Alloys in 1990’s, ed. by D. Eylon, R. R. Boyer and D. A. Koss, (TMS, 1993) pp. 3–14.
18) S. Komatsu and M. Ikeda: Titanium Forum, (ISIJ, Japan, 1997) pp. 26– 36.
19) S. L. Nyakana, J. C. Fanning and R. R. Boyer: J. Mater. Eng. Perform.
14(2005) 799–811.
20) M. Morishita, Y. Ashida, M. Chikuda, M. Morinaga, N. Yukawa and H. Adachi: ISIJ Int.31(1991) 890–896.
21) S. Y. Yu and J. R. Scully: Corrosion53(1997) 965–976.
22) M. Geetha, U. K. Mudali, A. K. Gogia, R. Asokamani and B. Raj: Corros. Sci.46(2004) 877–892.
23) D. Q. Martins, W. R. Oso´rio, M. E. P. Souza, R. Caram and A. Garcia: Electrochim. Acta53(2008) 2809–2817.
24) M. Morinaga, N. Yukawa, T. Maya, K. Sone and H. Adachi: Sixth World Conference of Titanium, ed. by P. Lacombe, R. Tricot and G. Be´ranger, (France, 1988) pp. 1601–1606.
25) M. Morinaga, M. Kato, T. Kamimura, M. Fukumoto, I. Harad and K. Kubo: Titanium 92 Science and Technology, ed. by F. H. Froes and I. L. Caplan, (TMS, 1993) pp. 217–224.
26) K. Matsugi, T. Endo, Y. B. Choi and G. Sasaki: Mater. Trans.51(2010) 740–748.
27) X. H. Min, S. Emura, T. Nishimura, K. Tsuchiya and K. Tsuzaki: Mater. Sci. Eng. A527(2010) 5499–5506.
28) X. H. Min, S. Emura, N. Sekido, T. Nishimura, K. Tsuchiya and K. Tsuzaki: Mater. Sci. Eng. A527(2010) 2693–2701.
2.78 2.79 2.80 2.81 2.82 2.83 2.84 0.00
0.50 1.00 1.50 2.00
Bond order, Bo
Normalized impedance,
Z
/Z0
[image:6.595.67.271.74.223.2]present results 27,28)
Fig. 10 Change in the normalized impedance (Z/Z0) against the bond
order (Bo). Z and Z0are the average impedance in a low frequency region