Photocatalytic Activities and Crystal Structures of Titanium Dioxide
by Anodization: Their Dependence upon Current Density
Yoshiteru Mizukoshi and Naoya Masahashi
Osaka Center for Industrial Materials Research, Institute for Materials Research, Tohoku University, Sakai 599-8531, Japan
The crystal structure, crystallinity and surface area of anodized TiO2were systematically investigated focusing on the current density in the anodization. Anatase phase was evolved with an increase of the current density for the anodic oxides prepared in the electrolyte of 0.1 molL1 sulfuric acid, and the surface area was almost constant against the current density. On the other hand, rutile phase was evolved with the same of 1.2 molL1sulfuric acid, and the surface area increased with the current density. Photocatalytic degradation rates of methylene blue (MB) were normalized by surface area of TiO2, showing that the maximum value was found in the anodic oxide with approximately 60% of rutile in the fraction. The specific rate constant for MB degradation was the best in the anodic oxide with low lattice strain and the crystallite size of appropriately 40 nm. [doi:10.2320/matertrans.M2010106]
(Received March 24, 2010; Accepted June 3, 2010; Published July 14, 2010)
Keywords: anodization, crystallinity, titanium, photocatalyst, current density
1. Introduction
TiO2 is regarded as one of the most promising
photo-catalysts due to its broad functionality, long-term stability and non-toxicity since the first discovery by Honda and Fujishima.1)A number of methods have been employed to fabricate the TiO2 such as sol–gel methods,2) thermal
chemical vapor deposition,3)thermal spraying,4)and sputter-ing,5) along with anodic6–9) and thermal oxidation.10) Re-cently, we have reported the fabrication of TiO2
photo-catalyst on Ti or Ti alloy substrate by anodic oxidation. So far, it was reported that TiO2 anodized in a sulfuric acid
aqueous solution effectively degraded methylene blue (MB) aqueous solution11)and exhibited superhydrophilicity.12)In
addition, the anodic oxide showed photocatalytic activity under visible light illumination probably due to the band gap narrowing by sulfur doping.13) In the anodic oxidation,
various parameters such as concentration of electrolytes, applied voltage, pH and temperature, affect the character-istics of the produced oxide film. Among the parameters, especially from the industrial view point, current density is important because it determines the sizes of the anode substrates and specifications of the DC power supply. However, relevant reports on the effect of current density of anodization upon the photocatalytic activity are quite few.14)
In the present study, we examined the effect of current density during anodic oxidation on the photocatalytic activities focusing on the microstructure and crystal structure of the oxide. The current density was systematically varied and the obtained TiO2was characterized by XRD, SEM, and
laser microscope. The characteristic of the anodized TiO2
determining the photocatalytic activities were explored.
2. Experimental
A pure Ti plate (cp-Ti, grade I) with dimensions of
1991mm3 that was to be used as the anode was chemically polished using a 40-nm colloidal silica suspen-sion and was thoroughly washed in ethanol using an
ultrasonic cleaner. A constant current of 8–400 mA corre-sponding to current density of 20–1000 Am2was applied to
the Ti plate for 0.5 h in a sulfuric acid electrolyte of 0.1 or 1.2 molL1. A Pt mesh electrode (55cm2) was used as the
cathode. The anodized Ti was rinsed with distilled water and then dried at room temperature, followed by annealing at 723 K for 5 h in air atmosphere. We previously reported that the thickness of the oxide did not change with annealing, but the crystallinity of the oxide was improved to provide better photocatalytic activity for MB bleaching.11) The crystallo-graphic structure of the anodized oxide was determined by X-ray diffraction (PANalytical X’Pert diffractometer, Netherlands) with CuK radiation (0.15406 nm), at a scan rate of 1min1, and a rotating detector. The sample was set
in a thin-film geometry arrangement at 0.5 glancing angle.
Microstructure observations were conducted with a scanning electron microscopy (Keyence VE-8800, Japan) at an operating voltage of 20 kV. Surface area was measured using a laser microscope with a wavelength of 408 nm (Keyence VK-9710, Japan).
The photocatalytic activities of the fabricated photocata-lysts were evaluated by degradation of MB in aqueous solutions. The evaluations were carefully done considering the adsorption of MB molecules on the surface of the TiO2,
the direct photolysis of MB molecules and the self-sensitiz-ing degradation due to MB absorption. Prior to the evalua-tions, the TiO2were immersed in 0.02 molL1MB aqueous
solution for more than 12 h, and the saturation of MB adsorptions were confirmed. After the pre-treatment, the degradation of MB was carried out using 0.01 molL1 MB
solution. Light illumination was conducted by UV lamp with the central wavelength at 365 nm and full width at half maximum of 36 nm through bandpass filter. The passed light intensity through the 10 mm thickness of 0.01 molL1 MB
Hinshelwood kinetics model.15) When the concentration is
low, the degradation rate of MB,r, can be simplified to the following apparent first-order equation:
r¼dC
dt ¼kKC¼kappC ð1Þ
where C is the concentration of MB, t is the duration of light illumination, k is the reaction rate constant,K is the adsorption coefficient of the reactant andkappis the apparent
rate constants for MB degradation. In this study, photo-catalytic activity is expressed askappobtained from the slope
oftvslnðC=C0Þplots.
3. Results and Discussion
In the process of anodic oxidation, the current rose to the programmed value abruptly (typically within about 1 s) regardless of the anodizing conditions. On the other hand, the applied voltage depended upon the conditions of anodization. High voltage and high sweep rate were attained when the current density was high or the sulfuric acid concentration was low. For example, when titanium was anodized in 1.2 molL1 sulfuric acid with the current of 500 Am2, the
initial sweep rate and the final voltage were 6.7 V s1 and 198.7 V, respectively, which were similar to those previously reported.16)
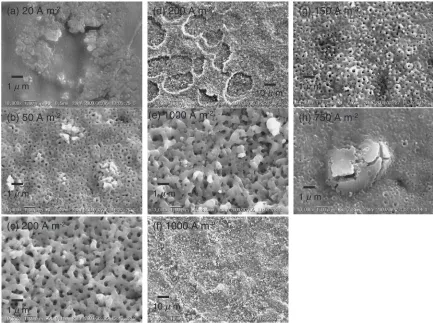
SEM images of the anodized TiO2are displayed in Fig. 1.
In the cases of the anodic oxides prepared in an electrolyte of 1.2 molL1 sulfuric acid, nano-sized pores emerged above
the current density of 50 Am2(Fig. 1(b)) and became larger
with the current densities. These nano-sized pores were not observed in the oxide anodize with current density lower than 20 Am2(Fig. 1(a)). For the anodic oxides prepared with the
current density larger than 200 Am2, concave curvature
with dozens of micrometers in diameter were confirmed, suggesting spalling of the formed oxide from the surface during the anodization (Fig. 1(d)). When the current density increased up to 1000 Am2, the above concave curvature
was not confirmed (Fig. 1(f)). For the anodic oxides prepared in an electrolyte of 0.1 molL1 sulfuric acid, micro-pores were distributed homogeneously in the oxide anodized with current density higher than 150 Am2(Fig. 1(g)). The sizes and frequencies of the pores did not change in accordance with the current density. Hillocks with several micrometers were observed on the surface anodized with current density higher than 750 Am2 (Fig. 1(h)). However, the concave
curvature was not observed regardless of the applied current density.
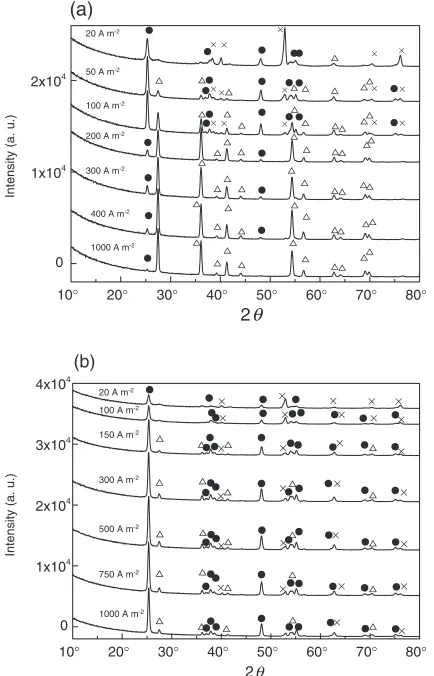
The crystal structures of the fabricated TiO2 were
inves-tigated by thin layer XRD technique. XRD patterns are shown in Fig. 2(a) and (b). In both cases, when the current density increased, the peak intensity of titanium substrate declined and the peaks from titanium oxides increased. This indicates that thick oxide layer was formed with the incre-ment of the current density. The growth of the oxide layer was also observed in the potentiostatic anodization of titanium with the increment of the applied voltage.17)In the cases of the anodic oxides prepared in an electrolyte of (e) 1000 A m-2
(c) 200 A m-2
(a) 20 A m-2
(b) 50 A m-2
(f) 1000 A m-2
(d) 200 A m-2 (g) 150 A m-2
(h) 750 A m-2 1 µm
1 µm 1 µm
1 µm
1 µm
1 µm
10 µm
10 µm
[image:2.595.80.513.72.395.2]1.2 molL1, anatase phase was confirmed in the oxide and
the peak intensity increased with the current density up to 100 Am2. With further increase of the current density, the
primary phase changed from anatase to rutile. In the cases of TiO2 anodized in 0.1 molL1, the peak intensity of anatase
increased with increasing of the current density until 300 Am2followed by saturation of the intensity. The weak diffraction peaks due to rutile phase were observed irrespec-tive of the current density.
The rutile phase fraction, sizes of the crystallite, and lattice strain of the anodized TiO2 were calculated. Several
empirical equations were proposed to estimate the fraction of the TiO2 constituent phase between rutile and
ana-tase,18–20) while no distinct difference was found between
them. Using eq. (2),20)
frutile ¼
0:679Irutile IrutileþIanatase
þ0:312 Irutile IrutileþIanatase
2
ð2Þ
where Ianatase101 and Irutile110 are the peak area of the main
anatase and rutile reflections, respectively, the fractions of rutile in the anodic oxides were calculated. Hall’s equation (eq. (3)) was employed to calculate the sizes of crystallite and lattice strain,21)
cos¼K
Lþ2"sin ð3Þ
whereL is crystallite size expressed in nm, is the X-ray wavelength,is the full width at half maximum (FWHM) of the signal in radians,Kis the shape factor of 0.89, assuming that the crystallite is sphere," is lattice strain, andis the Bragg angle. The intensity and the FWHM were obtained by software of Profile Fit (Philips, Netherlands). For the oxide anodized with the low current density (20 Am2 for
1.2 molL1 and lower than 100 Am2 for 0.1 molL1
sulfuric acid), the plotted data could not fit with Hall’s equation due to low intensity of the diffraction peaks. Thereby, the lattice strain and crystallite size of the predominant phase were calculated for the oxides with higher current density. The result is shown in Fig. 3. The fraction of rutile (Fig. 3(a)) was 58% and above 90% in the anodic oxide with the current density of 150 Am2 and 500 Am2, respectively, when the concentration of sulfuric acid in the electrolyte was 1.2 molL1. In the cases of the
anodic oxides prepared in an electrolyte of 0.1 molL1, the
rutile fraction was less than 10% regardless of the current density. With increasing of the current density, the size of the crystallite and the lattice strain decreased and converged to 30–40 nm and2{3103, respectively (Fig. 3(b) and (c)).
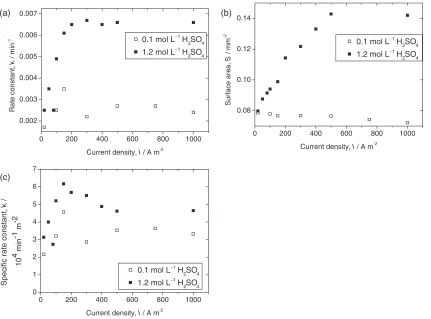
Figure 4(a) shows the rate constants for MB degradation of the anodic oxides prepared in an electrolyte of 1.2 molL1,
revealing the rate constants increased with the current density and reached the plateau at the current density above 200 Am2. On the other hand, TiO2 anodized in an
electro-lyte of 0.1 molL1 sulfuric acid degraded MB with almost same low rate constants independent of the current density. The surface area increased with the current density shown in Fig. 4(b). It should be noted that the effective surface area derived in this study is corresponding to the illuminated area to evaluate photocatalytic activity, because photocatalytic reaction occurs at the illuminated area. This implies that the surface area derived from BET method is inadequate to consider the photocatalytic activities, because it provides the surface area including the area not to be illuminated. Specific surface area of the anodic oxides prepared in an electrolyte of 1.2 molL1 sulfuric acid linearly increases with the current
density and reached plateau at 500 Am2, whereas the
surface area was quite low regardless of the current density for the anodized TiO2 prepared in an electrolyte of
0.1 molL1. From these results, it was found that the surface morphologies including roughness depended on the concen-tration of sulfuric acid in the electrolyte preferentially as compared with the current density and the final voltage.
It was reported that the photocatalytic activities were affected by different factors such as crystallinity, crystal structure, surface area, chemical impurities, and constituent phase and its fraction. TiO2 photocatalyst is one of the
heterogeneous catalysts, so that the activities are improved by absorbing large amount of substances to be photo-degraded on the surface of TiO2 with high surface area.
In the present study, the anodized TiO2 with higher surface
area exhibited higher activity. In order to investigate the photocatalytic activities per surface area of TiO2, specific
rate constant (SRC) was defined. The SRC dependence upon the current density was shown in Fig. 4(c). It reveals that TiO2 anodized in an electrolyte of 1.2 molL1 sulfuric
acid showed better performance as compared with that of 10° 20° 30° 40° 50° 60° 70° 80°
0 1x10⁴ 2x10⁴
Intensity (a. u.)
2
20 A m-2
× × ×
× ×
× ×
× ×
× ×
× ×
×
× 50 A m-2
100 A m-2
200 A m-2
300 A m-2
400 A m-2
1000 A m-2 (a)
θ
10° 20° 30° 40° 50° 60° 70° 80°
0 1x10⁴ 2x10⁴ 3x10⁴ 4x10⁴
Intensity (a. u.)
2
× ×
× × × × ×
× ×
× × × × ×
×
× ×
×
× ×
×
× ×
× × × ×
20 A m-2
100 A m-2
150 A m-2
300 A m-2
500 A m-2
750 A m-2
1000 A m-2
× (b)
θ
[image:3.595.61.278.75.413.2](a) (b)
(c)
0 200 400 600 800 1000 0.002
0.003 0.004 0.005 0.006 0.007
0.1 mol L−1 H
2SO4
1.2 mol L−1 H
2SO4
Rate constant,
k
/ min
-1
Current density, I / A m-2
0 200 400 600 800 1000 0.08
0.10 0.12 0.14
0.1 mol L−1 H2SO4
1.2 mol L−1 H2SO4
Surface area,
S
/ mm
-2
Current density, I / A m-2
0 200 400 600 800 1000 0
1 2 3 4 5 6 7
0.1 mol L−1 H
2SO4
1.2 mol L−1 H
2SO4
Specific rate constant,
k
/
10
4 min -1 m
-2
Current density, I / A m-2
Fig. 4 (a) MB degradation rate constants, (b) surface area of anodized TiO2 and (c) specific rate constants for photocatalytic MB degradation.
(a) (b)
(c)
0 200 400 600 800 1000 0
20 40 60 80 100
0.1 mol L−1 H2SO4
1.2 mol L−1 H
2SO4
Rutile fraction (%)
Current density / A m-2
0 200 400 600 800 1000 1200 20
25 30 35 40 45 300 350 400
0.1 mol L−1 anatase
1.2 mol L−1 anatase
1.2 mol L−1 rutile
Crystalline size,
L
/ nm
Current density, I / A m-2
0 200 400 600 800 1000 0.000
0.002 0.004 0.006 0.008 0.06 0.07
0.1 mol L−1 anatase
1.2 mol L−1 anatase
1.2 mol L−1 rutile
Lattice strain,
Current density, I / A cm-2
ε
[image:4.595.85.515.67.393.2] [image:4.595.86.517.440.759.2]0.1 molL1 and reached the peak with the current density at 150 Am2.
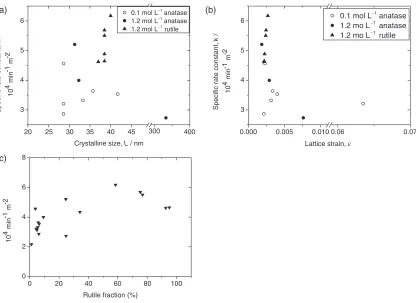
The SRC dependences on crystallite size, lattice strain and phase composition (rutile fraction) are summarized in Fig. 5. The plotted data is relatively scattered due to low intensity in reflection, especially for the anodic oxides prepared in the electrolyte of low sulfuric acid concentration. However, it is possible to consider the correlation between the crystallo-graphic factors and SRC to a certain extent, because reasonable explanation to understand this result could be provided as stated below. With the increment of the crystallite size, the SRC increased and showed the highest at 40 nm in the crystallite size as shown in Fig. 5(a). If the crystallite is small, it is considered that the photocatalytic activity is deteriorated because a lot of interfaces could become sink sites for the photo-exited charge carries of electrons and holes.22,23) In addition, since electrons and
holes can not migrate a longer distance in the small crystallite and they can not effectively separate, the recombination of the charge carriers may occur more frequently in smaller crystalline than in larger one.24) On the other hand, the
adsorbed amounts of molecules to be decomposed on the surface of the photocatalyst decrease with increasing crys-tallite size.25) Further, the photo-exited charge carriers can
not reach the surface of the photocatalyst due to an increase of recombination frequency, resultantly the photo-degrade efficiency is lowered. It is plausible that there exists an optimum crystallite size due to this opposite two factors as shown in Fig. 5(a). The optimum crystallite size of 40 nm in the current study is interestingly in the range of the reported crystallite size.26)
The anodized TiO2showed high activities with low lattice
strain as shown in Fig. 5(b). The crystal strain is reported to scatter the charge carriers and interrupt their migrations to the catalysts surface,27–29) which could provide reasonable
explanation to the present result.
The SRC increased with an increase of rutile fraction (Fig. 5(c)). The highest activity marked in the oxide with about 60% rutile phase, which is higher than 25% of commercially available photocatalyst P-25.30)It is generally
accepted that high photoactivity could be obtained in the TiO2 of anatase single phase or a mixed phase of a large
amount of anatase and residual rutile. Slightly higher Fermi level of anatase to rutile phase31)could be attributable to the higher performance of anatase. However, there are different studies to report the similar photocatalytic activities between them32)or superiority of rutile to anatase.33,34)This disagree-ment is originated from the various parameters which can not be simultaneously controlled, such as specific surface area, distribution of pore size and crystallinity. In contrast, the present method enables us to control the crystallite size, lattice strain, phase component by changing current density. The rutile structured TiO2 anodized in 1.2 molL1 sulfuric
acid aqueous solution with the current density of 1000 Am2
(rutile fraction: 95.2%, crystallite size: 38.5 nm, lattice strain: 0.0022) exhibited higher SRC than anatase structured TiO2
anodized in 0.1 molL1sulfuric acid aqueous solution with the current density of 1000 Am2 (rutile fraction: 5.5%, crystallite size: 38.5 nm, lattice strain: 0.00315). These results suggest that the rutile structured TiO2 with superior
photocatalytic activities could be fabricated by controlling electrochemical parameter in the anodic oxidation.
(a)
(c)
(b)
20 25 30 35 40 45 300 400 3
4 5 6
0.1 mol L−1
anatase 1.2 mol L −1anatase 1.2 mol L−1
10
4min
-1
m
-2
Crystalline size, L / nm
0.000 0.005 0.010 0.06 0.07 3
4 5 6
10
4min
-1
m
-2
0.1 mol L−1
anatase
1.2 mo L−1 anatase
1.2 mo L−1 rutile
Lattice strain,
0 20 40 60 80 100 0
2 4 6 8
10
4min
-1
m
-2
Rutile fraction (%)
rutile
Specific rate constant,
k
/
Specific rate constant,
k
/
Specific rate constant,
k
/
ε
[image:5.595.93.509.70.373.2]4. Conclusions
The characteristics, including phase composition and crystallinity, of the TiO2 fabricated by anodic oxidation
were systematically examined by controlling the current density. The anodic oxide with low lattice strain and the crystallite size of appropriately 40 nm showed high SRC for MB degradation. It was also elucidated that TiO2consisting
of rutile phase with high crystallinity exhibited superior photocatalytic activity to anatase phase.
Acknowledgements
The authors wish to thank Ms. Y. Matsuda and Mr. S. Sugiyama from IMR, Tohoku University, for their helpful assistance. The authors are grateful to Keyence Co., Ltd. for the measurements of surface areas by a laser microscopy.
REFERENCES
1) A. Fujishima and K. Honda: Nature238(1972) 37–38.
2) N. Negishi, T. Iyoda, K. Hashimoto and A. Fujishima: Chem. Lett.24
(1995) 841–842.
3) U. Backman, A. Auvinen and J. K. Jokiniemi: Surf. Coat. Technol.192
(2005) 81–87.
4) T. P. Curtis, G. Walker, B. M. Dowling and P. A. Christensen: Water Res.36(2002) 2410–2413.
5) D. Dumitriu, A. R. Bally, C. Ballif, P. Hones, P. E. Schmid, R. Sanjine´s, F. Le´vy and V. I. Paˆrvulescu: Appl. Catal. B25(2000) 83–92. 6) K. Shankar, K. C. Tep, G. K. Mor and C. A. Grimes: J. Phys. D: Appl.
Phys.39(2006) 2361–2366.
7) D. Velten, V. Biehl, F. Aubertin, B. Valeske, W. Possart and J. J. Breme: Biomed. Res.59(2002) 18–28.
8) A. G. Mantzila and M. I. Prodromidis: Electrochim. Acta51(2006) 3537–3542.
9) T. Shibata and Y.-C. Zhu: Corros. Sci.37(1995) 253–270.
10) R. Palombari, M. Ranchella, C. Rol and G. V. Sebastiani: Sol. Energy Mater. Sol. Cells71(2002) 359–368.
11) N. Masahashi, Y. Mizukoshi, S. Semboshi and N. Ohtsu: Applied.
Catal. B90(2009) 255–261.
12) N. Masahashi, Y. Mizukoshi, S. Semboshi and N. Ohtsu: Chem. Lett.
37(2008) 1126–1127.
13) Y. Mizukoshi, N. Ohtsu, S. Semboshi and N. Masahashi: Appl. Catal. B
91(2009) 152–156.
14) S. Ahn, L.-K. Choi and J. Jung: J. Adv. Oxid. Technol.10(2007) 354– 360.
15) I. K. Konstantinou and T. A. Albanis: Appl. Catal. B49(2004) 1–14. 16) M. V. Diamanti and M. P. Pedeferri: Corros. Sci.49(2007) 939–948. 17) N. Masahashi, S. Semboshi, N. Ohtsu and M. Oku: Thin Solid Films
516(2008) 7488–7496.
18) D. Chen, D. Yang, Q. Wang and Z. Jiang: Ind. Eng. Chem. Res.45
(2006) 4110–4116.
19) R. A. Spurr and H. Myers: Anal. Chem.29(1957) 760–762. 20) X. Fu, L. A. Clark, Q. Yang and M. A. Anderson: Environ. Sci.
Technol.30(1996) 647–653.
21) G. K. Williamson and W. H. Hall: Acta Matell.1(1953) 22–31. 22) H. Kominami, J. Kato, M. Kohno, Y. Kera and B. Ohtani: Chem. Lett.
12(1996) 1051–1052.
23) F. Amano, O.-O. Preto-Mahaney, Y. Terada, T. Yasumoto, T. Shibayama and B. Ohtani: Chem. Mater.21(2009) 2601–2603. 24) K. Tanaka, M. F. V. Capule and T. Hisanaga: Chem. Phys. Lett.187
(1991) 73–76.
25) O. Carp, C. L. Huisman and A. Reller: Prog. Solid State Chem.32
(2004) 33–177.
26) M. Inagaki, R. Nonaka, B. Tryba and A. W. Morawski: Chemosphere
64(2006) 437–445.
27) A. G. Agrios and P. Pichat: J. Photochem. Photobiol. A180(2006) 130–135.
28) G. Benko¨, B. Ska˚rman, R. Wallenberg, A. Hagfeldt, V. Sundstro¨m and A. P. Yutsev: J. Phys. Chem. B107(2003) 1370–1375.
29) J. Wu, X. Lu, L. Zhang, F. Huang and F. Xu: Eur. J. Inorg. Chem.2009
(2009) 2789–2795.
30) T. Ohno, K. Sarukawa, K. Tokieda and M. Matsumura: J. Catal.203
(2001) 82–86.
31) H. P. Maruska and A. K. Ghosh: Solar Energy20(1978) 443–458. 32) X. Deng, Y. Yue and Z. Gao: Appl. Catal. B: Environ.39(2002) 135–
147.
33) A. Mills, S. K. Lee and A. Lepre: J. Photochem. Photobiol. A: Chem.
155(2003) 199–205.
34) S. S. Watson, D. Beydoun, J. A. Scott and R. Amal: Chem. Eng. J.95