Effect of Composition and Microstructure of Pd-Cu-Si Metallic Glassy Alloy
Thin Films on Hydrogen Absorbing Properties
Susumu Kajita
1, Shinji Kohara
2, Yohei Onodera
3, Toshiharu Fukunaga
3and Eiichiro Matsubara
41Advanced Materials Development Department, Panasonic Electric Works Co., Ltd., Kadoma 571-8686, Japan 2Research and Utilization Division, Japan Synchrotron Radiation Research Institute, Sayo-cho, Hyogo 679-5198, Japan 3Research Reactor Institute, Kyoto University, Kumatori-cho, Sennan-gun, Osaka 590-0494, Japan
4Department of Materials Science and Engineering, Kyoto University, Kyoto 606-8501, Japan
Thin films of Pd-Cu-Si metallic glassy alloys for a hydrogen sensor were fabricated by a sputtering method. In order to find out the effect of the composition and the microstructure of them on the hydrogen absorbing property (the H2response), the structural parameters based on the
short-range order (SRO) were measured. Additionally, the change of the structural parameters with hydrogen absorption was measured, and the correlations of the change with the H2response and the hydrogen induced linear expansion coefficient (LEC) were examined. The H2response
decreased with increases in Si content and the structural parameters. These results can be explained by the positive effects of Si content and the structural parameters on the formation of a trigonal prism which is a structural unit of Pd-based amorphous alloys, and by the negative effect of the trigonal prism on absorbing hydrogen. From the observation of the elongation of the Pd-Pd atomic distance with absorbing hydrogen, H atoms are supposed to occupy the space between Pd atoms. The amount of the change in the Pd-Pd atomic distance showed the positive correlations with the H2response and the LEC. [doi:10.2320/matertrans.M2011105]
(Received April 7, 2011; Accepted June 14, 2011; Published July 27, 2011)
Keywords: palladium-copper-silicon alloy, metallic glassy alloy, sputtering, thin film, hydrogen absorption, X-ray diffraction, structural analysis
1. Introduction
In order to develop the hydrogen sensor for fuel cell vehicles,1) we have adopted a Pd-Cu-Si metallic glassy
alloy2) that is a typical composition of Pd-based metallic
glassy alloys for the sensor material, and have reported its excellent hydrogen sensing ability.3,4) The hydrogen atoms
dissociated from hydrogen molecules on the surface of Pd become hydrogen anions by trapping the conduction band electrons of Pd, resulting in an increase in the electric resistance of Pd.5) The high rate of change in electric
resistance (that is defined as the H2response) with hydrogen absorption/desorption is required for the sensor material. The H2 response increases with an increase in the amount of absorbed hydrogen in Pd and Pd-based alloys.6)Therefore, it is very important to find out the effect of the composition and the microstructure of Pd-Cu-Si metallic glassy alloys on the hydrogen absorbing property.
Several studies on hydrogen absorbing properties of Pd-based amorphous alloys have been reported. Kirchheim et al.7) have measured the solubility and diffusivity of
hydrogen in amorphous Pd77:5Cu6Si16:5 using an electro-chemical method. They considered an amorphous metal was composed of a spectrum of defects, and sites which were occupied by hydrogen corresponded to different energy levels. Also they assumed the energy distribution was given by a Gaussian function and the sites were filled according to Fermi-Dirac statistics. Lee et al.8) have measured the
solubility and diffusivity of hydrogen in amorphous Pd83Si17 and Pd81Si19using an electrochemical double cell technique. They reported that the hydrogen solubility increased with increasing Pd content and decreasing Si content. Further-more, they considered the amorphous alloy had a broad range of energy states for the hydrogen incorporation. Because there was a very strong dependence of the diffusion
coefficient on hydrogen concentration in amorphous alloys, while there was negligible dependence of it in crystallized Pd-Si alloys.
The structural analysis on Pd-based amorphous alloys has been studied using some diffraction methods. Fukunaga et al.9)have studied the structure of three kinds of amorphous
alloys (Pd85Si15, Pd80Si20 and Pd78Si22) by neutron diffrac-tion. Ohkuboet al.10)have studied the structure of Pd
82Si18
and Pd75Si25 by electron diffraction employing high-resolution electron microscopy (HREM) images. In both studies, they determined the structural parameters based on the short-range order (SRO): atomic distances of Pd-Si and Pd-Pd, the coordination number of Si atoms around a Pd atom (NPdSi) and that of Pd atoms around a Si atom (NSiPd). They
discussed their obtained results with a trigonal prism which is reported as a structural unit of Pd-based amorphous alloys. In our previous report,11)we measured the structural parameters based on the SRO and explained the observed positive correlation between glass transition temperature (Tg), which
was the characteristic thermal property of metallic glassy alloys, and the composition by using the parameters on the standpoint of the formation of trigonal prisms.
The aim of this study is to find out the effect of composition and microstructure of Pd-Cu-Si metallic glassy alloy thin films on the hydrogen absorbing property (the H2 response). For determining the microstructure, the structural analysis using synchrotron X-ray diffraction meas-urement was performed. The correlations of the H2response with the composition and the structural parameters were examined and discussed on the stand point of the formation of trigonal prisms. Additionally, the change of structural parameters with hydrogen absorption was measured, and the correlations of the change with the H2 response and the hydrogen induced linear expansion coefficient (LEC) were examined.
2. Experimental
2.1 Alloy film preparation and characterization
Pd-Cu-Si alloy thin films with five kinds of composition were deposited on glass substrates using an RF magnetron sputtering equipment (L-332FHS, Cannon ANELVA Cor-poration) with a simultaneous three sources (Pd, Cu and Si) sputtering mechanism and a substrates-rotating mechanism. The diameters of sputtering targets (Pd, Cu and Si) were 76.2 mm each. The rotation speed of substrates was fixed at 80 rpm. The substrate-target distance (S-T distance) was 70 mm. Ar-pressure for the sputtering was 0.3 Pa. The composition ratios of thin films were controlled by changing RF powers to the three kinds of sputtering targets individ-ually. In order to fabricate Pd-Cu-Si alloys in amorphous phase, the three constituent elements should be mixed homogeneously in a thin film. If a deposition rate (deposition thickness per one revolution of substrates) of an element is larger than its atomic diameter, it leads to the formation of a single element layer in principle. For obtaining the structure of homogeneously mixed elements, a sparse deposition per one revolution of substrates is required. Therefore, the RF power was controlled so that the deposition rate of each element became smaller than the corresponding atomic diameter.
The deposition time was calculated to achieve 4000 nm thickness of Pd-Cu-Si thin films using the total deposition rate which is the sum of the deposition rates of three kinds of elements. After measuring the thickness of a deposited thin film, the total deposition rate was corrected according to the difference between the measured thickness and 4000 nm. After that, a 100 nm thickness of Pd-Cu-Si thin film was fabricated by using the corrected total deposition rate. The thicknesses of thin films were measured with a surface profiler (Dektak3ST, Veeco Instruments Inc.). The thin films of 100 nm thickness were used for the measurement of the H2 response and those of 4000 nm thickness were used for the X-ray diffraction measurement and the characterization of the films. The composition of the thin films was analyzed by inductively coupled plasma-atomic emission spectrometry (ICP-AES).
2.2 Measurement of the H2response
The H2 response was observed by measuring the electric resistance change of the thin films exposed in N2 and H2 under the atmospheric pressure. A thin film sample with a glass substrate was placed in a stainless chamber set up in an electric oven and then its electric resistance was measured by 4-probe method using Au plated brass electrodes, while the thin film sample was exposed in 100% N2 and 100% H2of atmospheric pressure alternately. The experimental temper-ature was controlled at 303 K. The H2 response is expressed as the normalized value (R=R0), where R and R0 are the electric resistances of the thin film exposed in 100% H2and 100% N2, respectively. The detail of the H2 response measurement was explained in the previous reports.3,4)
2.3 Measurement of the hydrogen induced linear ex-pansion coefficient
The hydrogen induced linear expansion coefficients
(LECs) of thin films were measured with a thermo mechan-ical analyzer (TMA, TMA4030SA, Bruker AXS K.K.) by tensile loading method. The sample for the measurement was a 4000 nm thickness, 10 mm length and 5 mm width thin film which was peeled off from a glass substrate and was cut into the size. The load in tension was 0.5 g. Operating temperature was 298 K. First, the sample was exposed in 100% N2. After that, the atmosphere gas was changed to 100% H2 and the longitudinal expansion of the sample was measured. The hydrogen induced LEC was calculated by the following equation.
LEC ð%Þ ¼ ðLH2L0Þ=L0100
LH2: length of the sample exposed in 100% H2 L0: initial length of the sample (¼10mm)
The longitudinal expansion of the sample is expressed as (LH2L0).
2.4 X-ray diffraction measurement
In order to determine the structural parameters on the SRO, synchrotron X-ray diffraction measurement of thin films in hydrogen desorbing/absorbing condition was performed. The prepared thin films of about 4000 nm thickness were peeled off from glass substrates, and were cut into 9 mm square films. 40 pieces of the cut thin films were stacked in a stainless sample holder having two windows covered with 0.125 mm thickness polyimide films and a stop valve. The atmosphere in the sample holder was air of atmospheric pressure for hydrogen desorbing condition. When the measurement was carried out in hydrogen absorbing con-dition, the air in the stainless sample holder was substituted with 100% H2 of atmospheric pressure with a dry pump.
The synchrotron X-ray diffraction measurements were carried out using a horizontal two-axis diffractometer with a photon energy of 61.57 keV ( ¼0:02014nm) at the BL04B2 beamline of the SPring-8 synchrotron radiation facility. The temperature during the measurement was about 293 K. After corrections for background, polarization, ab-sorption and Compton scattering, the scattering intensity was normalized to give the structure factor, SðQÞ, where
Q¼4sin=.12)
3. Results and Discussion
3.1 H2response
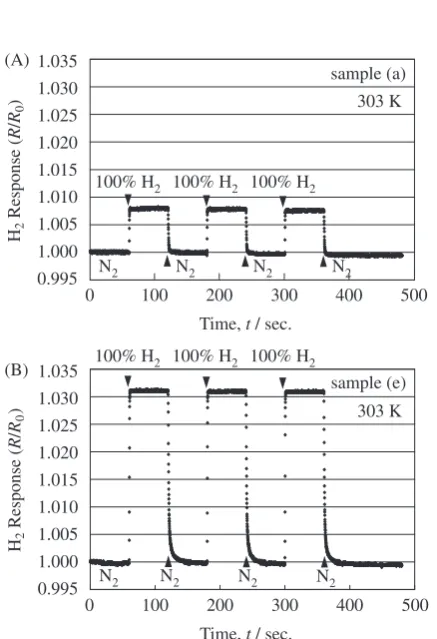
Table 1 shows the composition and the H2 response of the thin films, samples (a) to (e), measured at 303 K. Figures 1(A) and (B) show the 100% H2 response transients of sample (a) Pd67:8Cu14:3Si17:9and sample (e) Pd75:1Cu12:3 -Si12:6 at 303 K, respectively. These figures indicate signifi-cant difference in the 100% H2 response depending on the composition.
resistance of the alloy changes depending on the amount of absorbed hydrogen. In Fig. 2(B), the data are classified into two groups according to their Pd content (Pd¼75:1{ 75:3at% and Pd¼67:8at%) to eliminate the strong effect of Pd content on the H2 response. From Fig. 2(B), it can be seen that H2response decreases with increasing Si content in the same group. This suggests the possibility of some kind of correlation between the structural changes in the thin films with increasing Si content and the H2response relating to the amount of absorbed hydrogen.
3.2 Structural analysis
The structural parameters based on the SRO of the thin films were measured. Basically, the structural parameters in hydrogen desorbing condition and the analyzing procedure in the present study are the same as those in the previous report.11)Figure 3 shows the first peaks of radial distribution
functions, RDF(r)s, of samples (a) to (e). The method for obtaining the RDF(r) is explained in a reference.13)
In order to obtain the structural parameters, it is necessary to divide the first peak of RDF(r) into partial correlations by
N2 N2 N2
Time, t / sec. H2
Response (
R
/
R0
)
0.995 1.000 1.005 1.010 1.015 1.020 1.025 1.030 1.035
0 100% H2
N2
100% H2 100% H2
303 K (A)
sample (a)
Time, t / sec. H2
Response (
R
/
R0
)
0.995 1.000 1.005 1.010 1.015 1.020 1.025 1.030 1.035
0 100% H2
N2 N2 N2 N2
100% H2 100% H2 (B)
303 K sample (e)
500 400 300 200 100
500 400 300 200 100
Fig. 1 100% H2response transients of Pd-Cu-Si metallic glassy alloy thin
films at 303 K. (A) sample (a) Pd67:8Cu14:3Si17:9 and (B) sample (e)
Pd75:1Cu12:3Si12:6.R: electric resistance of the sample in 100% H2,R0:
electric resistance of the sample in 100% N2, Gas-changing interval was
60 s.
1.005 1.010 1.015 1.020 1.025 1.030 1.035
65
Pd (at%) H2
Response (
R
/
R0
)
(A)
1.005 1.010 1.015 1.020 1.025 1.030 1.035
10
Si (at%) H2
Response (
R
/
R0
)
(B)
(a) (c)
(e) (d)
(b)
(e) (d)
(b)
(c)
(a)
20 18 16 14 12
80 75
70
Fig. 2 100% H2response at 303 K as functions of (A) Pd content and (B)
Si content. Pd¼75:1{75:3at% Pd¼67:8at%
0 5 10 15 20 25 30 35 40
0.15
r / nm
RDF (
r
)
45 50
(c) (b) (a)
(d)
(e)
0.40 0.35 0.30 0.25 0.20
[image:3.595.334.517.75.427.2]Fig. 3 First peaks of radial distribution functions, RDF(r)s, of samples (a) to (e) measured in hydrogen desorbing condition.
Table 1 Composition and H2response (R=R0) at 303 K of fabricated thin
films.
Sample composition H2Response (R=R0) at 303 K (a) Pd67:8Cu14:3Si17:9 1.0079
(b) Pd75:1Cu6:6Si18:3 1.0244
(c) Pd67:7Cu18:2Si14:1 1.0178
(d) Pd75:3Cu10:3Si14:4 1.0296
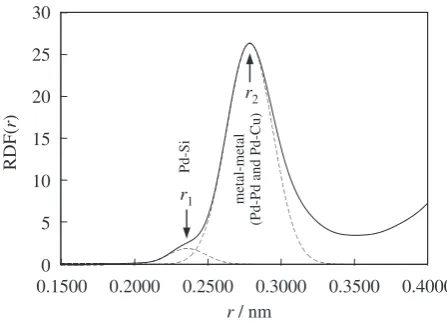
[image:3.595.45.291.95.182.2] [image:3.595.60.279.181.501.2] [image:3.595.329.521.474.690.2]the least square fitting with Gaussian functions. As an example of it, Fig. 4 shows the first peak of RDF(r) of sample (b) with two Gaussian peaks (positioned at r1 and r2) indicating by broken lines. The two Gaussian peaks (r1 and r2) are corresponding to Pd-Si and metal-metal (Pd-Pd and Pd-Cu) pair correlations, respectively. Pd-Cu-Si metallic glassy alloys have 6 kinds of pair correlations: Pd-Pd, Pd-Cu, Pd-Si, Cu-Cu, Cu-Si and Si-Si. However, we ignored the pair correlations of Cu-Cu, Cu-Si and Si-Si for the Gaussian peak-fitting, because their calculated weighting factors were negligibly small compared to those of the other pair correlations. The weighting factor (Wij) for the pair
correla-tion between ani-atom and aj-atom is defined as follows:13)
Wij¼
cicjfifj
hfi2
hfi2¼ X
i
cifi
!2
whereci and fi are the concentration and atomic scattering
factor of the component atomsi, respectively. For example, the weighting factors of sample (b) Pd75:1Cu6:6Si18:3 are calculated as follows: WPdPd¼0:784, 2WPdCu¼0:087,
2WPdSi¼0:116, WCuCu ¼0:002, 2WCuSi¼0:006 and
WSiSi¼0:004.
For dividing the first peak of RDF(r) into the Gaussian peaks corresponding to Pd-Pd, Pd-Cu and Pd-Si pair correlations, the positions of them should be fixed at first. The peak positions corresponding to pair correlations are defined as the atomic distances of the pair atoms. As for the atomic distances of Pd-Si and Pd-Pd, we used previous studies on the structure of Pd-Si amorphous alloys as a reference. The structural parameters reported by Fukunaga et al.9)and Ohkuboet al.10)are summarized in Table 2. The atomic distances of Pd-Si and Pd-Pd are 0.242–0.248 nm and 0.275–0.281 nm, respectively. Nij in Table 2 expresses
the coordination number of j-atoms around ani-atom. The atomic distance of Pd-Cu can be roughly estimated by calculating the sum of atomic radiuses of Pd atom and Cu atom. The atomic radiuses of Pd atom and Cu atom are
0.137 nm and 0.128 nm, respectively, thereby the atomic distance of Pd-Cu should be about 0.265 nm. Therefore, the Gaussian peak corresponding to Pd-Cu pair correlation should mainly belong to the r2-positioned peak in Fig. 4. However, we could not divide ther2-positioned peak into two Gaussian peaks corresponding to Pd-Pd and Pd-Cu pair correlations. The atomic distance of Pd-Pd is about 0.28 nm from the previous studies summarized in Table 2. The atomic distances of Pd-Pd and Pd-Cu are very close and additionally, WPdPd is much larger than WPdCu. Therefore, the Gaussian
peak of Pd-Cu will be so small that it will certainly be buried in the large peak of Pd-Pd completely. From this reason, we treated r2 as the Pd-Pd atomic distance, although the r2 -positioned peak was corresponding to metal-metal (Pd-Pd and Pd-Cu) pair correlations. The peak position (r1) was defined as the atomic distance of Pd-Si.
For dividing the first peak of RDF(r) into two Gaussian peaks, the peak position appearing at around 0.28 nm was assigned asr2at first and then, the Gaussian peak-fitting ofr2 was performed. After that, the Gaussian peak positioned at r1 was fitted at around 0.24 nm. The coordination numbers (NPdSi and NSiPd) were calculated using the area of the
Gaussian peak positioned atr1, weighting factors (WPdSiand
WSiPd) and the contents (Si content and Pd content). The
calculation method of them is explained in a reference.14)The structural parameters (r1,r2,NPdSi andNSiPd) of samples (a)
to (e) in hydrogen desorbing/absorbing condition were obtained by this procedure. They are summarized in Table 3. As we mentioned above, the peak positions (r1 andr2) are corresponding to the atomic distances (Pd-Si and Pd-Pd), respectively. Comparing the structural parameters in hydro-gen desorbing/absorbing conditions, we can see the peak position (r1), NPdSi and NSiPd are about the same values.
In contrast, a small change can be seen between their peak positions (r2).
3.3 Effect of the structural parameters on the H2
response
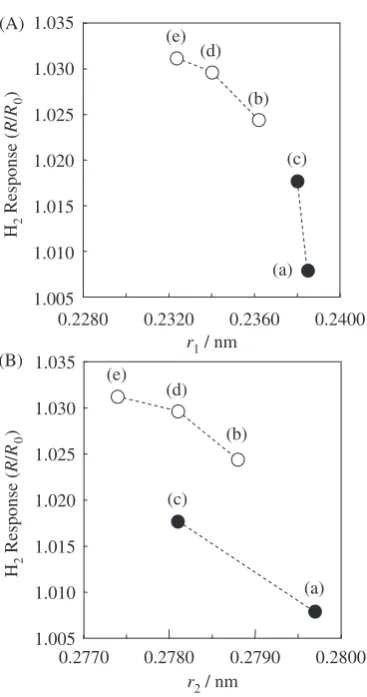
The H2responses againstr1andr2measured in hydrogen desorbing condition are plotted in Figs. 5(A) and (B), respectively. The described codes (a) to (e) are corresponding to the samples shown in Table 1. The data are classified into two sample groups according to Pd content (Pd¼75:1{ 75:3at% and 67.8 at%) to eliminate the strong effect of Pd content on the H2 response. By comparing the data in the same Pd content groups, it can be seen that the H2responses 0.1500
r / nm 0
5 10 15 20 25 30
RDF(
r
)
r1 r2
Pd-Si
metal-metal
(Pd-Pd and Pd-Cu)
0.4000 0.3500
0.3000 0.2500
0.2000
[image:4.595.55.279.72.234.2]Fig. 4 The first peak of radial distribution function, RDF(r), of sample (b) measured in hydrogen desorbing condition. Broken lines indicate the Gaussian peaks corresponding to the Pd-Si and metal-metal (Pd-Pd and Pd-Cu) pair correlations positioned atr1andr2, respectively.
Table 2 Structural parameters of Pd-Si amorphous alloys reported in previous studies.9;10Þ
measurement neutron diffraction9Þ electron diffraction10Þ
Glass sample Pd85Si15 Pd80Si20 Pd78Si22 Pd82Si18 Pd75Si25
Pd-Si atomic
distance/nm 0.242 0.242 0.243 0.242 0.248
NSiPd 7.3 6.6 6.3 9.1 8.8
NPdSi 1.2 1.6 1.8 2.0 2.9
Pd-Pd atomic
distance/nm 0.278 0.280 0.281 0.275 0.279
[image:4.595.304.551.93.207.2]decrease with increases inr1andr2. The H2responses against NPdSi andNSiPd measured in hydrogen desorbing condition
are plotted in Figs. 6(A) and (B), respectively, with data classification by Pd content. The H2responses decrease with increases inNPdSiandNSiPdin the same Pd content groups.
Concerning the effect of the structural parameters on the microstructure of Pd-based amorphous alloys, Fukunaga et al.9)have reported their study as follows. They supposed that with increasing Si content, the three-dimensional arrangement of neighboring Pd atoms around a Si atom was likely to become more trigonal prismatic coordination in Pd-Si amorphous alloys. And also, their obtained structural parameters, the atomic distances (Pd-Si and Pd-Pd) andNPdSi,
increase with increasing Si content. Consequently, it can be
stated that increases in the structural parameters with Si content suggests an increase in the number density of trigonal prisms. The obtained results in Figs. 2, 5 and 6 were considered on the basis of this theory by Fukunaga et al. In Fig. 2(B), the H2 response decreases with increasing Si content. Considering the positive correlation between Si content and the number density of trigonal prisms, it can be stated that the H2response has negative correlation with the number density of trigonal prisms. In Figs. 5(A) and (B) and Fig. 6(A), the H2 responses decrease with increases in the structural parameters (r1,r2andNPdSi). Because the structural
parameters have positive correlation with the number density of trigonal prisms, it also can be stated that the H2response 1.005
1.010 1.015 1.020 1.025 1.030 1.035
0.2280
r1/ nm H2
Response (
R
/
R0
)
(A)
(a) (c) (e)
(d)
(b)
1.005 1.010 1.015 1.020 1.025 1.030 1.035
0.2770
r2/ nm H2
Response (
R
/
R0
)
(B)
(a) (c)
(e) (d)
(b)
0.2800 0.2790
0.2780
0.2400 0.2360
0.2320
Fig. 5 100% H2response at 303 K as functions of peak positions, (A)r1
and (B) r2, of RDF(r)s measured in hydrogen desorbing condition.
Pd¼75:1{75:3at% Pd¼67:8at%
(e) (d)
(b)
(c)
(a)
2.0
NSiPd 1.005
1.010 1.015 1.020 1.025 1.030 1.035
H2
Response (
R
/
R0
)
(B)
0.2
NPdSi 1.005
1.010 1.015 1.020 1.025 1.030 1.035
H2
Response (
R
/
R0
)
(A)
(a) (c)
(e) (d)
(b)
7.0 6.0 5.0 4.0 3.0
1.8 1.6 1.4 1.2 1.0 0.8 0.6 0.4
Fig. 6 100% H2response at 303 K as functions of coordination numbers,
(A) NPdSi and (B) NSiPd, in hydrogen desorbing condition. Pd¼
[image:5.595.61.467.73.562.2]75:1{75:3at% Pd¼67:8at%
Table 3 Coordination number (Nij) and peak positions (r1andr2) of samples (a) to (e) calculated from RDF(r)s measured in hydrogen
desorbing/absorbing condition.
Sample composition in hydrogen desorbing condition in hydrogen absorbing condition
r1/nm NPdSi NSiPd r2/nm r1/nm NPdSi NSiPd r2/nm
(a) Pd67:8Cu14:3Si17:9 0.2385 1.5 5.7 0.2797 0.2385 1.5 5.8 0.2797
(b) Pd75:1Cu6:6Si18:3 0.2362 1.0 3.9 0.2788 0.2362 1.0 3.9 0.2791
(c) Pd67:7Cu18:2Si14:1 0.2380 1.1 5.5 0.2781 0.2380 1.1 5.4 0.2781
(d) Pd75:3Cu10:3Si14:4 0.2340 0.7 3.7 0.2781 0.2340 0.7 3.7 0.2784
[image:5.595.46.549.97.183.2] [image:5.595.77.261.207.556.2] [image:5.595.335.519.214.568.2]has negative correlation with the number density of trigonal prisms. Additionally, this negative correlation can be seen in Fig. 6(B). Samples (a) and (c) which showed lower H2 response in all samples indicatedNSiPd(in hydrogen
desorb-ing condition) of 5.7 and 5.5, respectively (see Table 3). These values are close to 6 of NSiPd of a trigonal prism
illustrated in Fig. 7(A).9) This result suggests that samples (a) and (c) have more trigonal prismatic structures than the other samples.
The negative effect of the trigonal prisms on the H2 response was considered on the standpoint of the crystal lattice structure. A H atom absorbed in Pd can occupy the octahedral interstitial site in fcc-Pd as illustrated in Fig. 7(B). In contrast, a trigonal prism has 6 Pd atoms at 6 vertices and a Si atom in its central hole as illustrated in Fig. 7(A). The trigonal prism has no interstitial site where a H atom can stably occupy because a Si atom occupy the central position of the prism, while fcc-Pd has octahedral interstitial site for occupying of a H atom. However, a Pd-Cu-Si metallic glassy alloy is supposed to have not only trigonal prisms but also disordered Pd atoms, clusters and nanocrystals. Pd-nanocrystals have the size of several nanometers to tens nanometers. Pd-clusters mean the clusters of several to several hundreds of Pd-atoms. Pd-clusters positively include the clusters of a Pd-crystal and a Pd-atom, and their size is far smaller than that of Pd-nanocrystals. H atoms are supposed to occupy the space between Pd atoms. Especially in the case of fcc-Pd, H atoms are supposed to occupy the octahedral interstitial site.
3.4 Change of structural parameters with hydrogen absorption
Figure 8 shows the shifts of the first peaks in RDF(r)s induced by absorbed hydrogen at 293 K. Solid lines and broken lines express the RDF(r)s of thin films measured in hydrogen desorbing (without H) and absorbing (with H) conditions, respectively. The peak positions are correspond-ing tor2which indicates the Pd-Pd atomic distance. Samples (a) and (c) which indicated lower H2response show less peak shifts. On the other hand, samples (b), (d) and (e) show the clear peak shifts though the shifts are very small.
The peak shift (r2) is defined as (r2 =r2 with Hr2 without H). The H2response is plotted against the peak shift in Fig. 9. From this figure, we can see the positive correlation
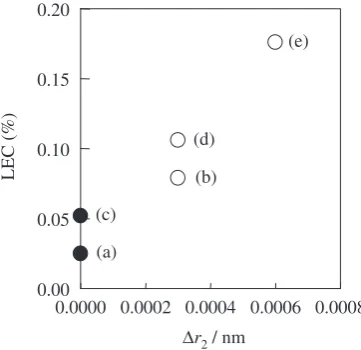
between the H2response andr2. As we mentioned above,r2 is defined as the Pd-Pd atomic distance. Therefore, the increase inr2caused by hydrogen absorption can be taken as the elongation of Pd-Pd atomic distance. The Pd-Pd atomic distance is thought to be elongated by the occupation of H atoms in the space between Pd atoms. The elongation of Pd-Pd atomic distances should lead to the volume expansion of thin films. The linear expansion coefficient (LEC) measured at 298 K is plotted againstr2 in Fig. 10, and it increases approximately linearly with increasingr2 as expected. (B)
(A)
Si atom Pd atom H atom
Fig. 7 Schematic illustrations of (A) trigonal prism9)(6 Pd atoms around a
Si atm) and (B) a H atom in octahedral interstitial site in fcc-Pd.
without H with H 10
15 20 25 30
0.2600
r2/ nm
RDF (
r
)
0 35 40
(a)
(b)
(c)
(d)
(e)
0.3000 0.2900
0.2800 0.2700
Fig. 8 Shifts of the first peaks in RDF(r)s induced by absorbed hydrogen at 293 K. Solid lines indicate RDF(r)s in hydrogen desorbing condition (without H). Broken lines indicate RDF(r)s in hydrogen absorbing condition (with H).
1.005 1.010 1.015 1.020 1.025 1.030 1.035
0.0000 H2
Response (
R
/
R0
)
Δr2/ nm (a)
(c)
(e) (d)
(b)
0.0008 0.0006 0.0004 0.0002
Fig. 9 100% H2response at 303 K as a function ofr2.r2=r2 with
[image:6.595.335.514.70.362.2] [image:6.595.68.274.72.210.2] [image:6.595.333.516.434.613.2]In Fig. 9, the correlation between the H2 response and r2 is not linear, because of the slight low value of the H2 response of sample (e), while the LEC andr2show linear positive correlation. The reason of the low H2 response of sample (e) can be explained by the mechanism which we have reported in the previous study.15) The mechanism is summarized as follows. The sample with high Pd/Si ratio (Pd/Si=5:96 in the previous study) has many Pd-nanocrystals in the amorphous matrix which probably includes Pd-clusters and disordered Pd atoms as well as trigonal prisms. When the sample is exposed in H2, the Pd-nanocrystals form the electric contacts with each other by the connection of volume expanded Pd-clusters induced by absorbed hydrogen, resulting in a decrease in the electric resistance. That is the conflicting behavior with an increase by hydrogenation of Pd. In this case, the H2 response takes lower value than that estimated from the hydrogenation of Pd, because the H2 response is derived from the sum of the electric resistances relating to the two conflicting behavior. Therefore, the sample with Pd-nanocrystals indicates the low H2response for the amount of absorbed hydrogen by it. Pd/Si ratio of sample (e) is larger than those of the other samples: Pd/Si = (a) 3.79, (b) 4.10, (c) 4.84, (d) 5.23 and (e) 5.96. On the other hand, LEC has linear positive correlation with the amount of absorbed hydrogen whether the Pd-nanocrystals exist or not. From this reason, sample (e) is supposed to indicate the low H2 response for its high LEC.
4. Summary
In this study, Pd-Cu-Si metallic glassy alloy thin films were fabricated by a sputtering method, and the correlations of the H2 response with the composition and the structural parameters based on the short-range order (SRO) were examined. Additionally, the change of structural parameters with hydrogen absorption was measured, and the correlations of the change with the H2response and the hydrogen induced
linear expansion coefficient (LEC) were examined. The obtained results are summarized as follows.
(1) The H2 response increased with increasing Pd content and decreased with increasing Si content.
(2) The H2 response decreased with increases in the structural parameters: the atomic distances (Si and Pd-Pd) and the coordination numbers (NPdSi and NSiPd). The
increases in Si content and the structural parameters can be related to an increase in the number density of trigonal prisms. Therefore, it can be stated that the H2 response and the amount of absorbed hydrogen have negative correlations with the number density of trigonal prisms. Possible explanation for this result is that the trigonal prism has no interstitial site where a H atom can stably occupy because of a Si atom occupying the central position of the prism. (3) The elongation of the Pd-Pd atomic distance with absorbing hydrogen was observed by the peak shift of RDF(r). From this result, H atoms are supposed to occupy the space between Pd atoms. The peak shift showed the positive correlations with the H2response and the hydrogen induced LEC. In other words, the Pd-Pd atomic distance increased with an increase in the amount of absorbed hydrogen to increase the volume expansion of thin films.
Acknowledgments
The authors would like to thank Dr. K. Ohara for his assistance in X-ray diffraction measurement. The synchro-tron radiation experiments were approved by the Japan Synchrotron Radiation Research Institute (proposal numbers: 2008B1074 and 2009A1078).
REFERENCES
1) U.S. Department of Energy: Fuel Cells, Technical Plan, Multi-Year Research, Development and Demonstration Plan (2007).
2) H. S. Chen and D. Turnbull: Acta Metall.17(1969) 1021–1031. 3) S. Kajita, S. Yamaura, H. Kimura, K. Yubuta and A. Inoue: IEE Trans.
SM128(2008) 225–229.
4) S. Kajita, S. Yamaura, H. Kimura and A. Inoue: Sens. Actuators B150 (2010) 279–284.
5) Y. Ohsumi:Hydrogen Storage Alloy, (AGNE Gijyutu Center, Tokyo, 2000) p. 72.
6) F. A. Lewis: The Palladium Hydrogen System, (Academic Press, London, 1967) p. 11.
7) R. Kirchheim, F. Sommer and G. Schluckebier: Acta Metall.30(1982) 1059–1068.
8) Y. S. Lee and D. A. Stevenson: J. Non-Cryst. Solids72(1985) 249– 266.
9) T. Fukunaga and K. Suzuki: Sci. Rep. Insts Tohoku Univ. A29(1981) 153–175.
10) T. Ohkubo, Y. Hirotsu and M. Matsushita: J. Electron Microsc.48 (1999) 1005–1013.
11) S. Kajita, S. Kohara, Y. Onodera, T. Fukunaga and E. Matsubara: Mater. Trans.52(2011) 1349–1355.
12) S. Kohara, M. Itou, K. Suzuya, Y. Inamura, Y. Sakurai, Y. Ohishi and M. Takata: J. Phys. Condens. Matter19(2007) 506101.
13) T. Fukunaga:JIM Seminar Text 73, (THE JAPAN INSTITUTE OF METALS, Japan, 1997) p. 107.
14) Y. Waseda and E. Matsubara:X-ray Structural Analysis, (UCHIDA ROKAKUHO PUBLISHING CO., LTD., Japan, 1998) p. 213. 15) S. Kajita, Y. Hasebe, T. Fukunaga and E. Matsubara: Mater. Trans.52
(2011) 1148–1155.
0.00 0.05 0.10 0.15 0.20
0.0000
LEC (%)
Δr2/ nm (c)
(a)
(d)
(b)
(e)
[image:7.595.77.258.73.248.2]0.0008 0.0006 0.0004 0.0002
Fig. 10 100% H2induced linear expansion coefficient (LEC) at 298 K as a
function ofr2.r2=r2with Hr2without H Pd¼75:1{75:3at%