Evolution of Mechanical Properties and Microstructures with Equivalent Strain
in Pure Fe Processed by High Pressure Torsion
Kaveh Edalati
*, Tadayoshi Fujioka and Zenji Horita
Department of Materials Science and Engineering, Faculty of Engineering, Kyushu University, Fukuoka 819-0395, Japan
Pure Fe (99.96%) was processed by high pressure torsion (HPT) using disc and ring samples. When the microhardness and tensile properties are plotted against the equivalent strain, the individual properties fall well on unique single curves, level off at the equivalent strain of
40. At the saturated level, the tensile strength of 1050 MPa and the elongation to failure of 2% are attained. Transmission electron microscopy showed that a subgrain structure containing dislocations develops at an initial stage of straining. More dislocations form within the grains and the subgrain size decreases with further straining. At the saturation stage, the average grain size reaches200nm, the misorientation angle increases and some grains which are free from dislocations appear. It is suggested that at the saturation stage, a steady state condition should be established through a balance between hardening by dislocation generation and softening by recrystallization. [doi:10.2320/matertrans.MD200812]
(Received July 8, 2008; Accepted October 3, 2008; Published November 19, 2008)
Keywords: severe plastic deformation, high pressure torsion, equivalent strain, iron, microhardness, tensile strength
1. Introduction
Processing via severe plastic deformation (SPD) has been an attractive research topic in recent years. The grain size is significantly refined through the SPD and thus superior mechanical properties are often observed in the SPD-processed metallic materials. Several techniques are avail-able for the SPD process but high pressure torsion (HPT) is especially effective to introduce extremely high strain and thus produce metallic materials having ultrafine grain sizes.1–3) The HPT process has advantages over other
techniques that it is applicable to hard and less ductile materials4) and also it is possible to consolidate powders
without heating.5)A major drawback of the HPT process is
that the sample is in a form of disc and the size of the disc is generally limited to10mm in diameter in order to keep a high applied pressure. Because the strain is generated in proportion to the distance from the disc center, an inhomo-geneous distribution of microstructure is developed across the diameter: coarser at the center because of lower strain but finer at the outer edge due to intense strain.6–10) In order to overcome this inhomogeniety of microstructure and resultant inhomogeniety of mechanical properties, a ring-shaped sample was introduced in the HPT process11)with a simple modification of the earlier design.12,13)Using the ring HPT, it is possible not only to eliminate a center part with a less-strained and coarse-microstructure region but also to increase the diameter of the sample by the amount corresponding to the center part.
The ring HPT was applied to pure Al11)and pure Cu14)and
it was demonstrated that the variation of hardness has a unique function of equivalent strain. It was also confirmed that the ultrafine-grained structures and mechanical proper-ties are homogeneous within the ring having 3 mm width. However, it was shown that the hardness variation with respect to the equivalent strain is very different between Al and Cu despite the fact that the purity level is the same and as
high as 99.99% for both metals. The difference in micro-structures and mechanical properties may be due to the difference in the melting point, the stacking fault energy and/or the crystal structure. In this study, therefore, the application of the ring HPT is extended to pure Fe having different physical properties than Al and Cu and the micro-structural evolution and mechanical behavior are examined with respect to equivalent strain as investigated earlier.
There are several studies reported on Fe by SPD.15–23) Although the studies on HPT of Fe15–20)are concerned with pure Fe (so called Armco iron), little information was given for the content of C except the studies of Todakaet al.16,20)It
appears that the C inclusion is sensitive to the strength and microstructure. It also appears that the strength is dependent on the total imposed strain and on the strain path for the grain refinement when Fe samples are processed by SPD. In fact, Wetscher and Pippan18)reported that the hardness is different
depending on whether it is rotated in a forward direction or a cyclic direction in HPT processing. In this study, the purity level of 99.96% with the C content of 11 ppm was used to minimize any possible effect of C. Furthermore, the hardness as well as the tensile properties including microstructure is examined in a wide range of equivalent strain with the single forward rotation so that the present results are directly compared with the earlier ones of pure Al and Cu.11,14,25,26)
2. Experimental Materials and Procedures
High purity iron (99.96%) of chemical composition given in Table 1 was received in a form of sheet with a thickness of 1 mm and an area of220mm150mm after rolling a billet from 90 to 3 mm at 1373 K by 12 passes and further reducing the thickness to 1 mm by one pass at room temperature. The sheet was cut to square pieces having dimensions of1mm
40mm40mm and annealed at 1273 K for one hour under pure argon atmosphere. Discs with 10 mm diameter and rings with inner and outer diameters of 24 and 30 mm were cut from these plates using a wire-cutting electric discharge machine and their thicknesses were further reduced to 0.8 mm by grinding.
*Corresponding author, E-mail: [email protected]. ac.jp
Special Issue on Severe Plastic Deformation for Production of Ultrafine Structures and Unusual Mechanical Properties: Understanding Mechanisms
HPT was conducted using the facilities as schematically illustrated in Fig. 1 for disc (left) and ring (right) samples. The facilities consist of upper and lower anvils having a shallow hole of 10 mm diameter and 0.25 mm depth for the disc sample. For the ring sample, the upper and lower anvils have a shallow circular groove with the inner and outer diameters of 24 and 30 mm with the groove depth of 0.25 mm. The hole on the anvil for the disc and the groove on the anvil for the ring were flat bottom which were roughened and subsequently nitrified to attain a surface roughness of
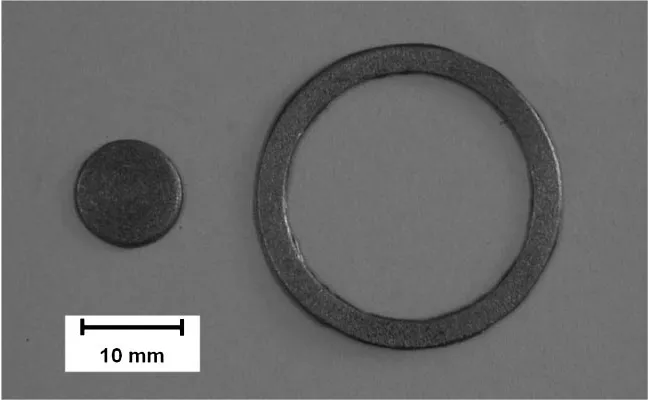
30mm. This surface roughness was confirmed by laser scanning microscopy at three different locations on the roughened surfaces of the anvils. Each sample was placed on the hole or on the groove and the upper and lower anvils were rotated with respect to each other at room temperature with a rotation speed of 0.2 rpm under a selected pressure of 2 GPa. The rotation was terminated after a revolution of either 1/8, 1/4, 1, 2, 4, 10 or 20. Figure 2 shows the appearance of disc and ring samples after HPT for one revolution. The surfaces
of the samples after HPT were in almost the same roughness as the roughened surface of the hole or the groove.
The disc and ring samples subjected to HPT were evaluated in terms of Vickers microhardness, tensile proper-ties and microstructures. First of all, both ring and disc samples were polished to a mirror-like surface and the Vickers microhardness was measured along the radii from the center to periphery at 8 different radial directions with 0.5 mm increments as drawn by dotted lines in Fig. 3. The disc and ring samples processed for one revolution were cut to half and, after polishing, the hardness was measured across the thickness at every 0.08 mm from the bottom surfaces of the samples. For each hardness measurement, a load of 200 g was applied for 15 seconds. Second, the disc and ring samples were ground and polished to reduce the total thickness to 0.3 mm. Thereafter, as illustrated in Fig. 3, miniature tensile specimens having 1 mm gauge length and 1 mm width were cut from both types of the samples using the wire-cutting electric discharge machine. Each tensile
Table 1 Chemical compositions of Fe (all compositions are in ppm except for Al which is given in mass%).
Element C Si Mn P S Cr Cu Mo V Nb Al Ti B N O
Amount 11 <30 <30 <20 <3 <30 <30 <30 <20 <30 0.03 <20 <2 8 14
Fig. 1 Schematic illustration of HPT facilities for (a) disc and (b) ring samples.
Fig. 2 Appearance of disc (left) and ring (right) samples after HPT for 1 revolution.
[image:2.595.135.459.324.525.2]specimen was mounted horizontally on grips and pulled to failure using a tensile testing machine with an initial strain rate of3:3103s1. The stress-strain curve was delineated
for each specimen and the ultimate tensile strength and elongation to failure were measured from the curves. To obtain the average, at least three tensile tests were repeated on the samples processed at the same HPT conditions. Third, discs with 3 mm in diameter were punched from the HPT discs at 2 mm away from the center and from the center of the ring width as also illustrated in Fig. 3. The 3 mm discs were ground mechanically to a thickness of 0.1 mm and further thinned for transmission electron microscopy (TEM) with a twin-jet electro-chemical polisher using a solution of 10 vol% HClO4 and 90 vol% CH3COOH at 298 K. A transmission
electron microscope was operated at 200 kV for the obser-vation of microstructures. Selected area electron diffraction (SAED) patterns were taken from a region with 6.3mm
diameter to complement the TEM observations.
3. Results and Discussions
Figure 4 plots microhardness as a function of distance from the centers of disc and ring samples after revolutions from 1/8 to 20. Microhardness increases with increasing distance from the center for the disc samples but the hardness is almost constant across the width for the ring samples. For both disc and ring samples, the microhardness increases with an increasing number of revolutions. The saturation of the hardness level appears in the disc samples after two or more revolutions and in particular the hardness values after 20 revolutions lie close to this saturated level.
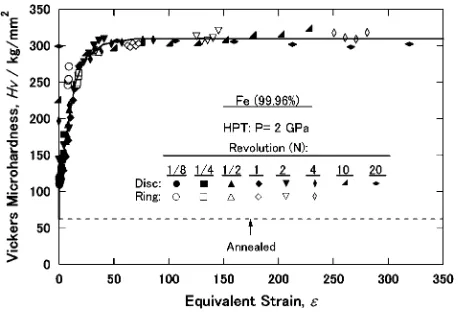
All hardness values in Fig. 4 are plotted as a function of equivalent strain in Fig. 5 as attempted in earlier pa-pers.8,13,14)Here, the equivalent strain is calculated using
"¼ ð1sÞ Z N
0
2r ffiffiffi
3
p
tðNÞdN ð1Þ
whereris the distance from the center of disc (or ring),Nis the number of revolutions,sis the fraction of sample slippage (withs¼0:17in this study) andtðNÞis the thickness of disc (or ring) representing as a function ofN. Using eq. (1), the
effects of thickness reduction and sample slippage are considered. The importance of this equation is given in the Appendix. It is found that for both disc and ring samples all data points fall well on a single curve. The hardness increases with an increase in the equivalent strain at an early stage of straining but levels off and enters into a steady state where the hardness remains unchanged with further straining. There are three points to be noted regarding the plots in Fig. 5.
First, although there is a certain deviation in hardness between the disc sample and the ring sample at low equivalent strain, overall consistency is well held for the two types of samples. Therefore, it is concluded that the ring-shaped sample is used as an alternative for the disc samples in HPT.
Second, despite the fact that the equivalent strain is theoretically zero at the center of disc according to eq. (1), close inspection of Fig. 4 reveals that the hardness at the disc center increases with increasing N, especially for the revolution greater than two. In practice, hardness measure-ment at the exact center is difficult but the hardness values were measured within a circular area with 0.2 mm in diameter. Furthermore, a small misalignment of the rotation axes between the lower and upper anvils may result in imposing an additional shear strain to the center of the disc, although the alignment was adjusted well within0:01mm in this study.
Third, the following important points arise from compar-isons with the plots of pure Al13) and pure Cu:14) (1) the
shape of the curve for pure Fe is similar to that for Cu but different than Al, (2) there is a hardness maximum in Al at an equivalent strain of 2 but no maximum appears in Fe and Cu, and (3) the saturation level at the steady state, where no change in hardness takes place with respect to the equivalent strain, begins at an equivalent strain of40for Fe but at equivalent strains of6 for Al and 15 for Cu, suggesting that the critical strain for the onset of steady state is higher for harder materials.
For the difference in the hardness behavior given above, the difference in melting temperatures may be considered. The melting temperatures are 1812, 1356 and 933 K for Fe, Cu and Al, respectively, and thus, the room temperature (298 K) corresponds to 0.16, 0.22 and 0.32 when normalized
Fig. 4 Vickers microhardness plotted against distance from center for disc and ring samples processed after various revolutions.
[image:3.595.313.542.71.227.2] [image:3.595.49.289.591.758.2]by each of the melting points. Compared with conventional deformation methods, the density of lattice defects such as dislocations are very high in the HPT deformed samples. It is reasonable to consider that dislocation recovery and recrys-talization begin at lower temperatures than that after conven-tional deformation. Recrystallization was observed in highly deformed Cu after annealing at a homologous temperature of 0.3.27,28)Therefore, it seems that the difference between Fe and Al can be attributed to recovery and recrystalization in Al samples after HPT processing because of its lower melting temperature.
Figure 6 plots hardness variations across the thickness of disc and ring samples after one revolution at the distances of 0, 2, 4 and 13.5 mm from the center. The hardness increases with an increase in the distance from the center in consistence with the plots in Fig. 4 and Fig. 5. However, it is almost constant across the thickness. These results demonstrate that the structure is homogenous across the specimen thickness.
Hardness variations are plotted in Fig. 7 with respect to the angle along the periphery at the mid width of ring samples (at
r¼13:5mm) after revolutions of 1/8 to 4. The hardness level increases asNincreases. It is also found that the angular variation is prominent for N<1 but it becomes less as
N1. This suggests that homogeneity is developed through-out the ring sample as the number of revolutions increases.
Some representative stress-strain curves are delineated in Fig. 8 from tensile testing of the disc and ring samples conducted at room temperature and at an initial strain rate of
3:3103s1. The tensile strength increases but the total
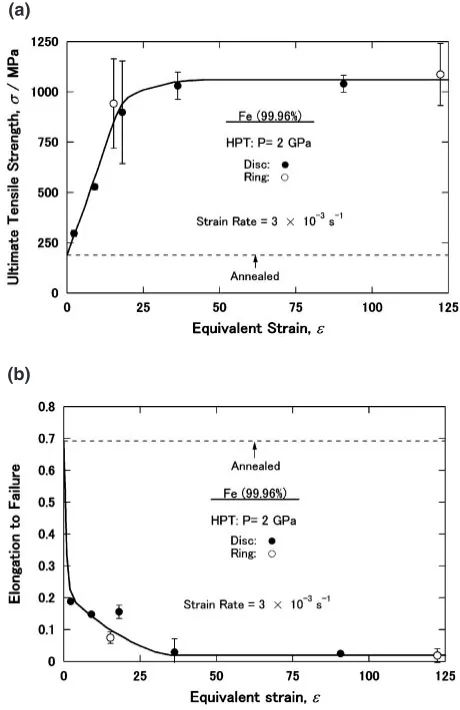
elongation to failure decreases with an increase in the equivalent strain. The variation with respect to the equivalent strain of (a) ultimate tensile strength and (b) elongation to failure are more clearly documented in Fig. 9 where the data
Fig. 6 Vickers microhardness plotted against height from bottom surface across thickness of disc and ring samples processed for one revolution at distances of 0, 2, 4 and 13.5 mm from center.
Fig. 7 Vickers microhardness plotted along periphery of ring samples at 13.5 mm from center of ring samples processed after various revolutions.
Fig. 8 Nominal stress versus nominal strain curves for annealed sample and some selected disc and ring samples processed to different equivalent strains.
(a)
(b)
[image:4.595.309.539.72.225.2] [image:4.595.55.284.287.443.2] [image:4.595.310.540.288.643.2]points indicate the average of three repeated measurements and the error bars represent the standard deviation of the averages. Figure 9(a) shows that the tensile strength in-creases with increasing the equivalent strain, levels off at an equivalent strain of 40and remains constant at 1050 GPa with a further increase in the equivalent strain. This trend is very similar to the hardness variation with respect to the equivalent strain as plotted in Fig. 5. In fact, all values of the tensile strength fall well on the single curve determined by the hardness measurement when the tensile strength () is converted to the hardness (Hv) through the relation as
¼3:5Hv where the factor, 3.5, is consistent with the factor, 3, accepted for the conversion. Figure 9(b) shows the variation of the elongation to failure with respect to the equivalent strain. The ductility decreases with an increase in the equivalent strain and it reaches the constant level of 2% at an equivalent strain of40.
The present study has shown that the hardness as well as the tensile strength at the saturated level shown in Fig. 5 and Fig. 9(a) is less than the values reported in earlier works of Fe.15–20) This can be attributed to the difference in carbon
contents in the materials employed in individual experiments. Although the C content was not described explicitly except the study of Todakaet al.,16)which is 0.03% C, it must have
been much higher than 11 ppm in the Fe used in this study. Very recently, Todakaet al.20)reported extraordinarily high
tensile strength in the same high purity Fe after processing by HPT. The enhancement results in almost twice when compared with the present tensile strength despite the fact that the hardness is in almost the same level as the preset study. Todaka et al. considered that the reason for the abnormal increase in the tensile strength may be attributed to anisotropic strengthening due to single directional
deforma-tion. It is considered that such an anisotropy may arise from a higher applied pressure as 5 GPa employed by Todakaet al.
This pressure is higher by 2.5 times than the present pressure 2 GPa and thus there can be a possibility that a strong anisotropic texture might have developed in the sample. Alternatively, the abnormal strengthening may be attributed to the difference in the tensile specimen geometry. While the thickness in this study is 0.3 mm, the one for the study employed by Todaka et al. is 0.6 mm. Although the gauge length is the same in both experiments as 1 mm, the difference in the thickness might have caused an enhanced strength. This reason may be probable because thicker specimens tend to lead to higher strength and higher ductility. More study is required for this clarification.
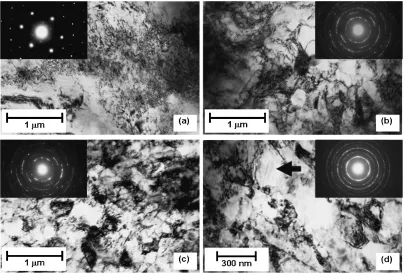
TEM observations are summarized in Fig. 10 where bright-field images and corresponding SAED patterns were taken from four samples subjected to different magnitudes of the equivalent strain: (a) "¼2:2 after processing a disc sample for 1/4 revolutions, (b) "¼15:3 after processing a ring sample for 1/4 revolutions, (c)"¼18:1after processing a disc sample for 2 revolutions, and (d) "¼122:4 after processing a ring sample for 2 revolutions. The first sample corresponds to an initial stage of the hardness increase, the second and third samples to a mid stage of the hardness increase, and the forth sample to a stage of the steady state. It is apparent from Fig. 10(a) that at"¼2:2the microstructure consists of subgrains with the average subgrain size of1mm
and there are many dislocations within the subgrains. Because of a net type of the SAED pattern, the boundary misorientation should be very low. In Figs. 10(b) and 10(c)
[image:5.595.96.501.72.346.2]"¼15:3 and 18.1, respectively, the subgrains become smaller to the size of 0:3mm having many dislocations within them and the boundary misorientation is increased
because the diffractions spots are now diffused around rings. In Fig. 10(d) at "¼122:4, the grains even become smaller to 0:2mmand some grain boundaries appear to be better defined. There are also grains with a low density of dislocations visible at the center of the micrograph as indicated by an arrow. This suggests that recrystallization may have taken place during or after HPT processing. The SAED pattern exhibits a complete form of rings, indicating that the microstructure consists of very small grains having high angles of misorientations.
Based on the TEM observations shown in Fig. 10 along with the variations of hardness and tensile properties given in Figs. 5, 8 and 9, the grain refinement of Fe may be deduced as follows. In the initial stage of straining, the number of dislocations increases as anticipated from the normal deformation mode and thus dislocation coalescence and subgrain formation occur. Consequently, pronounced strain hardening takes place due to increasing the stored energy through accumulation of dislocations. With further straining, the subgrain size decreases, the population of dislocations increases within the subgrains, the subgrain boundary width becomes better defined and the misorientation angle in-creases. Hanet al.19,21)reported similar results in high purity
Fe using the process of equal-channel angular pressing (ECAP). They found that the hardness increases significantly at the initial stages of straining due to an increase in dislocations and it increases slightly at subsequent stages where grains are refined significantly as a result of the rearrangement of dislocations.
When the dislocation accumulation reaches a critical level, the recrystallization is induced and the rate of strain hardening decreases. The process of this grain refinement is very similar to the one illustrated earlier for pure Cu during operation of HPT.14,25)At the saturation stage (steady state),
hardening occurs due to dislocation accumulation and grain refinement whereas softening occurs because of mutual anni-hilation of dislocations within grains and disappearance of dislocation through recrystallization. Because of the balance between the hardening and the softening, the hardness and strength remain constant at the steady state. Some studies report that the steady-state in SPD-processed materials is reached by annihilation of dislocations by dynamic recov-ery,29,30)whereas some other studies support that steady-state can be reached by dynamic recrystallization.18,31,32) The present experiment confirms that the latter idea is more appropriate for the mechanism of the steady state.
4. Conclusions
High pressure torsion (HPT) was conducted on pure Fe (99.96%) with the carbon content of 11 ppm using disc and ring samples. The following conclusions were reached:
(1) Ring samples can be used as an alternative for the disc samples to obtain a uniform structure throughout the samples.
(2) Data points of Vickers microhardness fall well on a single curve when plotted against the equivalent strain for both disc and ring samples. The hardness increases with increasing the equivalent strain at initial stages of straining, but saturates to a constant level at equivalent
strains higher than40. This behavior is very similar to the one observed in pure Cu.
(3) Ultimate tensile strength and elongation to failure can also be expressed by single functions of the equivalent strain.
(4) Dislocation density increases and the subgrain forma-tion and its refinement occurs at an early stage of straining, thereby increasing the hardness level. How-ever, at the saturation stage, a balance between the accumulation of dislocations and recrystallization is established so that a steady state appears where the hardness and tensile properties remains unchanged with straining.
Acknowledgements
This work was supported by a Grant-in-Aid for Scientific Research from the Ministry of Education, Culture, Sports, Science and Technology, Japan, in Priority Areas ‘‘Giant Straining Process for Advanced Materials Containing Ultra-High Density Lattice Defects’’. The pure Fe was supplied by Nippon Steel Corporation for the study of ‘‘Materials Science of Ultrahigh Plastic Strain’’ in Iron and Steel Institute of Japan (ISIJ). One of the authors (KE) would like to thank Islamic Development Bank for his scholarship.
Appendix
During operation of HPT, thickness reduction and sample slippage may occur so that a rigorous evaluation is required for both effects on the equivalent strain. The equivalent strain is estimated through the following form,7) provided that
neither thickness reduction nor sample slippage occurs.
"¼2rNffiffiffi
3
p
t ðA
:1Þ
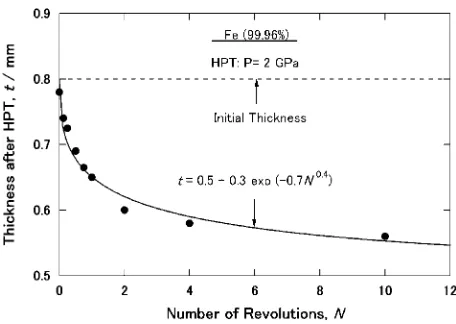
However, with the semi-constrained HPT system as illus-trated in Fig. 1, some material flows out and thus the sample thickness is reduced. Figure A·1 plots the thickness change with respect toN. The thickness decreases more significantly within the first few revolutions and gradually thereafter. The change may be approximated as a function of N in the following form.
[image:6.595.312.540.607.769.2]tðNÞ ¼0:5þ0:3 expð0:7N0:4Þ ðA:2Þ
The value of the first term, 0.5, arises because the thickness is never decreased below 0.5 mm because the hole depth of each upper and lower anvils is 0.25 mm in this study. Thus, the second term represents the reduction in thickness with sample revolution.
The slippage between the sample and anvil may also occur during HPT. The measurement of the slippage was under-taken by using samples that two straight lines were drawn along the diameters on both sides of the disc. After HPT operation, the discrepancy between the lines from the initial position was taken as the slippage. In this study, it turned out that the fraction was 0.17 and this fraction was kept almost constant withN.33)
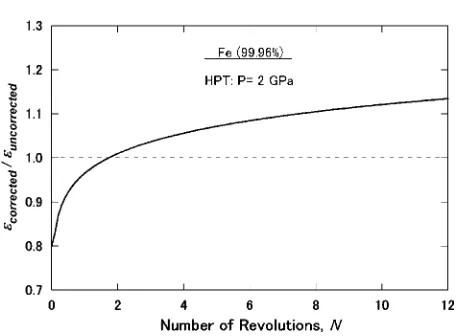
Now, considering the thickness reduction and sample slippage, eq. (A·1) may be modified to the form given in eq. (1). Thus, both effects were corrected in this study using eq. (1). Figure A·2 shows the ratio of the equivalent strain after correction through eq. (1) ("corrected) to the equivalent
strain without correction through eq. (A·1) ("uncorrected).
Because the thickness reduction and the sample slippage act in the opposite sense, both effects seem canceled out. This is demonstrated clearly in Fig. A·2 and it turns out that the equivalent strain calculated with the initial thickness without slippage correction is reasonably close to the one corrected through eq. (1).
REFERENCES
1) R. Z. Valiev, R. K. Islamgaliev and I. V. Alexandrov: Prog. Mater. Sci. 45(2000) 103–189.
2) R. Z. Valiev, Y. Estrin, Z. Horita, T. G. Langdon, M. J. Zehetbauer and Y. T. Zhu: JOM58(2006) 33–39.
3) Z. Horita, D. J. Smith, M. Furukawa, M. Nemoto, R. Z. Valiev and T. G. Langdon: J. Mater. Res.11(1996) 1880–1890.
4) C. Rentenberger, T. Waitz and H. P. Karnthaler: Mater. Sci. Eng. A462 (2007) 283–288.
5) I. V. Alexandrov, K. Zhang, A. R. Kilmametov, K. Lu and R. Z. Valiev: Mater. Sci. Eng. A234–236(1997) 331–334.
6) A. P. Zhilyaev, S. Lee, G. V. Nurislamova, R. Z. Valiev and T. G. Langdon: Scr. Mater.44(2001) 2753–2758.
7) F. Wetscher, A. Vorhauer, R. Stock and R. Pippan: Mater. Sci. Eng. A 387–389(2004) 809–816.
8) A. Vorhauer and R. Pippan: Scr. Mater.51(2004) 921–925. 9) G. Sakai, Z. Horita and T. G. Langdon: Mater. Sci. Eng. A393(2005)
344–351.
10) C. Xu, Z. Horita and T. G. Langdon: Acta Mater.55(2007) 203–212. 11) Y. Harai, Y. Ito and Z. Horita: Scr. Mater.58(2008) 469–472. 12) S. Erbel: Met. Techno.6(1979) 482–486.
13) I. Saunders and J. Nutting: Metal. Sci.18(1984) 571–575.
14) K. Edalati, T. Fujioka and Z. Horita: Mat. Sci. Eng. A497(2008) 168–173.
15) R. Z. Valiev, YU. V. Ivanisenko, E. F. Rauch and B. Baudelet: Acta. Mater.44(1996) 4705–4712.
16) Y. Todaka, M. Umemoto, J. Yin, Z. Liu and K. Tsuchiya: Mater. Sci. Eng. A462(2007) 264–268.
17) F. Wetscher, A. Vorhauer and R. Pippan: Mater. Sci. Eng. A410–411 (2005) 213–216.
18) F. Wetscher and R. Pippan: Philos. Mag.86(2006) 5867–5883. 19) B. Q. Han, E. J. Lavernia and F. A. Mohamed: Metall. Mater. Trans. A
34A(2003) 71–83.
20) Y. Todaka, Y. Miki, M. Umemoto, C. Wang and K. Tsuchiya: Mater. Sci. Forum584–586(2008) 597–602.
21) B. Q. Han, E. J. Lavernia and F. A. Mohamed: Metall. Mater. Trans. A 35A(2003) 1343–1350.
22) M. Sus-Ryszkowska, T. Wejrzanowski, Z. Pakieła and K. J. Kurzydłowski: Mater. Sci. Eng. A369(2004) 151–156.
23) S. V. Dobatkin, V. I. Kopylov, R. Pippan and O. V. Vasileva: Mater. Sci. Forum467–470(2004) 1277–1282.
24) N. Tsuji, Y. Ito, Y. Saito and Y. Minamino: Scr. Mater.47(2002) 893–899.
25) Y. Ito, Y. Harai, T. Fujioka, K. Edalati and Z. Horita: Mat. Sci. Forum 584–586(2008) 191–196.
26) Y. Ito and Z. Horita: Mater. Sci. Eng. A (2008) in press.
27) E. Schafler and M. B. Kerber: Mater. Sci. Eng. A462(2007) 139–143. 28) H. Jiang, Y. T. Zhu, D. P. Butt, I. V. Alexandrov and T. C. Lowe:
Mater. Sci. Eng. A290(2000) 128–138. 29) H. P. Stuwe: Acta Metall.13(1965) 1337–1342. 30) M. Zehetbauer: Acta Metall. Mater.41(1993) 589–599.
31) T. Hebesberger, H. P. Stuwe, A. Vorhauer, F. Wetscher and R. Pippan: Acta Mater.53(2005) 393–402.
32) N. Hansen: Metall. Mater. Trans. A32A(2001) 2917–2935. 33) K. Edalati, Z. Horita and T. G. Langdon: Scr. Mater.60(2009) 9–12. Fig. A2 Ratio of equivalent strain after correction through eq. (1) to
[image:7.595.55.287.63.231.2]