Dynamic Filling Characteristics of a Capillary Driven Underfill Process
in Flip-Chip Packaging
Seong Hyuk Lee
*, Hyung Jun Lee, Jong-Min Kim and Young Eui Shin
*School of Mechanical Engineering, Chung-Ang University, 221 Heuksuk-dong, Dongjak-gu, Seoul 156-756, Korea
This study investigates the dynamic flow characteristics of capillary-driven underfill flows in a flip chip package. In the present study, we used two different bump arrays using Sn-2.5Ag solder balls with 80mmand 100mmdiameters on commercially available flip chips, which have different pitches of 150mmand 180mm. First, we measured surface tension and viscosity with a rheometer and a tensiometer, respectively, and conducted an experimental visualization of the dynamic filling behavior of the underfill flows. From the captured images, we estimated the filling times, which can be affected by two important factors: bump arrangements and resin viscosities. In addition, we conducted a FVM (finite volume method)-based numerical simulation using commercial CFD code (Fluent v. 6.3.26), and compared its numerical results to both the experimental data and the analytical solutions given by the previous model described by Wanet al.(2005). The numerical predictions and analytical solutions estimating filling time were in good agreement with the experimental data, and the increase in spatial density of solder bumps allowed the flow to fill more slowly due to the increase in flow resistance. We conclude that the non-Newtonian characteristics and bump arrangement are very important factors in the design of flip-chip packaging. [doi:10.2320/matertrans.M2011151]
(Received May 19, 2011; Accepted August 3, 2011; Published September 14, 2011)
Keywords: underfill, flip-chip packaging, volume of fluid (VOF), computational fluid dynamics (CFD), encapsulation, filling time
1. Introduction
In recent years, flip-chip packaging technology has been regarded as one of the most promising interconnect methods because of the superior electrical performance such as the extremely small size, very high capacity, and short electrical connections between the chip and substrate. Since the flip clip’s invention, much effort has been made to satisfy more stringent requirements in electronic applications such as laptop personal computers, cell phones, and so on.1)Thermal mechanical stresses are the major problem in flip chip packaging technology; these stresses are caused by the mismatch of the thermal expansion coefficients of the silicon chip and the substrate, in turn caused by dimensional changes due to temperature variation. Significant thermal stresses in the solder joints occur during temperature cycling, ultimately resulting in fatigue cracking and electrical failure.2,3) To solve this problem, the simplest and most promising method is the underfill process, which fills the gap between the substrate and the chip with an appropriate material. This method can increase the mechanical durability of a flip-chip as well as its electrical quality as the chip size decreases. Additionally, ensuring accurate estimation and filling time control is one of the most important ways to prevent the underfill epoxy from hardening during the underfill process. Many researchers have attempted to examine the underfill flow characteristics. Shih and Young4) conducted experi-ments to investigate the effects of bump pitch and edge detour flow on the underfill encapsulation. Using the patterned bump array on a glass plate using lithography technology, they observed that the filling flow was affected by the bump pitch while the edge detour flow was strongly dependent on the dispensing arrangement. Lee et al.’s experiments5) used flow visualization techniques with pat-terned glass plates to examine the dynamic change of flow and meniscus during the underfill process. Han and Wang6)
reported a pressurized underfill encapsulation method in which the encapsulant is injected under high pressure into the mold surrounding and sealing the chip. In this method, the flow is generated by the pressure exerted from the inlet rather than from the surface tension at the flow-front. However, one of the major problems with this method is the presence of higher resistance to the mold flow; the flip-chip geometry traps air under the chip.
Meanwhile, some analytical models for predicting the filling time have also been suggested. The simplest model, the Washburn model,7)assumes that the capillary flow is a fully developed laminar flow of a Newtonian fluid between two parallel plates without solder bumps. Wan et al.8) modified the Washburn model to reflect the flow resistance due to solder bumps and used the power-law constitutive equation for describing the non-Newtonian fluid behavior. In a numerical simulation, Nguyenet al.9)ascertained the solder ball resistance of the underfill flow using the plastics integrated circuit encapsulation computer aided design (PLICE-CAD) and validated the results by comparison with experimental data. With CAE (computer-aided engineering) software, Shen et al.10)conducted various experiments and simulations to examine how underfill flows vary with injection temperature and injection pattern. Using different arrangements of solder balls, Khoret al.11,12)confirmed that a solder ball array influences underfill flows while injection orientation can lead to void formation.
Although many researchers have reported on the underfill flow characteristics experimentally and numerically, detailed three-dimensional flow analysis in commercially used flip-chips is still lacking. More sophisticated experimental and numerical models of the filling time are needed to help us design the flip-chip packaging process. Based on flow visualization and three-dimensional CFD simulation, the present study investigates the capillary filling behavior for two different flip-chips and uses measured viscosity to consider the non-Newtonian viscosity effect. Moreover, we examine the effect of solder bump arrangement and viscosity *Corresponding author, E-mail: [email protected], [email protected]
of the underfill epoxy on filling behavior and compare our new experimental and numerical results for the filling time with the analytical model proposed by Wanet al.2)
2. Experiment
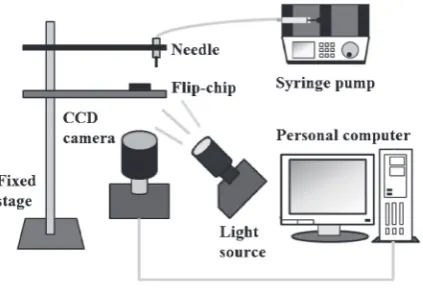
In the present experiment, two different flip-chips, FC1 and FC2, were made from a PCB-patterned chip and a glass plate with Sn-2.5Ag solder balls, which were bonded using a direct thermal bonding process as shown in Fig. 1. As listed in Table 1, the total chip size used in the present study was 55mm2, and the FC1 and FC2 flip-chips were made with different pitches of 180mm and 150mm, respectively. We used Sn-2.5Ag solder balls andNS indicates the number of solder balls in the chip. The FC1 chip (NS¼676) used a 2626arrangement (hole diameter, 100mm), whereas the FC2 chip (NS¼1024) had a3232pattern array with 85-mm-diameter solder balls. For these two cases, the volume fractions of the solder balls were 21% and 23%, respectively. A schematic of the experimental setup used for visualizing underfill flows is shown in Fig. 2. Underfill encapsulants (Model-1218 and Model-3536, provided by Emerson & Cuming, Co., and Loctite, Co., respectively) were dispensed by a syringe pump (LSP01-1A, LongerPump). Under controlled environmental conditions (temperature 23C, relative humidity 50%, and atmospheric pressure), 40mL of encapsulant was continuously injected for 120 s through the needle in the inlet region of the flip-chip board. To visualize underfill flows along the channel, we used a CCD camera (Xli, Meyer) with a resolution of 6mmper pixel. It is noted that the contact angles between the liquid and solid should be
carefully controlled because they significantly affect the underfill flow characteristics at the interfaces. For prelimi-nary tests, we used a pendant method to generate and dispense droplets of encapsulants with a custom injection system consisting of a flat-tipped metal hub needle (Gage 23, HAMILTON) and a syringe pump. We measured the contact angles of glass and silicon for different encapsulants using a Telecentric Lens (TEC-M55, Computar) with a2converter and a distortion angle of 0.3%. For the simulation, a contact angle of 65.2613)between the encapsulant fluid and a solder ball was used. We measured the surface tension with a tensiometer (Sigma 702, KSV Instrument Co.) using the Du-Nouy method with a platinum ring. Figure 3 presents the viscosity measured by a rheometer (ARES, TA Instruments, USA) as a function of shear rate for two different underfill resins. The Model-1218 fluid had almost the same viscosity over the whole shear rate range while Model-3536 displayed non-Newtonian characteristics. Thus, we modeled Model-1218 as a Newtonian fluid in the present numerical simulation. Conversely, we treated the Model-3536 as a non-Newtonian fluid and we used the following power-law model to express the non-linear behavior of its viscosity:
¼m_n1 ð1Þ
whereis the viscosity and_ indicates the shear rate. The constants mandn can be obtained by fitting the measured data. The physical properties of the underfill encapsulants used in the present study are summarized in Table 2. As listed in Table 3, we conducted experiments for four different cases using different flip-chips and underfill fluids to investigate the influence of solder ball arrangement and liquid viscosity on the dynamic filling characteristics.
3. Analytical Solutions and Numerical Modeling
Generally, underfill flows are characterized by and evaluated with three important factors: the filling time, the flow front position, and the spatial distributions. Among these, accurate predictions of filling time and front position are very important to making the underfill process more efficient and controllable. Much research6,8,14,15)has modeled the filling time on the basis of the Washburn model,7)which assumes a Newtonian fluid with one-dimensional, fully-developed laminar flow. According to the Washburn model, the filling time is given by,
(a)
(b) FC1 (c) FC2
Fig. 1 Bump arrangements.
Table 1 Flip-chip configuration.
Solder ball Solder ball Volume The number of
Chip Type diameter pitch fraction solder balls
d(mm) p(mm) (%) Ns
FC1 100 180 21 676ð2626Þ
FC2 85 150 23 1024ð3232Þ
[image:2.595.51.290.70.396.2] [image:2.595.322.534.72.218.2]tf ¼ 3xf 2
hcos; ð2Þ
whereis the surface tension coefficient andxf is the local flow-front position, andandhindicate the contact angle and the distance between two plates, respectively. The original Washburn model has two critical limitations: it intrinsically does not consider non-Newtonian characteristics of the encapsulant, nor does it model the effects of solder bump resistance. Thus, we used the analytical solutions proposed by Wan et al.8)to reflect both the geometric effects of the
solder ball arrangement and the non-Newtonian fluid char-acteristics and then compared these analytical solutions and numerical results with experimental data. According to the Wanet al.model,8)the filling time is given by
tf ¼2nþ1
nþ1
mhWðWþdÞ
2cosðW2þWdhdÞ
1
n 2x
h
nþ1
n ; ð3Þ
whereW is the clearance between two adjacent solder joints and d is the solder ball diameter. The indices m and n represent the coefficient and the index of the power-law viscosity relationship, respectively. As previously noted, these indices were determined by measuring the viscosity in the present study.
In fact, the spatial distributions and transient evolution of fluid flows are very useful in optimizing the flip-chip package process control. Thus, under the assumption of incompres-sible laminar flows, we numerically solved the following set of governing equations for continuity and momentum of fluids:
@
@t þ r ð ~uuÞ ¼0 ð4Þ
@
@tð~vvÞ þ r ð~vvvv~Þ ¼ rpþr
2vv~þ~gg; ð5Þ
where is the density of the encapsulant. To capture the interfacial boundary between the encapsulant and air, the scalar q is used to determine the interface between two phases for theqthfluid’s volume fraction in the cell. Thus,
q takes the value of unity (q¼1) for a cell containing only liquid while a value of zero indicates a cell contains only air. The interface tracking between dissimilar phases is given by solving the following equation:
@
@tðqqÞ þ r ðqqvvq~Þ ¼0: ð6Þ
Using commercial computational fluid dynamics (CFD) code (Fluent V. 6.3.26), we obtained numerical solutions of the flow distribution with respect to time and analyzed the flow-front position and filling times for different fluid viscosities and bump arrangements. A computational grid system with solder balls, which was made by Pro Engineer (V. 5.0) and ICEM-CFD software (ANSYS), is shown in Fig. 4. The upper and bottom surfaces represent a glass and a printed circuit board (PCB), respectively, and they are treated as the no-slip boundary condition with the measured contact angles. We also used zero-pressure condition to describe the capillary effect at the inlet surface, and for all other sides were treated as the wall boundary condition. The measured contact angles considered for calculation are shown in Table 2. In addition, we used an open boundary condition with a zero pressure gradient at the outlet surface as shown in Fig. 4.
Shear rate, γ/s-1
V
iscosity
,
μ
/P
a-s
20 40 60 80
1 1.1 1.2 1.3 1.4 1.5
Model 1218 (a)
Shear rate, γ/s-1
V
iscosity
,
μ
/P
a-s
20 40 60 80
1.5 1.6 1.7 1.8 1.9 2
Model 3536 (b)
[image:3.595.50.551.86.141.2]Fig. 3 Measured viscosity and non-Newtonian characteristics of (a) MODEL 1218 (Emerson and Cuming Co.) and (b) MODEL 3536 (Henkel Co.).
Table 2 Material properties of the underfill encapsulant.
Model Surface tension Density Viscosity Contact angle Contact angle Power law index
(N/m) (kg/m3) (cps) (glass) () (silicon) ()
m n
Model 1218 0.051 1103 1118 39.42 40.82 1.12 1.0
[image:3.595.75.260.169.512.2]Model 3536 0.044 1317 1748 19.95 22.46 1.75 0.99
Table 3 Experimental cases of the present study.
Underfill encapsulant MODEL 1218
Underfill encapsulant MODEL 3536
2626chip Case 1 Case 3
[image:3.595.46.290.584.636.2]4. Results and Discussion
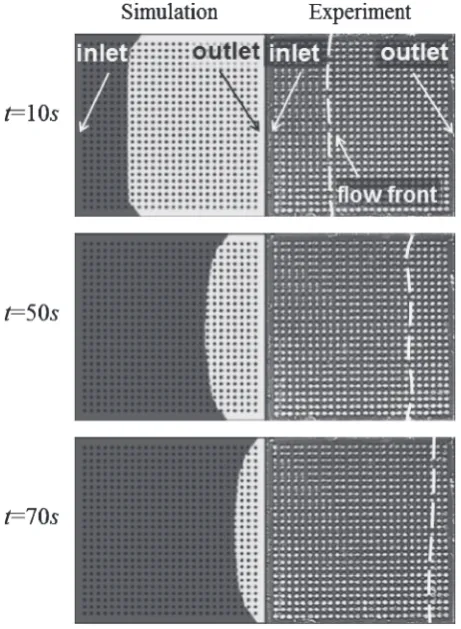
Figure 5 compares the numerical predictions with exper-imental data for the underfill flow distributions of Case 1. The small circles represent the solder bumps. The black zone shows the encapsulant filling in space and the dashed lines indicate the local flow-front interfaces between fluid and air. The numerical predictions are in fairly good agreement with the experimental measurement. In fact, after being dispensed from the nozzle, the liquid flow was generated by capillary force. Also, since solder balls resist the flow and act as obstacles, the speed of the filling process increases in the bump-free regions near the edges of the chip; this phenom-enon is referred to as the local edge effect. This tendency of the numerical results is similar to that reported in the previous literature.10–12) In the experimental observation of the
encapsulant, however, there was no edge effect; no locally faster movement was observed near the edge of the chip.
[image:4.595.50.289.75.185.2]Most CFD simulations use the equilibrium contact angles to calculate the surface tension forces exerted on dissimilar materials. However, during flow propagation, the contact angle varied dynamically depending on the flow character-istics. Thus, we conjecture that this difference (i.e., that fact that we did not observe the local edge effect) was due to the absence of information on dynamic contact angles. Because the measurement of the dynamic contact angle is very difficult, this problem actually still remains. To resolve it, a more elaborate study should be conducted in order to obtain detailed information on the dynamic contact angle with respect to time during the encapsulation process.
Figure 6 presents the transient behavior of the filled volume fraction for the cases listed in Table 2, and compares the numerical predictions and analytical solutions from Wan
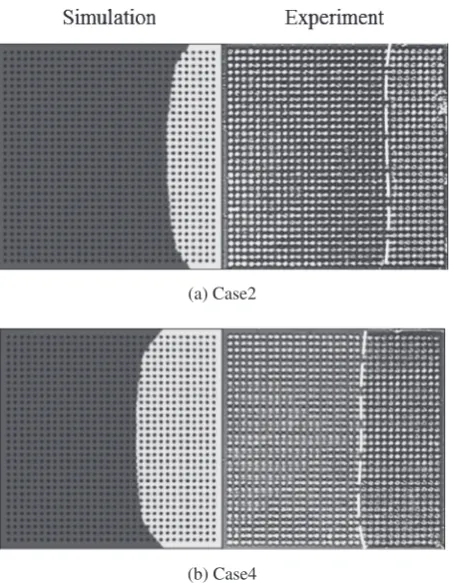
et al.’s model8)with the experimental data. Agreement was quite good, although some deviation was evident in the later stage of injection in Case 1. This indicates that Wanet al.’s model,8)which considers the non-Newtonian behavior and the geometrical effect, is suitable for estimating the filling time in the design of flip-chip packaging. The bump arrangement effect on the flow distributions at t¼50s is shown in Fig. 7. As the spatial density of solder bumps increased, the flow filling speed decreased due to the increase in flow resistance. The effect of fluid viscosity on the underfill flows att¼70s is shown in Fig. 8. The numerical and experimental results were in good agreement; as the viscosity increased, so did the flow resistance, and con-sequently the slower propagation of encapsulant flows in the chip was observed.
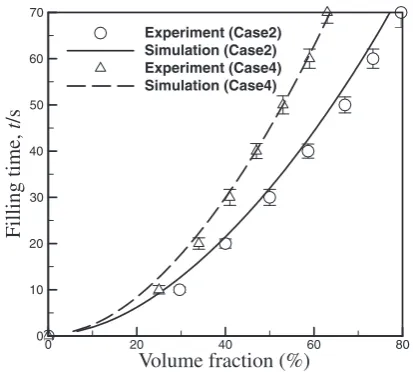
Next we considered the variation of filling time with the respect to volume fraction, comparing numerical predictions with the experimental results in Figs. 9 and 10. As shown in the previous figures, the qualitative flow tendency predicted by the numerical simulation was very similar to that determined experimentally, whereas some differences in the quantitative comparison were observed (Fig. 9). In particular, non-linear patterns, which were clearly due to the non-Newtonian fluid characteristics, were seen in the early stage of the underfill process. In fact, there is clearly a variation in viscosity during the underfill process.16) Our results suggest that the underfill flow is mainly driven by capillary pressure and consequently fluid velocity and shear rate decrease with time. At the early stage of the filling process, therefore, the viscosity decreased with time due to the shear thickening characteristics. For a relatively higher viscosity (Case 4), the filling time increased compared to that of a lower viscosity encapsulant (Case 2), as shown in Fig. 10. The difference in filling time between these two cases rapidly increased with time. For instance, to reach a 60% volume fraction during the encapsulation process, a 50% additional filling time would be required. In the early stage of encapsulation, the capillary force is important, but as time goes on, the viscosity-induced flow resistance increas-ingly affects the underfill flow propagation. Thus, the present results show that the encapsulant viscosity and the bump arrangement are very important factors in designing the underfill process in flip-chip packaging.
Fig. 4 Computational grid system for the CFD simulation.
[image:4.595.53.284.227.542.2]Time, t/s
V
olume fraction (%)
0 10 20 30 40 50 60
0 20 40 60 80
Experiment Simulation Theory
Time, t/s
V
olume fraction (%)
0 10 20 30 40 50 60 70 0
20 40 60 80
Experiment Simulation Theory
(a) Case 1
Time, t/s
V
o
lume fraction (%)
0 10 20 30 40 50 60 70 80 90 0
20 40 60 80
Experiment Simulation Thoery
Time, t/s
V
o
lume fraction (%)
0 10 20 30 40 50 60 70 80 90 100 110 0
20 40 60 80
Experiment Simulation Theory
(c) Case 3
(b) Case 2
(d) Case 4
Fig. 6 Comparison of the measured and predicted results with the theoretical estimation.
(a) Case1
(b) Case2
Fig. 7 Influence of bump arrangement on the filling behavior att¼50s.
(a) Case2
(b) Case4
[image:5.595.134.462.71.400.2] [image:5.595.315.540.475.767.2] [image:5.595.54.284.480.769.2]5. Conclusions
We reported on the dynamic filling time characteristics of capillary force driven underfill flows for different encapsu-lants and bump arrangements. Three-dimensional CFD simulations and experiments were conducted and compared to the analytical solutions of Wanet al.’s model.8)Based on the results, we concluded the following:
(1) The CFD simulation results of filling time showed fairly good agreement with experimental measurement and analytical solutions. Consequently, Wanet al.’s model8) would be useful in the design of flip-chip packaging since it can effectively describe both non-Newtonian behavior and geometrical effects.
(2) Regarding the bump arrangement and viscosity effects on the flow distributions, an increase in the spatial density of solder bumps slowed flow filling due to the increase in flow resistance. Also, the flow resistance increased with the increase in viscosity and
conse-quently we observed the slower propagation of encap-sulant flow in the chip.
(3) Especially in the early stage of the underfill process, non-linear patterns resulting from the non-Newtonian fluid characteristics could be clearly seen. This supports the conclusion that the underfill flow was basically driven by capillary pressure, since the viscosity de-creases with time due to shear thickening, and the capillary force is dominant in the flow inside the flip chip. However, the underfill resin propagation was dominated by the viscous flow resistance as the flow propagated in the chip. Thus, we confirmed that the viscosity of the encapsulant and the bump arrangement are very important factors in controlling the underfill process of flip-chip packaging.
(4) We did not observe any edge effect to suggest that the encapsulant flowed faster in bump-free regions near the edge of the flip chip. This problem was due to the fact that the present CFD simulation does not consider the dynamic variation in contact angle, which can be affected by the liquid flows and interfacial phenomena among different phases. More elaborate numerical modeling techniques including detailed interfacial contact phenomena should be developed on the basis of experimental measurements.
Acknowledgements
The authors gratefully acknowledge the financial support from Seoul R&BD Program (10890), Korea.
REFERENCES
1) C. P. Wong and M. M. Wong: IEEE Trans. Compon. Pack. Technol.22
(1999) 21–25.
2) J. W. Wan, W. J. Zhang and D. J. Bergstrom: Microelectron. J.38
(2007) 67–75.
3) Z. Zhang and C. P. Wong: IEEE Trans. Adv. Pack.27(2004) 515–524. 4) M.-F. Shih and W.-B. Young: Microelectron. Reliab.49(2009) 1555–
1562.
5) S. H. Lee, J. Sung and S. E. Kim: Microelectron. Reliab.50(2010) 2078–2083.
6) S. Han and K. K. Wang: IEEE Trans. Compon. Pack. Manuf. Technol. B20(1997) 424–433.
7) E. W. Washburn: Phys. Rev.17(1921) 273–283.
8) J. W. Wan, W. J. Zhang and D. J. Bergstrom: IEEE Trans. Adv. Pack.
28(2005) 481–487.
9) L. Nguyen, C. Quentin, P. Fine, B. Cobb, S. Bayyuk, H. Yang and S. A. Bidstrup-Allen: IEEE Trans. Compon. Pack. Technol.22(1999) 168– 176.
10) Y. K. Shen, S. T. Huang, C. J. Chen and S. Yu: Int. Commun. Heat Mass Transf.33(2006) 151–157.
11) C. Y. Khor, M. Z. Abdullah, M. Abdul Mujeebu and F. Che Ani: Int. Commun. Heat Mass Transf.37(2010) 281–286.
12) C. Y. Khor, M. Z. Abdullah, M. Abdul Mujeebu and F. Che Ani: Microelectron. Reliab.50(2010) 98–105.
13) S.-W. Peng and W.-B. Young: IEEE Trans. Electron. Pack. Manuf.33
(2010) 122–128.
14) Y. Guo, G. L. Lehmann, T. Driscoll and E. J. Cotts: Proc. 49th Electronic Components and Technology Conference (ECTC), (State University of New York Press, Binghamton, 1999).
15) J. Wang: Microelectron. Reliab.42(2002) 293–299. 16) W. B. Young: Microelectron. Reliab.50(2010) 995–999.
Volume fraction (%)
Filling time,
t
/s
0 20 40 60 80
0 10 20 30 40 50 60 70
Experiment (Case1) Simulation (Case1) Experiment (Case2) Simulation (Case2)
Fig. 9 Effects of the solder ball arrangement on the filling times for FC1 and FC2 (using the Model 1218 underfill material).
Volume fraction (%)
Filling time,
t
/s
0 20 40 60 80
0 10 20 30 40 50 60 70
[image:6.595.67.275.70.257.2]Experiment (Case2) Simulation (Case2) Experiment (Case4) Simulation (Case4)
[image:6.595.65.272.306.492.2]