Selective Dissolution of Pt
Co Binary Alloys and Surface Enrichment
of Platinum in Sulfuric Acid Solution
Azusa Ooi
1,+1, Yoshinao Hoshi
2,+2, Eiji Tada
1and Atsushi Nishikata
11Department of Chemistry and Materials Science, Tokyo Institute of Technology, Tokyo 152-8550, Japan 2Department of Metallurgy and Ceramics Science, Tokyo Institute of Technology, Tokyo 152-8550, Japan
The selective dissolution of cobalt and the consequent surface enrichment of platinum in PtCo binary alloys immersed in 0.5 mmol·m¹3 H2SO4at 298 K were investigated. Four different PtCo alloy thinfilms with various Pt contents, deposited on glassy carbon sheets by physical vapor deposition, were investigated: 51 at%Pt (Pt51Co49), 43 at%Pt (Pt43Co57), 28 at%Pt (Pt28Co72), and 24 at%Pt (Pt24Co76). When the thinfilms were immersed for 24 h in a 0.5 mmol·m¹3H
2SO4solution, a Pt-enriched layer was formed on the surface of all the alloys due to Co-selective dissolution. The enriched layer formed in the higher-Pt alloys (Pt51Co49and Pt43Co57) significantly suppressed further dissolution, whereas the lower-Pt alloys (Pt28Co72and Pt24Co76) exhibited more extensive selective dissolution and roughened surfaces. In this study, the selective dissolution and surface morphology of the PtCo alloys are discussed on the basis of these experimental results.
[doi:10.2320/matertrans.M2014107]
(Received March 25, 2014; Accepted May 21, 2014; Published July 11, 2014)
Keywords: selective dissolution, platinumcobalt binary alloy, proton exchange membrane fuel cell, platinum-enriched layer, inductively coupled plasma mass spectroscopy, electrochemical surface area
1. Introduction
Proton exchange membrane fuel cells (PEMFCs) are considered to be an alternative clean energy conversion device because of their low operating temperature and portability.1)A Pt catalyst is used in the cathode of a PEMFC
to enhance the oxygen reduction reaction (ORR); however, Pt is very expensive and its resources are limited. Thus, a reduction in the amount of Pt catalyst used in PEMFCs is required. Toward this end, Pt transition-metal (PtM) alloy catalysts have attracted attention because they exhibit higher ORR activity than Pt catalysts.29) The mechanism of the
enhanced ORR activity is explained by the shift in d-band center in the outermost Pt layers (i.e., the ligand effect)27) and by induced strain in the Pt-enriched shell (i.e., the geometric effect).8,9)
However, in PEMFCs, performance loss from the degradation of the catalyst is a major issue.1,1013) The degradation of the catalyst is caused by Ostwald ripening via Pt dissolution and coalescence of Pt nanoparticles in pure Pt catalysts.1419)In addition, for PtM alloy catalysts, selective
dissolution of M occurs and the dissolved M ions lead to performance loss.1,20,21)
Pickering et al. investigated the dissolution behavior of various binary alloys and classified it into two forms: selective dissolution and simultaneous dissolution. These behaviors were explained on the basis of the difference in the standard electrode potential between two metals and their chemical compositions.2227) In the case of Pt alloys that contain Co, Ni, or Cu, selective dissolution is expected because of the large potential difference between these elements and Pt. Hoshi et al. focused on the selective dissolution of M from PtM alloys and performed immersion tests in 0.5 mmol·m¹3 H
2SO4(acid treatment) for equimolar
PtM alloys (M: Cu, Co, Ni, or Fe) prepared by arc-melting. They showed that a Pt-enriched layer is formed on the surfaces of PtM alloys because M selectively dissolves from PtM binary alloys.28)They further investigated the composi-tional effect on selective dissolution behavior using three different PtCo alloy compositions (Pt: 50, 40, and 30 at%)29)
in detail. They concluded that in the case of Pt50Co50 and
Pt40Co60 alloys, a Pt-enriched layer was formed and
suppressed further selective dissolution of Co from the matrix; however, in the case of the Pt30Co70 alloy, the
selective dissolution continued after the Pt-enriched layer formed on the alloy surface. They explained this difference on the basis of the number of Co atoms exposed to the electrolyte. However, the change in surface morphology due to selective dissolution is not well understood, and the detailed mechanism of the selective dissolution and conse-quent Pt-enrichment was not sufficiently discussed in the previous study.28,29)In this work, we prepared four different PtCo binary alloy thinfilms that varied in Pt content (51, 43, 28, and 24 at%) by PVD. We investigated the selective dissolution of Co and the formation of the Pt-enriched layer on the thinfilms and compared the results with those for the bulk alloys.29)Furthermore, we proposed a detailed
mechan-ism on the basis of the experimental results.
2. Experimental
2.1 Sample preparation
PtCo binary alloy thinfilms with different compositions and a pure Pt thinfilm were fabricated on glassy carbon (GC) sheets by physical vapor deposition (PVD, ULVAC, Inc., VPC-1100) and their thicknesses were controlled between 150200 nm by a quartz crystal microbalance controller (ULVAC, Inc., CRTM-6000G). The chemical composition of the alloys was varied by changing the mass ratio of Pt wire (99.98 mass%) and Co wire (99.998 mass%) used during the deposition process. The deposited thin-film samples were vacuum-encapsulated in a silica glass tube at 2.7©10¹3Pa, +1Graduate Student, Tokyo Institute of Technology
+2Present address: Department of Industrial Chemistry, Faculty of Science
and Technology, Tokyo University of Science, Noda 278-8510, Japan
homogenized at 873 K for 24 h, and cooled in the furnace. To eliminate oxide layers formed during the heat treatment, the sample surface was dry-polished by sputtering via glow discharge optical emission spectroscopy (GD-OES, HORIBA/Jobin Yvon, JY-5000RF).
The morphologies of the sample surfaces were investigated by field-emission scanning electron microscopy (FE-SEM, JEOL Ltd., JSM-7000F) and the photographs were obtained at a 1.2 kV accelerating voltage. The results are presented in Fig. 1. The polished surface morphology of the PVD sample showed that PtCo particles were aggregated on the GC substrate and the average grain size was more than 100 nm, but continuously covered the substrate.
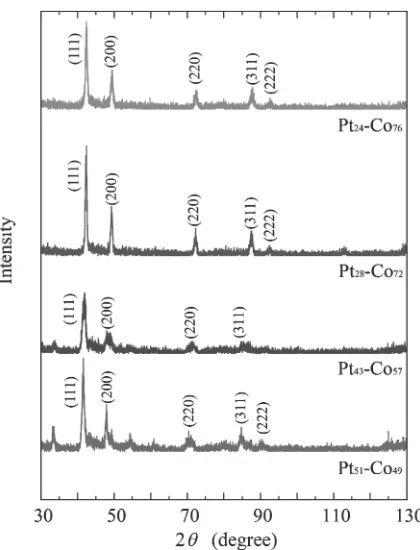
2.2 XRD measurements
The chemical composition of the PtCo binary thinfilms prepared by PVD was determined by X-ray diffraction (XRD, PANalytical B.V., X’pert PRO MRD). First, a standard curve of the lattice constant vs. the chemical composition was constructed from the XRD patterns of the bulk PtCo binary alloys, 50 at% Pt (Pt50Co50), 40 at% Pt
(Pt40Co60), and 30 at% Pt (Pt30Co70), prepared by arc
melting and from the pattern of bulk pure Pt. The relationship between the lattice constantain nm and the Pt contentxPtin
at%is given by eq. (1):
a¼0:00032xPtþ0:36108 ð1Þ Figure 2 shows the XRD profiles of PtCo thin films prepared by PVD. These diffraction profiles show only typical face-centered cubic peaks in each sample, which demonstrates that the PtCo specimens were single-phase and polycrystalline. On the basis of eq. (1), the chemical compositions of the PVDfilms were determined to be Pt51 Co49, Pt43Co57, Pt28Co72, and Pt24Co76.
2.3 Electrochemical measurements
Electrochemical measurements were performed at 298 K in an aerated 0.5 mmol·m¹3 H
2SO4 solution, using a
two-compartment Teflon cell.28,29)The solution was prepared by
diluting special-grade sulfuric acid with deionized water (resistance>18 M³). The alloy thinfilms with a geometric
surface area of 0.13 cm2were used as working electrodes. A
KCl-saturated silver/silver chloride electrode (SSE) was used as the reference electrode, and was connected in double junction to the test solution to prevent chloride contamination of the electrolyte. A gold wire was used as the counter electrode. In this paper, all the potentials are reported against the standard hydrogen electrode (SHE).
Immersion tests were conducted in 0.5 mmol·m¹3 H2SO4
at 298 K for 24 h. Rest potential was monitored during the immersion tests. After the immersion tests, cyclic voltam-metry (CV) was performed for 10 cycles between 0 and 1.4 V at 100 mV/s. The dissolved Co ions in the test solution were quantitatively evaluated by inductively coupled plasma mass spectroscopy (ICP-MS, Agilent Technologies, 7700x).
3. Experimental Results and Discussion
3.1 Effect of Pt content on the selective dissolution of Co The changes in rest potential, Erest, of the Pt and PtCo
alloy thinfilms during the 24 h immersion tests are presented in Fig. 3. TheErestfor pure Pt was very stable at 0.798 V. The
Erestfor Pt51Co49and Pt43Co57were slightly lower than that
for pure Pt at the initial stage of immersion and finally became 0.785 and 0.796 V, respectively. Their values are very similar to that of pure Pt, indicating that a Pt-enriched layer is formed during the initial stage and strongly suppresses the selective dissolution of Co, although they are lower than those of the previous bulk samples.29)We cannot explain this difference so far, but they exhibited good reproducibility. On the other hand, the changes in the Erest for Pt28Co72 and
Pt24Co76 differed substantially compared to those for Pt51
Co49 and Pt43Co57. The initial potential for Pt28Co72 and
Pt24Co76was very low compared to that for the three other
Fig. 1 FE-SEM images of the surface of the PtCo binary alloy thinfilm deposited onto GC by PVD after GD-OES.
[image:2.595.322.532.66.341.2] [image:2.595.55.285.69.243.2]alloyfilms. TheErestshifted in the negative direction during
the initial stage, followed by a positive shift. The negative shift was not reproducible, probably because theErestis very
sensitive to the initial surface state of the alloys. A similar potential change was also observed for bulk equimolar PtNi alloy in 0.5 mmol·m¹3H2SO4.28)Thefinal potentials for Pt28
Co72 and Pt24Co76 were 0.677 and 0.617 V, respectively,
which implies that the selective dissolution of Co still continued, even though a Pt-enriched layer should have been present on the surface.
The amounts of the Co ions dissolved (¦m) from the Pt Co alloys during 24 h immersion tests were analyzed by ICP-MS. The results are presented in Fig. 4. The¦mdecreases with increasing Pt content in the PtCo alloys. The amounts of Co dissolved from Pt51Co49, Pt43Co57, Pt28Co72, and
Pt24Co76were 0.299, 0.368, 2.51, and 5.77 µg, respectively.
These results agree well with those expected from the Erest
results. A similar tendency has been reported for the bulk Pt Co alloys.29)
The selective dissolution behavior of Co dramatically changed between PtCo binary thinfilms with Pt contents of 28 and 43 at%. The relationship between the Pt content in the PtCo binary alloys and the amount of Co dissolved is plotted in Fig. 5, together with the data related to bulk PtCo alloys.29)Figure 5 reveals that PtCo binary alloy thinfilms
and bulk PtCo binary alloys exhibit similar tendencies with respect to the selective dissolution of Co. The Co ions
dissolved from PtCo alloys (¦m/µg) exponentially increas-ed with decreasing Pt content in the PtCo alloys. Recently, a similar trend was reported for the AuAg binary alloy system.30)
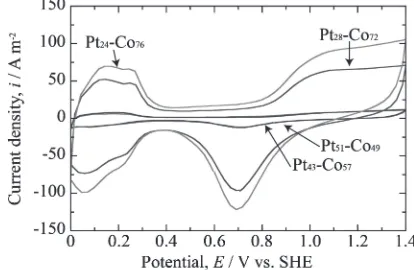
3.2 Effect of Pt content on ECSA
CV curves of the PtCo alloy thin films after the 24 h immersion test were performed to evaluate the electrochemi-cally active surface area (ECSA). The ECSA was calculated on the basis of hydrogen adsorption electric charge (QH) in
the voltammograms, as given by eq. (2):31,32)
ECSA¼QH=210 ð2Þ
The tenth CV curves for each sample are plotted in Fig. 6. The CV characteristics of all the samples are similar to those of pure Pt, which confirms the formation of a Pt-enriched layer on the surface of the PtCo alloys. However, the magnitude of the current density increases as the amount of Pt in the alloys increases. The current density for the Pt28 Co72 and Pt24Co76 alloys was approximately seven times
greater than that for the Pt51Co49 and Pt43Co57alloys.
The average thickness of the Pt-enriched layer (¤) in monolayers (MLs) for the PtCo alloy thin films after the 24-h immersion tests was approximated from the obtained
¦m using eqs. (3) and (4) under the assumption that the surface plane is (111):
Fig. 3 Changes in rest potentials,Erest, of Pt and PtCo binary alloy thin films in 0.5 mmol·m¹3H
2SO4solution.
Fig. 4 Amount of Co ions dissolved from the PtCo binary alloy thinfilms by immersion in 0.5 mmol·m¹3H
2SO4solution for 24 h.
Fig. 5 Relationship between the amount of Co ions dissolved by 24 h of immersion in 0.5 mmol·m¹3 H
2SO4solution and the Pt content of the alloys.
Fig. 6 CV profiles at the tenth cycle for PtCo binary alloy thinfilms exposed to 0.5 mmol·m¹3H
[image:3.595.61.277.70.213.2] [image:3.595.321.529.75.219.2] [image:3.595.64.275.268.409.2] [image:3.595.321.528.280.415.2]¤¼ ððm=mCoð111ÞÞ=SinitialÞ ð3Þ
mCoð111Þ¼ 2MCoxCo
ðpffiffiffi3a2=2ÞNA
ð4Þ
where mCo(111)is the weight of Co atoms in a (111) surface
atomic layer, Sinitial is the initial surface area before the
specimen was immersed in sulfuric acid, a is the lattice constant of the PtCo binary alloy,NAis Avogadro’s number,
MCois the atomic weight of Co, andxCois the atom fraction
of Co. The initial surface of the thinfilms was not completely flat, as shown in Fig. 1. TheSinitialshould be larger than the
geometric surface area (Sgeo=0.13 cm2). Unfortunately, the
Sinitialof the PtCo alloys is difficult to determine from the
ECSA results because the selective dissolution of Co starts quickly after the specimens are immersed in 0.5 mmol·m¹3 H2SO4,29) leading to an increase in the ECSA. Thus, the
ECSA of the pure Pt thinfilm was used as theSinitialfor the
PtCo alloy thinfilms because the Pt and PtCo alloys were prepared by PVD and dry-polished by GD-OES under the same conditions. The ECSA for the Pt thinfilm was 0.39 cm2
and remained unchanged during the 24 h immersion in 0.5 mmol·m¹3H
2SO4solution. The roughness factor, defined
as (Sinitial/Sgeo), was calculated to be approximately 3.0. The
thicknesses of the Pt-enriched layers were estimated by eq. (3) to be approximately 10, 11, 56, and 121 MLs for Pt51 Co49, Pt43Co57, Pt28Co72, and Pt24Co76, respectively; the
results are summarized in Table 1. The thickness of the Pt-enriched layer for Pt51Co49is slightly thicker than that of the
other work13) where PtCo nano particles (45 nm) were used. This may be caused by the difference in the particle size because Pt surface diffusion rate is much different between nano particles and thin films due to surface energy.33)
3.3 Selective dissolution and surface morphology Here, we discuss the surface morphology after the selective dissolution. On the basis of the drastic increase in the ECSA for the Pt28Co72 and Pt24Co76 alloys, we expected the
Pt-enriched layer to be porous. Let us consider thatn pieces of cylindrical pits of radius r and depth d are formed and uniformly distributed on the surface as a result of Co selective dissolution and Pt surface diffusion (Fig. 7). The cylinder aspect ratio (Ap) is represented by eq. (5):
Ap¼d=2r ð5Þ
The surface area of a pit (Spit) is given by the bottom surface
(Sb) and side-wall surface, as shown in eq. (6):
Spit¼³r2þ2³rd¼Sbð1þ2d=rÞ
¼Sbð1þ4d=2rÞ ¼Sbð1þ4ApÞ ð6Þ
The surface coverage of pits (ª) is defined as the ratio of the sum of the bottom surface area of all the pits to the initial surface area (Sinitial), as shown in eq. (7):
ª¼nSb=Sinitial ð7Þ
Thus, the total surface area (Stotal) after the immersion is
calculated according to eq. (8):
Stotal¼Sinitialð1ªÞ þnSpit ð8Þ
By substituting eqs. (6) and (7) into eq. (8), eq. (9) is obtained:
Stotal¼Sinitialð1ªÞ þnSbð1þ4ApÞ
¼Sinitialð1ªÞ þªSinitialð1þ4ApÞ
¼Sinitialð1þ4ªApÞ ð9Þ
As theªand/orApincrease, theStotalincreases. Because theª
varies between 0ª1, a large value of Stotal will result
from an increase in Ap rather than an increase in ª.
Accordingly, in the cases of Pt28Co72 and Pt24Co76, deep
pits are predicted to form. Indeed, Chen Y-cK et al. used in situ monitoring via transmission X-ray microscopy images to reveal that pit growth progresses in the depth direction in AuAg alloys.30,34)
Let us assume that a pit is formed, as shown in Fig. 7, as a result of Co-selective dissolution and Pt-surface diffu-sion;17,18)i.e., the pit wall consists of pure Pt and Co atoms are exposed at the pit bottom. Accordingly, the coverage of pits (ª) can be given by the fraction of Co atoms in PtCo alloys, irrespective of the size and the number of pits. Meanwhile, theStotal is equal to the ECSA given by eq. (2).
By substituting the values forª,Sinitial, andStotalinto eq. (9),
we obtain the values of the aspect ratio (Ap). The results are
[image:4.595.312.536.75.196.2]presented in Table 2. If the pit depth (d) is assumed to be equal to the Pt-enriched layer thickness (¤) (Fig. 7), the pit
Table 1 ECSA and thickness of the Pt-enriched layer after 24 h of immersion in 0.5 mmol·m¹3H
2SO4solution.
Alloy ECSA
(Stotal, cm2)
Thickness of Pt-enriched layer (¤, MLs)
Pt 0.39
Pt51Co49 0.86 10
Pt43Co57 0.90 11
Pt28Co72 6.71 56
Pt24Co76 9.69 121
[image:4.595.46.293.95.181.2]Fig. 7 Schematic diagram of pits formed on the surface of the PtCo alloys.
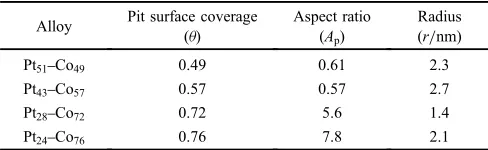
Table 2 Pit surface coverage and aspect ratio, and radius after 24 h of immersion in 0.5 mmol·m¹3H
2SO4solution.
Alloy Pit surface coverage
(ª)
Aspect ratio (Ap)
Radius (r/nm)
Pt51Co49 0.49 0.61 2.3
Pt43Co57 0.57 0.57 2.7
Pt28Co72 0.72 5.6 1.4
[image:4.595.305.549.273.348.2]radius (r) after 24 h immersion can be approximated to be 2 3 nm in all the samples.
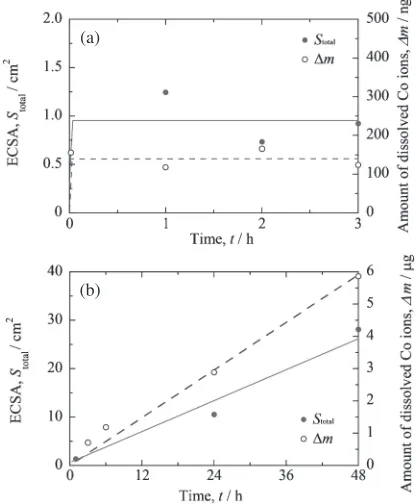
Figure 8 presents the changes in ¦m and ECSA as a function of time for bulk Pt50Co50 and Pt30Co70alloys, as
reported in a previous study.29) As evident in Fig. 8(a), the
¦mand ECSA for Pt50Co50remained unchanged with time,
which means that the surface of the high-Pt-content thinfilms (Pt51Co49and Pt43Co57) employed in the present study will
be completely covered with a Pt-enriched layer. A schematic drawing of the cross-section of the Pt51Co49 specimen is
shown in Fig. 9(a). The pit radius was estimated to be 2 3 nm. This value may be overestimated because the Pt-enriched layer (¤) may be thicker than the pit depth (d) as the pit bottom may be covered with the Pt-enriched layer. Accordingly, the actual pit radius for Pt51Co49and Pt43Co57
may be even smaller than the estimated values (23 nm). In addition, because the Ap for the Pt51Co49 is less than 1
(0.61), the surface of the Pt51Co49 appears to not be
substantially roughened by the selective dissolution process. However, as indicated in Fig. 8(b), the¦mand ECSA of the bulk Pt30Co70alloy continues to increase linearly with time.
Accordingly, in the case of the low-Pt-content alloys (Pt28 Co72 and Pt24Co76), the selective dissolution will likely
continue from the bottom of the pits. The pit radius r was estimated to be 23 nm, and the aspect ratioApwas estimated
to be 58 (pit depth: 1020 nm) after 24 h of immersion. If the dissolution primarily occurs through the Pt-enriched layer, the dissolution rate should decrease with increasing time, and the ECSA should not change substantially. Accordingly, the selective dissolution should primarily occur from the bottom of the pit. A schematic drawing of the cross-section of the Pt24Co76is shown in Fig. 9(b). In the future,
we will observe the nanoscale surface morphology to confirm the validity of the proposed mechanism.
4. Conclusion
The selective dissolution behavior of Co from PtCo binary alloy thin films, under immersion in 0.5 mmol·m¹3
H2SO4, was investigated. The amount of Pt in the PtCo
binary alloy thin films drastically changed the selective dissolution behavior of Co. At Pt concentrations greater than 40 at% Pt, the surface was completely covered with a Pt-enriched layer (approximately 10 monolayers thick) and further selective dissolution was suppressed. However, at Pt concentrations less than 30 at% Pt, the amount of Co selectively dissolved and the ECSA exponentially increased with decreasing Pt content. These results were successfully described by a model of numerous pits being induced by selective dissolution. In these calculations, the radius of the pits was estimated to be 23 nm and the pit aspect ratio (Ap)
was determined to be 7.8 and 5.6 for Pt24Co76 and Pt28
Co72, respectively, after 24 h of immersion in 0.5 mmol·m¹3
H2SO4 solution. The pit growth appeared to progress along
the depth direction, which led to a further increase in the ECSA.
Acknowledgments
The authors acknowledge the Center for Advanced Material Analysis, Tokyo Institute of Technology, for assistance with the ICP-MS, GD-OES, and XRD analyses.
REFERENCES
1) H. A. Gasteiger, S. S. Kocha, B. Sompalli and F. T. Wagner:Appl.
(a)
(b)
Fig. 8 Changes in the ECSA and in the amount of Co ions dissolved in 0.5 mmol·m¹3 H
2SO4 solution as functions of time for bulk Pt50Co50 alloy (a) and Pt30Co70alloy (b).
[image:5.595.315.532.70.366.2] [image:5.595.65.273.72.324.2]Catal. B: Environ.56(2005) 935.
2) T. Toda, H. Igarashi, H. Uchida and M. Watanabe:J. Electrochem. Soc.
146(1999) 37503756.
3) J. R. Kitchin, J. K. Nørskov, M. A. Barteau and J. G. Chen:J. Chem. Phys.120(2004) 1024010246.
4) J. K. Nørskov, J. Rossmeisl, A. Logadottir and L. Lindqvist:J. Phys. Chem. B108(2004) 1788617892.
5) V. R. Stamenkovic, B. S. Mun, K. J. J. Mayrhofer, P. N. Ross, N. M. Markovic, J. Rossmeisl, J. Greeley and J. K. Nørskov:Ange.Chem.45
(2006) 28972901.
6) V. R. Stamenkovic, B. S. Mun, M. Arenz, K. J. J. Mayrhofer, C. A. Lucas, G. Wang, P. N. Ross and N. M. Markovic:Nat. Mater.6(2007) 241247.
7) V. Viswanathan, H. A. Hansen, J. Rossmeisl and J. K. Nørskov:ACS. Catal.2(2012) 16541660.
8) M. Mavrikakis, B. Hammer and J. K. Nørskov:Phys. Rev. Lett.81
(1998) 28192822.
9) P. Strasser, S. Koh, T. Anniyev, J. Greeley, K. More, C. Yu, Z. Liu, S. Kaya, D. Nordlund, H. Ogasawara, M. F. Toney and A. Nilsson:Nature Chem.2(2010) 454460.
10) S. Chen, H. A. Gasteiger, K. Hayakawa, T. Tada and Y. Shao-Horn:
J. Electrohem. Soc.157(2010) A82A97.
11) F. Hasché, M. Oezaslan and P. Strasser: Chem. Cat. Chem.3(2011) 18051813.
12) D. Wang, H. L. Xin, R. Hovden, H. Wang, Y. Yu, D. A. Muller, F. J. DiSalvo and H. D. Abruña:Nat. Mat.12(2013) 8187.
13) H. L. Xin, J. A. Mundy, Z. Liu, R. Cabezas, R. Hovden, L. F. Kourkoutis, J. Zhang, N. P. Subramanian, R. Makharia, F. T. Wagner and D. A. Muller:Nano Lett.12(2012) 490497.
14) Y. Shao-Horn, W. C. Sheng, S. Chen, P. J. Ferreira, E. F. Holby and D. Morgan:Top Catal.46(2007) 285305.
15) A. C. C. Tseung and S. C. Dhara:Electrochim. Acta20(1975) 681
683.
16) T. Tada: Handbook of Fuel CellsFundamentals, Technology and Applications, vol. 3, (John Wiley & Sons., New York, 2003) p. 481.
17) Q. Xu, T. He and D. O. Wipf:Langmuir.23(2007) 90989103.
18) Q. Xu, E. Kreidler, D. O. Wipf and T. He:J. Electrochem. Soc.155
(2008) B228B231.
19) M. S. Wilson, F. H. Garzon, K. E. Sickafus and S. Gottesfeld:
J. Electrochem. Soc.140(1993) 28722877.
20) G. Zhang, Z. Shao, W. Lu, F. Xie, H. Xiao, X. Qin and B. Yi:Appl. Catal. B: Environ.132133(2013) 183194.
21) H. Li, K. Tsay, H. Wang, S. Wu, J. Zhang, N. Jia, S. Wessel, R. Abouatallah, N. Joos and J. Schrooten:Electrochim. Acta.55(2010) 26222628.
22) H. W. Pickering and C. Wagner:J. Electrochem. Soc.114(1967) 698 706.
23) H. W. Pickering:J. Electrochem. Soc.115(1968) 143147.
24) H. W. Pickering:J. Electrochem. Soc.115(1968) 690694.
25) H. W. Pickering and P. J. Byrne:J. Electrochem. Soc.116(1969) 1492 1496.
26) H. W. Pickering:J. Electrochem. Soc.117(1970) 815.
27) H. W. Pickering and P. B. Byrne:J. Electrochem. Soc.118(1971) 209 215.
28) Y. Hoshi, T. Yoshida, A. Nishikata and T. Tsuru:Electrochim. Acta56
(2011) 53025309.
29) Y. Hoshi, R. Ozawa, E. Tada, A. Nishikata and T. Tsuru:Corros. Sci.65
(2012) 512519.
30) Y.-c.K. Chen-Wiegart, S. Wang, I. McNulty and D. C. Dunand:Acta Mater.61(2013) 55615570.
31) M. J. Watt-Smith, J. M. Friedrich, S. P. Rigby, T. R. Ralph and F. C. Walsh:J. Phys. D: Appl. Phys.41(2008) 174004.
32) R. W. Lindström, K. Kortsdottir, M. Wesselmark, A. Oyarce, C. Lagergren and G. Lindbergh:J. Electrochem. Soc.157(2010) B1795 B1801.
33) M. Oezaslan, M. Heggern and P. Strasser: J. Am. Chem. Soc.134
(2012) 514524.