Texture Formation and Room-Temperature Formability of Rolled Mg
Zn
Ce Alloys
Yasumasa Chino
1,+, Xinsheng Huang
1, Kazutaka Suzuki
1, Motohiro Yuasa
1and Mamoru Mabuchi
2 1Materials Research Institute for Sustainable Development, National Institute of Advanced Industrial Science and Technology,Nagoya 463-8560, Japan
2Department of Energy Science and Technology, Graduate School of Energy Science, Kyoto University, Kyoto 606-8501, Japan The texture formation behaviors of rolled and subsequently annealed Mg1.5 mass%Zn0.2 mass%Ce alloy, whose texture was characterized by a split of basal planes in the transverse direction (TD-split texture), were investigated by electron back-scattering diffraction analysis. When the rolling temperature was set to 723 K, the basal poles of the as-rolled specimen exhibited tilted distribution toward the TD, and the TD-split texture appeared more significantly after annealing. Grains with the TD-split texture component were observed to construct some aggregates in the annealed specimen rolled at 723 K. It was observed that the aggregates of the grains with the TD-split texture component in the annealed specimen were created by the subdivision of the matrix grains by the fragments of twins. Activation of non-basal slips such as prismatic haislips was suggested to be related to the reorientation of grains with the TD-split texture component. In addition, room temperature formability of rolled MgZnCe alloys was investigated by conical cup tests and deep drawing tests. In the conical cup tests, significant conical cup value, which corresponds to aluminum alloys, was obtained in the Mg1.0Zn0.2Ce and Mg2.00.2Ce alloys. In the deep drawing tests, the large drawing ratio of 1.8 was obtained in the Mg1.5Zn0.2Ce alloy, when the blank holder force, punch speed, punch diameter, die hole diameter, shoulder radius of punch and lubricant was set to 2 kN, 5 mm/min, 33.0 mm, 35.6 mm, 3.0 mm and molybdenum disulfide paste, respectively.
[doi:10.2320/matertrans.MC201404]
(Received February 3, 2014; Accepted April 18, 2014; Published May 30, 2014)
Keywords: magnesium alloys, rolling, texture, formability, deep drawing
1. Introduction
Mg alloys have great potential for improving fuel efficiency and reducing CO2 emissions of automobiles
because of their high specific strength and stiffness.1) In
general, because the critical resolved shear stresses (CRSSs) for non-basal slips are much larger than that for basal slip2)
and non-basal slips hardly occur at room temperature in Mg, these alloys exhibit poor formability at room temperature. The elongation to failure can be enhanced by grain-size refinement in Mg. However, the stretch formability at room temperature depends more strongly on the basal texture than on the grain size.3) Recently, it has been reported that the minor addition of special elements such as Ce in MgZn alloys is an effective approach for enhancement of the formability at room temperature.49) For example, an Mg 1.5 mass%Zn0.2 mass%Ce alloy sheet, rolled at a high temperature of 723 K, and subsequently annealed, shows a large Erichsen value of 9.0.46) This value is comparable
with the stretch formability of commercial Al alloys. The enhanced stretch formability is mainly attributed to a reduction of the basal texture intensity and a development of the transverse direction (TD)-split texture: a split of the basal planes toward the TD about 35° from the normal direction (ND).5,6,8,1012) Previous studies have shown the
principal effects of special element addition to MgZn alloys on the development of the TD-split texture. However, the relationship between texture formation and related micro-structural changes during rolling and subsequent annealing are still unclear. In addition, the sheet formability other than the stretch formability of the rolled MgZnCe alloys is still unclear.
Thus, in this paper, texture changes in a MgZnCe alloy during rolling and subsequent annealing were investigated,
and room temperature formability of rolled MgZnCe alloys were investigated by conical cup tests13) and deep drawing tests.
2. Experimental Procedure
An extruded MgZnCe alloy with 50 mm in length, 60 mm in width and 5 mm in thickness was prepared as an as-received specimen. The specimen was heated at 663 K or 723 K in a furnace, and rolling was conducted at a rolling reduction of 20%. The heating and rolling treatments were repeated, and the sheet was rolled to a thickness of 1 mm. Rolled specimens were subsequently annealed at 623 K for 90 min. Some rolled specimens were annealed at 623 K for 30 s, and initial texture changes during annealing were evaluated.
Previous studies5) revealed that a Mg1.5 mass%Zn
0.2 mass%Ce alloy specimen rolled at 723 K and annealed at 623 K tends to produce the TD-split texture; however, the specimen rolled at 663 K and annealed at 623 K tends to produce the basal texture. In the present study, in order to investigate differences between the texture developments of the Mg1.5 mass%Zn0.2 mass%Ce alloy specimens rolled at 663 and 723 K, electron back-scattering diffraction (EBSD) analysis was carried out for both the specimens by scanning electron microscopy on a JEOL JSM-5910 machine operating at 20 kV. The analysis samples were prepared from the RD-TD plane of the specimens at the center through the thickness. The step size of the EBSD analysis was set to 1.0 µm.
In order to investigate the sheet formability of the rolled MgZnCe alloys rolled at 723 K, conical cup tests and deep drawing tests at room temperature were carried out. In conical cup tests, the cerium concentration in the MgZnCe alloys was set to 0.2 mass%, and zinc concentration was varied from 0 to 2.5 mass%. The specimen with 60.0 mm in diameter and 1.0 mm in thickness were machined from the
+Corresponding author, E-mail: y-chino@aist.go.jp
sheet, and the specimen was pressed with a round puncher with diameter of 20.6 mm. The conical cup value (CCV) was obtained by measuring the diameter of the cup which the specimen has been drawn into. The forming speed was set to 5 mm/min. Machine oil was used as a lubricant. In deep drawing tests, deep drawing of the Mg1.5 mass%Zn 0.2 mass%Ce alloy sheet was conducted at the conditions of 2 kN for the blank holder force and 5 mm/min for the punch speed. The punch diameter was 33.0 mm for the punch with a shoulder radius of 3.0 mm. The die hole diameter was 35.6 mm and hence the clearance between the punch and the die was 1.3 mm. The blank diameter was set to 59.0 mm, and the drawing ratio (DR), i.e., a ratio between blank diameter and punch diameter, was 1.8. Molybdenum disulfide paste was used as a lubricant.
3. Results and Discussion
3.1 Texture formation of rolled MgZnCe alloys Figure 1 shows the (0002) pole figures together with the distributions of grain boundary misorientations for the specimens. Under the as-rolled conditions, the majority of the basal planes were oriented parallel to the RD-TD plane and slightly tilted toward the RD and TD in the specimen rolled at 663 K. In the case of the specimen rolled at 723 K, the basal planes exhibited more tilted distribution toward the TD compared with those of the specimen rolled at 663 K. After annealing, the TD-split texture appeared more signifi -cantly only in the specimen rolled at 723 K. It is notable that the specimen rolled at 723 K exhibited higher texture intensity than does the specimen rolled at 663 K before and after annealing, indicating that the formation of the TD-split texture enhanced the stretch formability. The variation in texture during annealing qualitatively corresponded to observations of the macro-texture.5,6)
The grain boundary misorientations of both the specimens exhibited high fractions of low angle grain boundaries (LAGBs), less than 10° in the as-rolled state. After annealing, the fraction of LAGBs dropped to a significantly low level in both specimens, indicating completion of static recrystalliza-tion (SRX).14)After completion of SRX, the fraction of
high-angle grain boundaries, i.e., larger than 30°, increased in both specimens. This implies that grain nucleation accompanied by SRX and grain growth during annealing contributed to texture weakening.
Inverse polefigure maps and related image quality maps of the as-rolled specimens are summarized in Fig. 2. The boundaries of 86°f1012gextension, 56°f1011gcontraction, and 38° f1011gf1012g double twins sharing a common
h1120i rotation axis between the twin and the parent grain with a tolerance angle of 5° were indicated in the image quality maps.15) The f1012gh1011i twin is one of the main
twins for Mg. Another main twin in Mg is thef1011gh1012i twin. An important twin, related to the f1011g twin, is the f1011gf1012g double twin. The number fractions of 86° f1012g extension, 56° f1011g contraction and 38°
f1011gf1012g double twins were 8.2, 1.3 and 2.2%, respectively, for the specimen rolled at 663 K, and 11.8, 1.6 and 2.7%, respectively, for the specimen rolled at 723 K. It is observed that more twin boundaries were included in the specimen rolled at 723 K. On the other hand, the proportion of twin types was almost the same for the specimens rolled at 663 and 723 K. It is notable that the as-rolled specimen at 723 K exhibited a much higher grain size (40 µm) than the as-rolled specimen at 663 K (24 µm) did. The larger grain size of the specimen rolled at 723 K was likely due to a more intensive grain coarsening during heating to the higher temperature before rolling. It is known that the grain-size dependence of twinning stress is greater than that of slip stress.16) This is responsible for the increase in twin
boundaries with increasing grain size.
Mackenzie and Pekguleryuz10)suggested that the TD-split texture detected in rolled MgZnCe alloys originated from recrystallized grains in shear bands. Similarly, Yan et al.12)
reported that shear bands composed of fine
dynamic-recrystallized (DRX-ed) grains were regarded as the nucleation sites of the grains composing random and/or TD-split texture in a rolled MgZnGd alloy. However, in our results, shear bands composed offine DRX-ed grains did not appear. Alternatively, coarse grains, which had a non-basal texture component, were often observed in specimens as-rolled at 723 K.
Number fraction
Misorientation angle (°)
0 30 60 90
0.7 0.6 0.5
0.1 0.2 0.3 0.4
Number fraction
Misorientation angle (°)
0 30 60 90
0.20
0.16
0.12
0.08
0.04
Number fraction
Misorientation angle (°)
0 30 60 90
0.2 0.4 0.6 0.5
0.3
0.1
(a) Max: 5.9
TD
RD (b)
Max: 4.3
TD
RD (c)
Max: 8.4
TD
RD (d)
Max: 5.7 RD
TD
Misorientation angle (°)
0 30 60 90
Number fraction
0.04 0.08 0.12 0.16 Min
Max
[image:2.595.60.536.69.237.2]Figures 3(a), 3(b) and 3(c) show the inverse pole figure map, EBSD image quality map and discrete (0002) pole
figure of the specimen rolled at 723 K and subsequently annealed for 90 min, respectively. The orientation of the highlighted grains in the image quality map corresponds to the TD-split texture component defined as an angle of 35° from the ND toward the TD within an angular tolerance of 15°. There was a significant difference in grain size between the annealed specimen (26 µm) and the as-rolled specimen (40 µm), indicating that the SRX and subsequent grain growth did not contribute to grain coarsening but to refining. It is notable that the highlighted grains in the image quality map were not randomly distributed, but constructed some aggregates of grains (see the circles by white broken line in Fig. 3(b)). Figure 3(d) shows the inverse pole figure map, where the area characterized by white-broken square in Fig. 3(a) is magnified. The crystals in Fig. 3(d) illustrate the orientations of the representative red grains in the IQ map (Fig. 3(b)). In Fig. 3(d), clear alignments, such that h1120i andh1010idirections of basal plane were aligned to the RD, were not observed in the grains with the TD-split texture component.
Figure 4 shows the inverse polefigure map, EBSD image quality map and discrete (0002) pole figure of the specimen rolled at 723 K in the initial stage of annealing. It is observed that the coarse grains detected in the as-rolled specimen were cut into pieces by twin boundaries. The subdivision of the coarse grains by the fragment of twins was likely related to the occurrence of twin-related SRX. Twin SRX is often observed in Mg alloys subjected to a cold working and subsequent annealing,17) and the orientations of SRX-ed
grains tend to depend on the twin type. Liet al.18) reported
that the subdivision of coarse primary twins by fine
secondary twins, especially contraction twins, could result
in the formation of individual grains during annealing because of the high misorientation angles between the matrix and contraction twins. The above information may be possibly connected to the fact that the twin-SRX-ed grains played an important role in the subdivision of coarse matrix grains. Occasionally, the fragments of twins, which may be origin of the twin-SRX-ed grains, exhibited the TD-split texture component (see the white arrows in Fig. 4) in a similar manner as seen in previous studies, where grains with the TD-split texture component appeared in shear bands.10,12) However, in the present study, the area fraction of the fragments of twins with the TD-split texture component was much smaller than that of the matrix grains with the TD-split texture component, indicating that the fragments of twins were not directly attributed to formation of the TD-split texture.
Alternatively, it should be noted that the distribution of subdivided coarse grains was very similar to that of the aggregates of grains with the TD-split texture component in the fully annealed specimen (see the circles by white broken line in Fig. 4(b)). This result implies that the aggregates of grains with the TD-split texture component in the fully annealed specimen were created by the subdivision of the matrix grains by the fragments of twins at an initial stage of the annealing. It is therefore confirmed that the formation of matrix grains with the TD-split texture component during rolling was one of the direct origins of grains with the TD-split texture component observed in the rolled and annealed MgZnCe alloys. In addition, it is suggested that the subdivision of the matrix grains with the TD-split texture component observed in the as-rolled specimen likely appeared more significantly by SRX (indicated by Fig. 1(d)) and subsequent grain growth during the annealing.
) 0001 (
) 0 1 10 (
) 0 1 1 2 (
50
µ
m
50
µ
m
50
µ
m
50
µ
m
(a)
(b)
(c)
(d)
: Extension twin
: Contraction twin
: Double twin
RD
TD
[image:3.595.83.512.69.323.2]The results obtained here point out that rolling at a high temperature of 723 K was essential for the formation of matrix grains with the TD-split texture component. It seems that the requirement of high temperature deformation at 723 K was likely related to a change in deformation mode as a result of an activation of non-basal slips, i.e., prismatichai and pyramidal hcþai slips of Mg. This is because their CRSSes strongly depend on the temperature and do not exceed that of extension twinning at 723 K.19) It is known
that spreading of basal poles to the TD is typical of the texture of deformed Zr alloys, in which non-basal slips such as prismatic hai slips occur more readily than basal hai slips.20)Some numerical simulations using viscoplastic self-consistent (VPSC) formulation reported that the activation of prismatic hai slips promotes an orientation of basal pole toward the TD in the study of not only Zr21)but also Mg.22)
Our previous research revealed the activation of prismatichai slips by minor rare-earth addition to Mg.23)The activation of
the prismatic hai slip corresponds to the cross-slip of screw dislocations from the basal slip to the prismatic slip.24) The
cross-slip tends to be more activated with increasing stacking fault energy because the width of the extended dislocation is inversely proportional to the stacking fault energy.25)Suzuki
et al.26) showed that the addition of Zn to MgY alloy is effective for decreasing stacking fault energy. It is therefore suggested that non-basal slips such as prismatic hai slips were closely related to the reorientation of grains in the specimen rolled at a high temperature of 723 K, resulting in the formation of matrix grains with a TD-split texture component.
3.2 Sheet formability of rolled MgZnCe alloys The results of the conical cup tests at room temperature are summarized in Fig. 5(a), where the CCV ratio is defined as
(b)
80
µ
m
(c)
RD
TD
80
µ
m
(a)
) 0001 (
) 0 1 10 (
) 0 1 1 2 (
RD
TD
(d)
Fig. 3 (a) Inverse polefigure (IPF) map of RD-TD plane for Mg1.5Zn 0.2Ce alloys rolled at 723 K and subsequently annealed at 623 K for 90 min, (b) related image quality (IQ) map, (c) related discrete (0002) pole
figure, and (d) magnified IPF map (area characterized by white-broken square in (a)). Orientation of the red grains in the IQ maps (b) corresponds to the highlighted area in the discrete (0002) polefigures (c). Crystals in (d) illustrate orientations of the representative red grains in the IQ map (b).
(c)
RD
TD
)
0001
(
)
0
1
10
(
)
0
1
1
2
(
(b)
50
µ
m
(a)
RD
TD
50
µ
m
[image:4.595.58.282.68.565.2] [image:4.595.314.541.70.411.2]the ratio of CCV to initial blank diameter. The Mg1.0Zn 0.2Ce alloy showed the large CCV ratio of 0.83, which was almost the same as those of commercial aluminum alloys (3004 and 5052 alloys)27)as shown in Fig. 5(b). On the other hand, the specimens of no zinc addition (Mg0.2Ce alloy) and excessive zinc addition (Mg2.5Zn0.2Ce alloy) ex-hibited the deteriorated CCV compared with the specimens, in which the zinc concentration was set to from 1.0 to 2.0 mass%. Previous study6) revealed that the Mg1.5Zn
0.2Ce alloy specimen exhibited the highest stretch form-ability in the specimens in which the zinc concentration was varied from 0 to 2.5 mass%, and the enhanced stretch formability of the Mg1.5Zn0.2Ca alloy was attributed to the unique texture, that is, a reduction of the basal texture intensity and a development of the TD-split texture. It is known that there are four modes in the plastic deformation of sheets metals (stretch forming, deep drawing, bending and
flange forming),28)and the deformation modes of conical cup tests are composed of superposition of stretch forming and deep drawing.27) It is noted that the specimens with the lowest CCV value showed almost the same composition with the specimen with the highest Erichsen value.6) This result
indicates that the unique texture, that is, the reduction in intensity of basal plane texture and the development of the TD-split texture contributed to the enhancement of not only stretch formability but also deep drawing ability.
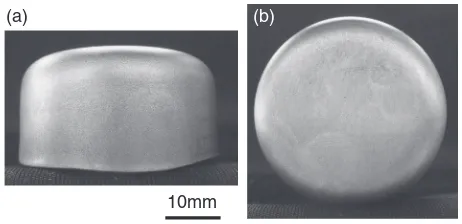
Next, the result of deep drawing test for the Mg1.5Zn 0.2Ce alloy specimen was shown in Fig. 6. The specimen could be successfully drawn at a large DR of 1.8 without apparent crack and earing. When deep drawing is conducted for Mg alloys at room temperature, it has been reported that the limiting drawing ratio (LDR) is mainly in a range of 1.2 1.4 for commercial AZ31 alloy,2931)1.5 for the AZ31 alloy processed by repeated unidirectional bending,32) 1.7 for the AZ31 alloy treated by high temperature annealing at 778 K,31) and 1.8 for sheets processed by high-temperature
rolling.33) It is known that there are many parameters for
determining the deep drawing ability of Mg alloys, such as not only microstructures of the sheets but also die confi
g-uration, lubricant, punch speed and so on. And there are some differences in the operating conditions between the present research and the above researches. Thus, the direct comparison in the LDR between the present study and the other works may be difficult. However, it is worthwhile to mention that the LDR of 1.8 in the present work is one of the largest values in the previous studies, to our knowledge.
Mori and Tsuji31) reported that one of the effective ways
in order to attain the large LDR is to optimize the clearance between the punch and the die. They suggest that the clearance between the punch and die should be set to larger value compared with blank thickness, namely, no ironing is preferable. This information implies that enhancement of thickness direction strain without ironing is one of key factors for enhancing deep drawing ability of Mg alloys. In the present study, the deep drawing at a large DR of 1.8 was obtained, when the clearance (1.3 mm) was set to larger value compared with blank thickness (1.0 mm). Thus, it is suggested that the unique texture, that is, the reduction in intensity of basal plane texture and the development of the TD-split texture contributed to the promotion of thickness direction strain, and the promotion of the thickness direction strain enhanced not only the stretch formability but also the deep drawing ability of the rolled MgZnCe alloys.
20 mm (b)
0.8
0.82
0.84
0.86
0.88
0.9
0
0.5
1
1.5
2
2.5
(a)
Zn concentration (mass%)
CCV ratio
Fig. 5 (a) Effects of zinc concentration on conical cup value (CCV) ratio of rolled MgZnCe alloys, where the CCV ratio is defined as the ratio of CCV to initial blank diameter, (b) specimen of rolled Mg1.0Zn0.2Ce alloy after conical cup test, where the CCV ratio was 0.83.
(a) (b)
10mm
[image:5.595.125.472.72.262.2] [image:5.595.311.542.320.432.2]It is noted that the punch speed used in the present study and the other studies31,33) was much lower than the punch
speed used in the deep drawing for the aluminum alloy sheets.34) Researches such as texture modification of the
sheets and optimization of the die configurations in order to attain the deep drawing at high punch speed are essential for the practical use of the deep drawing of Mg alloys sheets at room temperature. Further research for getting higher punch speed is still in progress.
4. Conclusion
Variations in the texture and microstructure of a rolled and annealed MgZnCe alloy, whose texture was characterized by a split of basal planes to the TD, were investigated using EBSD analysis. In addition, room temperature formability of rolled MgZnCe alloys was investigated by conical cup tests and deep drawing tests. The results are summarized as follows:
(1) In the case of the specimen rolled at 723 K, the basal poles exhibited more tilted distribution toward the TD compared with that of the specimen rolled at 663 K. After annealing, the TD-split texture appeared more significantly only in the specimen rolled at 723 K. Grains with the TD-split texture component in the annealed specimen were not randomly distributed but constructed aggregates of grains.
(2) In the as-rolled states, the matrix grains with the TD-split texture component were cut into pieces by twin boundaries. It is suggested that the aggregates of grains with the TD-split texture component observed in the annealed specimen were created by subdivision of the matrix grains by twin boundaries. Non-basal slips such as prismatic hai slips were suggested to be related to the reorientation of grains with the TD-split texture component.
(3) As a result of the conical cup tests, significant conical cup value, which corresponds to aluminum alloys, was obtained in the Mg1.0Zn0.2Ce and Mg2.00.2Ce alloys. In the deep drawing tests, the large drawing ratio of 1.8 was obtained in the Mg1.5Zn0.2Ce alloy under the conditions that the blank holder force, punch speed, punch diameter, die hole diameter, shoulder radius of punch and lubricant was set to 2 kN, 5 mm/min, 33.0 mm, 35.6 mm, 3.0 mm and molybdenum disulfide paste, respectively. It is suggested that the unique texture, that is, the reduction in intensity of basal plane texture and the development of the TD-split texture contributed to the promotion of thickness direction strain, resulting in the enhancement of the deep drawing ability of the rolled MgZnCe alloys.
Acknowledgements
This study was partially supported by JSPS Grant-in-Aid for Scientific Research (C) (KAKENHI, 22605007).
REFERENCES
1) M. Hakamada, T. Furuta, Y. Chino, Y. Chen, H. Kusuda and M. Mabuchi:Energy32(2007) 13521360.
2) H. Yoshinaga and R. Horiuchi: Trans. JIM4(1963) 18.
3) Y. Chino, K. Kimura and M. Mabuchi:Acta Mater.57(2009) 1476 1485.
4) Y. Chino, K. Sassa and M. Mabuchi:Mater. Trans.49(2008) 1710 1712.
5) Y. Chino, K. Sassa and M. Mabuchi:Mater. Trans.49(2008) 2916 2918.
6) Y. Chino, X. Huang, K. Suzuki, K. Sassa and M. Mabuchi:Mater. Sci.
Eng. A528(2010) 566572.
7) D. H. Kang, D. W. Kim, S. Kim, G. T. Bae, K. H. Kim and N. J. Kim:
Scr. Mater.61(2009) 768771.
8) Y. Chino, X. Huang, K. Suzuki and M. Mabuchi:Mater. Trans. 51
(2010) 818821.
9) C. L. Mendis, J. H. Bae, N. J. Kim and K. Hono:Scr. Mater.64(2011)
335338.
10) L. W. F. Mackenzie and M. O. Pekguleryuz:Scr. Mater.59(2008) 665 668.
11) J. Wendt, K. Hantzsche, J. Bohlen, K. U. Kainer, S. Yi and D. Letzig: Proc. 8th International Conference on Magnesium Alloy and their Applications, ed. by K. U. Kainer, (DGM Wiley-VCH, Weinheim, 2010) pp. 551556.
12) H. Yan, S. W. Xu, R. S. Chen, S. Kamado, T. Honma and E. H. Han:
Scr. Mater.64(2011) 141144.
13) Japanese Industrial Standard, Method of Conical Cup Test (JIS Z2249), (Japan Standard Association, Tokyo, 1963).
14) X. Yang, Y. Zhu, H. Miura and T. Sakai:Trans. Nonferrous Met. Soc.
China20(2010) 12691274.
15) M. D. Nave and M. R. Barnett:Scr. Mater.51(2004) 881885. 16) M. A. Meyers, O. Vöhringer and V. A. Lubarda:Acta Mater.49(2001)
40254039.
17) J. Liu, T. Liu, H. Yuan, X. Shi and Z. Wang:Mater. Trans.51(2010)
341346.
18) X. Li, P. Yang, L.-N. Wang, L. Meng and F. Cui:Mater. Sci. Eng. A
517(2009) 160169.
19) Y. Chino and M. Mabuchi:Scr. Mater.60(2009) 447450.
20) E. Tenckhoff: Deformation Mechanisms, Texture, and Anisotropy in Zirconium and Zircaloy, 1st ed., (ASTM Special Technical Publication, Philadelphia, 1988) pp. 3554.
21) R. A. Lebensohn, M. I. González, C. N. Tomé and A. A. Pochettino:
J. Nuclear Mater.229(1996) 5764.
22) S. R. Agnew, M. H. Yoo and C. N. Tomé:Acta Mater.49(2001) 4277 4289.
23) Y. Chino, M. Kado and M. Mabuchi:Mater. Sci. Eng. A494(2008)
343349.
24) J. Koike, T. Kobayashi, T. Mukai, H. Watanabe, M. Suzuki, K. Maruyama and K. Higashi:Acta Mater.51(2003) 20552065. 25) M. Kato:Introduction to the Theory of Dislocations, 1st ed., (Shokabo,
Tokyo, 1999) (in Japanese).
26) M. Suzuki, T. Kimura, J. Koike and K. Maruyama: Scr. Mater. 48
(2003) 9971002.
27) M. Sugamata, J. Kaneko and M. Numa: J. JSTP41(2000) 233238. 28) K. Yamaguchi: J. JSTP49(2008) 849855.
29) K. Iwanaga, H. Tashiro, H. Okamoto and K. Shimizu: J. Mater.
Process. Technol.155156(2004) 13131316.
30) K. F. Zhang, D. L. Yin and D. Z. Wu:Int. J. Mach. Tools Manuf.46
(2006) 12761280.
31) K. Mori and H. Tsuji:J. JSTP48(2007) 4145.
32) L. Zhang, G. S. Huang, H. Zhang and B. Song: J. Mater. Process.
Technol.211(2011) 644649.
33) X. Huang, K. Suzuki, Y. Chino and M. Mabuchi:Mater. Sci. Eng. A
565(2013) 359372.