Compositional Optimization of
¢
Type Titanium Alloys
with Shape Memory Ability and Their Characteristics
Kazuhiro Matsugi, Hiroyuki Kishimoto, Daiki Yamakawa,
Zhe-Feng Xu and Yong-Bum Choi
Department of Mechanical Materials Engineering, Hiroshima University, Higashi-Hiroshima 739-8527, Japan
The compositions of¢type Ti alloys having shape-memory ability above 400 K were proposed by alloying parameters used in the d-electrons concept. They were both Ti-6Mo-2Al-1Sn and Ti-6Nb-3Mo which were designed for improvement of thermal stability in shape memory behavior of Ti-6Mo base alloy, preserving the tensile strength of 700 MPa. Their ingots without contamination from the used crucible were produced by cold crucible levitation melting. They consisted of¢and¡AAphases after the cold roll and heat treatment, and their amounts were depended on values in the alloying parameters. The shape recovery rate of 40 and 25%was measured after 4 cycles in the loading-unloading tests in Ti-6Mo-2Al-1Sn and Ti-6Nb-3Mo, respectively. They showed theAstemperature above 490 K and improvement of thermal stability because of a much smaller amount of½phase than Ti-6Mo. The alloys showed tensile strength of 682 to 718 MPa. These results were caused by exactly prediction of the phase stability, shape memory ability and tensile strength, using alloying parameters.
[doi:10.2320/matertrans.M2015233]
(Received June 5, 2015; Accepted July 30, 2015; Published September 25, 2015)
Keywords: alloy design, environmentally friendly alloys, high temperature shape memory, cyclic thermal stability, levitation melting
1. Introduction
¢-type Ti base shape memory alloys for high temper-ature application have been developed in the world.18)
Their shape memory ability was caused by the reversible martensitic transformation. The development of high per-formance Ti alloys has been performed relying on many trail-and error experiments and a few empirical rules. Therefore, the development is so inefficient and also expensive. In order to save cost and time necessary for alloy development in saving energy, more fundamental approaches based on the solid theory are needed. The d-electrons concept on the basis of the theoretical calculation of electronic structures of alloys has been proposed by Morinaga et al.9) The high performance metallic materials such as Ni, Ti, Al, Mg and Fe-based alloys, etc.1015) had been developed by the d-electrons concept for the usability in practical application.
The high performance of titanium alloys can be achieved by the optimization of not only alloy-composition but also manufacturing process.1517)Commercial production process
usually involves induction melting of alloys under heavy vacuum. A major source of contaminants is refractory melting crucibles. Vacuum induction and arc skull melting processes both are used to prevent the molten metal contamination. These processes possessed, however, very low energy efficiency.18) Therefore, utilization of the cold crucible levitation melting (CCLM) is very useful for melting of Ti alloys,19,20)in saving energy.
In this study, the compositions of ¢ type Ti alloys having shape-memory ability above 400 K and good cyclic thermal stability and tensile strength of 700 MPa at 293 K, were proposed using both parameters used in the d-electrons concept. The compositionally optimized alloys which were produced by the CCLM technique, were evaluated experimentally their shape memory and strength properties.
2. Alloy Design for the ¢ Alloys with Shape Memory Ability
Two calculated parameters are mainly utilized in the d-electrons concept.9,11,12)The one is the d-orbital energy level
(Md) of alloying transition elements, and the other is the bond order (Bo) that is a measure of the covalent bond strength between atoms. The values of the parameters for each element which were calculated on the MTi14 cluster
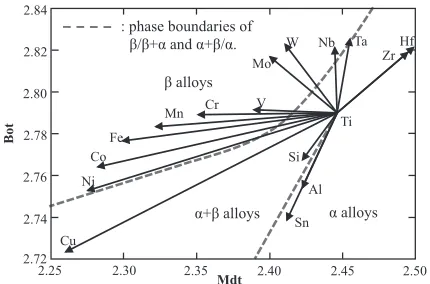
model (M: alloying elements) in the case of bcc Ti, were reported previously.9,11) In order to understand the alloying effect of each element in Ti, the Mdt-Bot diagram was prepared for Ti-10 mol% M binary alloys, and shown in Fig. 1. For alloys, the average values of Md and Bo are defined by taking the compositional average, and Mdt and
Botare denoted using eqs. (1) and (2).
Mdt¼XXiðMdÞi ð1Þ
Bot¼XXiðBoÞi ð2Þ
2.25 2.30 2.35 2.40 2.45 2.50
2.72 2.74 2.76 2.78 2.80 2.82 2.84
Mdt
Bot
alloys + alloys
alloys
Cr Mn Fe Co Ni
Cu
Si
Al
Sn Ti V
Mo
W Nb Ta Hf
Zr
: phase boundaries of / + and + / .
Fig. 1 Mdt-Bot line of Ti-M binary alloys. The vectors represent the location of Ti-10 mol%M alloys inMdt-Botdiagrams.
[image:1.595.320.535.348.490.2]Here, Xi is the mole fraction of component i in the alloy,
(Md)i and (Bo)iare theMdandBo values for componenti,
respectively. The values of (Md)i and (Bo)i were reported
previously.11,12) The summation extends over the
compo-nents,i=1, 2,+,n.
As shown in Fig. 1, the alloy position moves in theMdt
-Botdiagram as the alloy composition varies. For example, for a Ti-V binary alloy it moves to the left (the lowerMdtregion) with increasing V content. The vector drawn on the Ti-V line represents the position of a Ti-10 mol% V alloy in the diagram. Such a vector varies in direction and magnitude, depending on alloying elements, as shown in the diagram. TheBotandMdtvalues obtained for bcc Ti are employed for alloy design in this paper, since both parameters are relatively insensitive to the crystal structure.9,11)
The compositions of thirty seven conventional titanium alloys9) were plotted in the Mdt-Bot diagram as shown in
Fig. 2. The phase boundary of¢in Figs. 1 and 2 is duplicated from that drawn in classification of their commercial alloys into the¡,¡+¢and¢types.9)In contrast, the shape memory
effect and superelasticity at or near the room temperature was checked and compositional area having its ability was predicted by a dotted line, using sixty commercial and reported alloys showing the compositional range denoted in Fig. 2. The alloys used in the prediction of shape memory ability were reported in open literatures,18,2125)for instance. It is interesting that the limit line in the lower Mdt side showing appearance of shape memory effect, agreed roughly with the contour line showingMs temperature of 293 K.9)The sub-region showing the ultimate tensile strength level of approximately 700 MPa at the solution heat treatment state was also indicated by a full line in the area showing the shape memory effect and superelasticity. This contour line of 700 MPa was predicted using the values of ultimate tensile
strength of plotted alloys in Fig. 2, as well as the previous reports.26,27) Thus, a target region for alloy design can be
specified concretely on theMdt-Botdiagram. Once a specific
Mdt-Bot region and a specific alloy system are set in the diagram, the corresponding alloy composition is simply determined following the rule of the vector sum.26,27)
The stability region of the ¢ type alloys extended to the highBotand lowMdtregion in Fig. 2, compared with¡and
¡+¢ alloys. The shape memory behavior is caused by the reversible martensitic transformation between the ¢ parent phase and the¡AAmartensite phase. For these alloys to exhibit the shape memory ability, it is necessary to obtain the ¢ phase, which is achieved by the addition of ¢ phase stabilizers such as Mo, Nb, W and Ta to Ti. These ¢phase stabilizers showing a complete solid solution system, Ti-10Mo, Ti-10Nb, Ti-10W and Ti-10Ta alloys, have higherBot, as seen in Fig. 1. Mo is the lowest cost (99.9%Mo,¼Y54,000/ kg,), compared with Nb (99.9%Nb, ¼Y233,000/kg), W (99.9%W,¼Y145,000/kg) and Ta (99.9%Ta,¼Y266,000/kg), which lead to environmentally friendly alloys. These costs by the Nilaco Corporation in Japan are obtained from purity of 99.9% on April 2015. It is important for the strategy of Ti alloys that high performance alloys are developed using ubiquitous elements. Therefore, Ti-6 mol%Mo (Ti-11.3Mo in mass%) alloy was proposed in previous study,28) and its compositional position was ② in Fig. 2. The athermal and iso-thermal½phase was formed in this alloy. When the alloys were exposed to temperatures above 373 K, the nucleation and growth of ½ phase were caused, which led to the suppression of martensitic transformation and the embrittle-ment. An important issue for Ti base shape memory alloys is the stability of their high temperature shape memory effect (Ms>373 K). Therefore, the Ti-6Mo alloy showed poor thermal stability for shape memory behavior.
2.74 2.76 2.78 2.80 2.82 2.84 2.86 2.88 2.90 2.92 2.94
2.25 2.30 2.35 2.40 2.45 2.50 2.55
Bot
Mdt
䐠Base Ti-6Mo in mol% (Ti-11.3Mo in mass%)
䐡Low Bo, Md Ti-6Mo-2Al-1Sn (Ti-11.3Mo-1.1Al-2.3Sn)
䐟Pure Ti
䠖Design alloys in this study
䐢High Bo, Md Ti-6Nb-3Mo (Ti-10.7Nb-5.5Mo)
Pure Ti
α+β alloys
α alloys
β alloys
: Thirty seven commercial alloys for identification of phase boundaries
: Sixty four β alloys for identification of shape memory
: Three design alloys in this study
UTS contour of 700 MPa
Limit of shape memory ability above 293K by dashed line
Ms of 293K by chain line
(b)
(c)
(b’)
(c’)
[image:2.595.117.482.68.315.2]The addition of 2 mol% Al and 1 mol%Sn (11.3Mo, 1.1 Al, 2.3Sn in mass%) into the Ti-6Mo base alloy shifts the alloy position from ② to③ as shown in Fig. 2, using the alloying vectors. In contrast, the addition of 6 mol%Nb and 3 mol%Mo (10.7 Nb, 5.5 Mo in mass%) in pure Ti, changes the position from①to④. Hereafter, unless otherwise noted, alloy compositions are referred to in mole per cent. Position
③ and ④ are localized same amount in a vector from position ②. Further the angle of both ¾②①③ and
¾②①④ was same value of ª as shown in Fig. 2. Alloy compositions were approximately presented in center line (phase boundary line (b)(c)// line (bA)(cA)) in the sub-region showing shape memory ability. The Ti-6Nb-3Mo alloy showed higher Bot(2.817) andMdt(2.431), compared with Ti-6Mo of the base alloy (Bot: 2.806, Mdt: 2.417). There-fore, it may be suggested according to alloying vectors in Fig. 19)and ¢phase stabilizers of a complete solid solution
alloy system, that the Ti-6Nb-3Mo alloy shows the ¢phase stabilization, compared with Ti-6Mo. This agrees with the previous report29) which showed the increase of the ¢ stability by the addition of ¢-stabilizing elements such as Mo,30) Nb31) and Ta.32) In contrast, the Ti-6Mo-2Al-1Sn alloy showed lower Bot(2.794) andMdt(2.409), compared with Ti-6Mo. It may be suggested in the same manner mentioned above, that the Ti-6Mo-2Al-1Sn alloy shows the
¡(or¡AA) phase stabilization because of Al and Sn having the alloying vectors with decrease of Bot, compared with Ti-6Mo.
3. Experimental Procedures
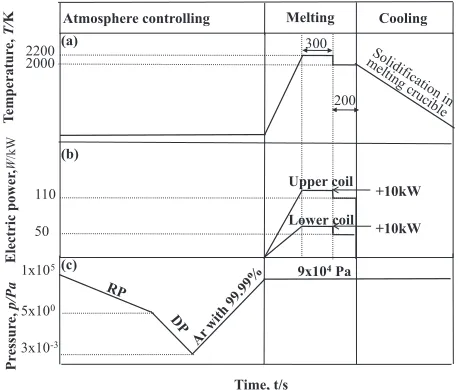
All ingots of design alloys in this study were prepared from raw materials of pure Ti, Al, Mo, Sn and Nb with 99.8, 99.9, 99.0, 99.99 or 99.9 mass%, respectively, by CCLM under the atmosphere of argon gas with purity of 99.99%. The alloys can be melted under untouched condition between melt and melting crucible, which leads to no contaminant from the melting crucible. Figure 3 shows profiles of temperature in molten metal, electric power in upper and lower coils and pressure in atmosphere in a furnace-chamber. The maximum temperature of approximately 2200 K depend-ing on the meltdepend-ing point of alloydepend-ing elements and the hold temperature of approximately 2000 K depending on melting points of alloys, were kept for 300 and 200 s in melting process, for complete melting of raw materials and enough mixing of molten metals, respectively. Molten metals were solidified in the copper melting crucible after switching off electric power after the melting process.
All ingots were solution heat treated at 1173 K for 3.6 ks in an argon stream and water-quenched. They were cold worked to 90%and heat treated at 1173 K for 3.6 ks for evaluation of tension and shape memory characteristics. A part of ingots was aged at 573 K for 21.6 ks after the cold work and solution heat treatment.
X-ray diffraction (XRD) analysis employing nickelfiltered Cu-K¡radiation was performed for phase identification. The specific resistivity was simultaneously measured from 293 K to about 1100 K by the standard four probe d.c. method in air for decision of ¢ transus. The size of samples was 1 mm©1 mm©17 mm for the measurement of specific
resistivity. Rockwell hardness number on the A scale was measured at room temperature.
The sheet-shaped specimens with 1 mm©1 mm©35 mm were prepared for prediction of austenite (namely ¢ phase) transformation starting and finishing temperatures (As and
Af ). The bending method (hereafter called L shaped bending test) has been used to detectAsandAffollowing a procedure outlined in detail elsewhere.33) The specimens were bent to
the deformation position of 0.5³ rad (90 degree) around the cylinder with 10 mm diameter as a jig at 293 K. The specimens were heat to various temperatures of 450923 K, and this resulted in the specimens returning to a position associated with the residual bending angle because of a reversible martensitic phase transformation. Recovery strain,
¾r, was approximated by eq. (3) using Rc and RAc showing
curvature radius before and after heating, respectively, because thickness of specimens,B, was just 1 mm.
¾r ¼ 0:5Bfð1=R0cÞ ð1=RcÞg ð3Þ
Tensile tests were conducted to failure, on the sheet-shaped specimen with gauge lengths of 1©6©14 mm, at room temperature under an initial strain rate of 1.2©10¹4s¹1 in
air. The parts of specimens were strained up to 1.5%and then the applied stress was released, because of the ability of strain gauges used in this study. Loading-unloading-heating cycles were also conducted on the parts of specimens.
4. Results and Discussion
4.1 Microstructures and CCLM effect
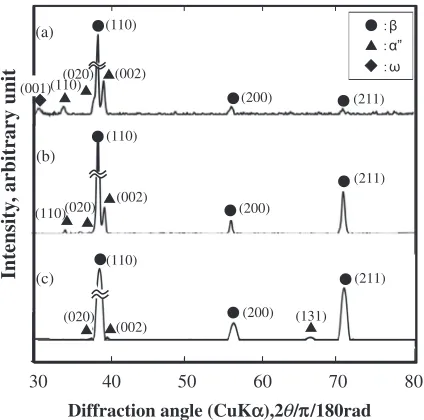
Specimens which were heat-treated at 1173 K for 3.6 ks after 90% cold work, were used in the experiments for evaluation of shape memory ability and tensile properties. Their microstructures showed ¢grains and orthorhombic¡AA precipitate phases, although their amounts were depended on the alloy compositions with differentMdtandBotvalues, as shown in Figs. 4 and 5. The ratio in amount of¡AAto¢phases was smaller and larger on Ti-6Nb-3Mo and Ti-6Mo-2Al-1Sn,
Lower coil
Pr
essur
e,
p/Pa
Atmosphere controlling Melting Cooling
T
emperatur
e,
T/
K
Time, t/s 3x10⁻³
1x10⁵ 9x10⁴Pa
110
50
+10kW 2200
Electric power
,
W
/kW
300 2000
+10kW Upper coil (a)
(b)
(c)
200
5x100
[image:3.595.313.542.71.266.2]respectively. The degree in ¢ stabilization of Ti-6Nb-3Mo was larger than Ti-6Mo-2Al-1Sn and Ti-6Mo, because of its higher Bot value meaning ¢ stabilization, as mentioned in details for alloy design in Chapter 2. In contrast, the transformation from the ¢ phase to the orthorhombic ¡AA martensite phase was partially caused by the water quenching after the heat treatment at 1173 K for 3.6 ks, which results in microstructure consisting of the needle-like shaped¡AAphase in the prior¢particle. In particular, the precipitation amount of ¡AAphase was larger in Ti-6Mo-2Al-1Sn alloy as most ¡AA
(or¡) stabilized one showing lowerBotvalue showing the¡ stabilization region, as shown in Fig. 4(b). Moreover, the½ phase was observed in Ti-6Mo alloy as shown in Fig. 5(a), which also agreed with the previous report.28)
The ¢transus obtained from curves in specific resistivity measurements, was 873, 1020 and 1100 K, for the Ti-6Nb-3Mo, Ti-6Mo and Ti-6Mo-2Al-1Sn alloys. This result agrees with the estimation of ¢ transus in the Mdt-Bot diagram.9)
More, the values of density obtained from measurement by Archimedes’principle were 4.87, 4.80 and 4.94 g/cm3on the
Ti-6Mo, Ti-6Mo-2Al-1Sn and Ti-6Nb-3Mo alloys, respec-tively.
It is clear on the basis of the analysis by EPMA that the strong segregation of alloying elements was not observed even at as-cast state for experimental alloys, which means the better homogenization of molten metal by the diffusion mixing effect of strong stirring due to an electromagnetic force in CCLM, for addition of Nb or Mo with higher densities and higher melting points, compared with other techniques such as induction and arc skull meltings.18) Table 1 lists chemical compositions of impurities in Ti-6Nb-3Mo produced by CCLM. Contents of impurities such as oxygen, carbon and nitrogen in the Ti-6Nb-3Mo ingot prepared by the CCLM, were 0.040, 0.009 and 0.004 mass%, respectively. The contents of gaseous impurities of oxygen
(a)
400μ
m
400μ
m
(c)
(b)
400μ
m
Fig. 4 Optical micrographs of 90%cold worked and heat treated specimens for (a) Ti-6Mo, (b) Ti-6Mo-2Al-1Sn and (c) Ti-6Nb-3Mo alloys.
䠖 䠖
(020)
(b)
(a) (110)
(002)
Intensity
, arbitrary unit
(211) 䠖
30 40 50 60 70 80
Diffraction angle (CuKα),2θ/π/180rad (110)
(002) (110)
(c)
(110)
(020) (002)
(200)
(211)
(131) (110)
(200)
(200)
(211) (020)
(001)
[image:4.595.107.492.67.357.2]Fig. 5 XRD profiles at room temperature of (a) Ti-6Mo, (b) Ti-6Mo-2Al-1Sn and (c) Ti-6Nb-3Mo alloys at cold worked and heat treated condition.
Table 1 Chemical compositions (mass%) of impurities in a Ti-6Nb-3Mo ingot produced by CCLM.
C O N Si B H
[image:4.595.64.276.404.614.2]and nitrogen were lower than those (oxygen and nitrogen: 0.069 and 0.006 mass%, respectively) in the raw materials, because of highly vacuum level of 3©10¹3Pa as shown in
Fig. 3. Moreover, it is found from the contents of impurities that the cleanly molten metals were created by utilization of CCLM without the reaction between the molten metal and water-cooled copper crucible, although the affinity of Ti with oxygen, carbon and nitrogen was strong.
4.2 Shape memory ability and thermal stability in cyclic tests
L shaped bending tests were conducted in temperature range of 450923 K, and the shape recovery amount,¾r, was
obtained by eq. (3) as seen in Fig. 6. Maximum values in¾r
were 0.4, 2.1 and 0.9%on 6Mo, 6Mo-2Al-1Sn and Ti-6Nb-3Mo alloys, respectively.
As andAf were also estimated as follows: Ti-6Mo, 450 and 600 K; Ti-6Mo-2Al-1Sn, 505 and 630 K; Ti-6Nb-3Mo, 490 and 580 K, respectively. Their values above 400 K were higher than ones of some TiNi intermetallic compounds,2)
which meant the achievement of initial objective. They can be called high-temperature shape memory alloys.
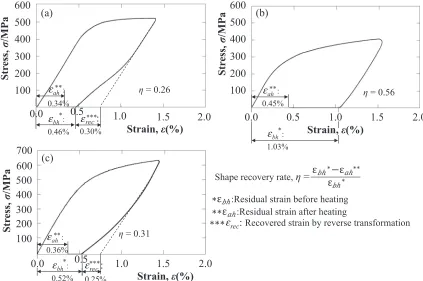
Figure 7 shows the stress-strain curves in tension obtained from three experimental alloys. Specimens were strained up to approximately 1.31.5% and then the applied stress were released, because of the ability of strain gauges used in this study. Strains of approximately 0.46, 1.03 and 0.52% remained after releasing the applied stress in 6Mo, Ti-6Mo-2Al-1Sn and Ti-6Nb-3Mo, respectively. Moreover, the rest deformation was recovered partially with heating up to 520 K, because of the ability of adhesive for strain gauges used in this study. This value of 520 K was lower than their
Af temperatures. Residual strains of 0.34, 0.45 and 0.36% were observed even after heating above this temperature on Ti-6Mo, Ti-6Mo-2Al-1Sn and Ti-6Nb-3Mo, respectively.
The shape memory effect and superelasticity at this experimental temperature34) were suggested on Ti-6Mo-2Al-1Sn and Ti-6Nb-3Mo or Ti-6Mo alloys, respectively, according to the shape of stress-strain curves shown in Fig. 7. The Ti-6Mo showed the larger value of 0.30% in the recovered strain (¾rec indicated in Fig. 7(a)) via reverse
transformation after releasing the applied stress, compared with that (0.25%) of Ti-6Nb-3Mo, which corresponded to the order inAstemperatures (Ti-6Mo: 450, Ti-6Nb-3Mo: 490 K). In contrast, the previously designed Ti-6Mo-3Al alloy with
As of 520 K was 90 and 95%cold worked, which showed the shape memory effect and superelasticity depending on the deformation degree, respectively,28,35) even after the same 0.0
0.4 0.8 1.2 1.6 2.0 2.4 2.8
300 400 500 600 700 800 900 1000 1100
Recovery strain,
εr
(%)
Heating Temperature, T/K Ti-6Mo
Ti-6Mo-2Al-1Sn
Ti-6Nb-3Mo
As temperatures
Af temperatures
Fig. 6 Relation between recovery strain and temperature in L shaped bending tests, for the identification of shape memory ability.
ε
ε ε
ε
ε ε
ε
ε
ε
[image:5.595.56.283.288.424.2] [image:5.595.85.508.478.759.2]heat treatment at 1173 K for 3.6 ks. This heat treatment after the cold work was sufficient for the recrystallization in both samples and the grain coarsening was partially caused only in 95% cold worked specimen. Therefore, there was composi-tional difference between coarsened and un-coarsened grains in 95% cold worked specimen, which may resulted in the indication of¾rec0.12% or superelasticity due to the change
in As depending on the variation of ¢ composition by the difference in diffusion of solute atoms throughout grains, although the averageAswas obtained such as Fig. 7. It may be considered that the difference in diffusion of solute atoms in each ¢ phase with partially coarsened particles was also caused in both Ti-6Mo and Ti-6Nb-3Mo showing super-elasticity partially as the result. In fact, the ¢ transus (873, 1020 K) in Ti-6Nb-3Mo and Ti-6Mo alloys, respectively, was lower than Ti-6Mo-2Al-1Sn showing the shape memory effect. This corresponds to the magnitude in error bars in hardness values caused by microstructural heterogeneity, compared with Ti-6Mo-2Al-1Sn, as seen in Fig. 13 as described in later. Further research will be expected in detail for the relation among the compositional or microstructural heterogeneity,36)the shape memory effect, superelasticity and transformation temperatures.
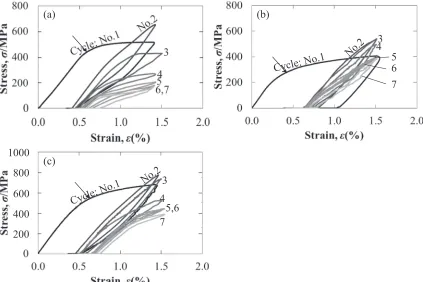
Tensile loading-unloading-heating cycles were also con-ducted on three alloys, and the stress-strain curves to 7 cycles were shown in Fig. 8. The cyclic condition to 7 cycles was same as to one in the test shown in Fig. 7. The incomplete shape memory recovery which was indicated in Fig. 7, was also shown in all cycles, regardless of kinds of alloys. The values in stress under the condition of the constant strain of approximately 1.5%indicated the increase and then decrease afterfirst cycle. In particular, the critical stress to induce¡AA
phase in each cycle was plotted and its value in first cycle was set 1.0, as shown in Fig. 9. Their values also indicated the increase at once afterfirst cycle and decrease again. For instance, the Ti-6Mo alloy with the largest changing amount in stress level, had both athermal and isothermal ½ phase as seen in Figs. 5 and 12 (described in detail later). The isothermal ½ phase is formed by the aging above 373 K37) and accompanied by diffusion.1) The½ phase can act as an obstacle against the stress induced ¡AA transformation,1,38) which corresponds to 1.4 times-increase in critical value for stress induced ¡AAtransformation in second cycle. It may be considered as one of possibility that isothermal½phase was coarsened by increase in the heating of 520 K in cyclic tests and the heterogeneously nucleation site of ¡AA phase was
0 0.2 0.4 0.6 0.8 1 1.2 1.4 1.6 1.8
1 2 3 4 5 6 7
Change of critical
str
ess to induced
α
”*
Number of cycles, n Ti-6Mo
Ti-6Mo-2Al-1Sn Ti-6Nb-3Mo
Fig. 9 Relation between the critical stress to induced¡AAphase and number of cycles in cyclic loading-unloading-heating at 513 K.*The value of critical stress to induced aAAphase atfirst cycle was set 1.0.
(b)
(a)
3
4
5
6
7
(c)
3
4
5,6
7
1000
800
600
400
200
[image:6.595.87.510.70.352.2] [image:6.595.319.534.407.560.2]grown due to the increase of interface region between¢and coarsened ½ phases. This led to easy transformation or the reduction of the critical stress to transformation as the cyclic number increased in test. As other factor, the phase decomposition or decrease of Ms caused by the heating at 520 K (As<520 K<Af) in the cyclic tests, also resulted in this characteristic behavior by the½formation and growth, as seen in Fig. 9.
Figure 10 shows the change in shape recovery rate obtained from the definition in Fig. 7. For Ti-6Nb-3Mo and Ti-6Mo-2Al-1Sn, the change in shape recover rate became to the constant after 2 and 4 cycles, respectively, which led to good thermal stability at 520 K, compared with Ti-6Mo. The Ti-6Mo-2Al-1Sn alloy showed larger value of approx-imately 40% in the shape recovery rate even after 4 cycles, compared with those (26 and 14%) of 6Nb-3Mo and Ti-6Mo, respectively, which corresponded to the order among alloys for the amount of recovery strain shown in Fig. 6. Ti-6Mo showed the largest decrease amount and scatter values in strain, which corresponded to the large amount of precipitation of½ phase or poor thermal stability.
It is considered on the basis of the changing rate and amount in stress and strain by cyclic tests that poor thermal stability at 520 K on Ti-6Mo alloy was improved by the propose of both Ti-6Mo-2Al-1Sn and Ti-6Nb-3Mo which were¡(or¡AA) phase and¢phase stabilized, respectively by the adjustment of alloying parameters.
4.3 Tensile properties
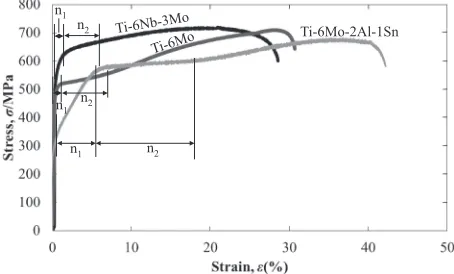
Figure 11 shows the stress-strain curves obtained from three alloys. The tensile deformation mode at ambient temperature is classified in both twin and slip types, which leads to the evaluation and classification of mechanical properties using commercially ¢ type Ti alloys.39) These deformation modes are also estimated by not only diffraction patterns and electron/atom (e/a) ratio but also the behavior of nominal stress-strain curves.3941)The deformation behav-ior by mainly twin type in the stress-strain curves40,41) was shown for three alloys, which corresponded to alloy-compositions in the region showing the deformation mechan-ism by twin type represented inMdt-Botdiagram.41)Ti-6Mo,
Ti-6Mo-2Al-1Sn and Ti-6Nb-3Mo showed Young’s modulus of 93, 90 and 86 GPa, respectively, as listed in Table 2. The
yielding behavior consisting of two steps was shown in stress-strain curves, which was a well-known phenomenon for the stress-induced martensitic transformation. The values of strain hardening coefficient (n value) were 0.105, 0.269 and 0.125 in the initial step of two-steps yielding, as listed in Table 2 and they were depended on the microstructural characterization of individual alloy, which agreed with previous report.28) In other words, Ti-6Mo-2Al-1Sn with lowerBot value or¡ former elements (Al and Sn) addition showed highernvalue, compared with those of Ti-6Mo and Ti-6Nb-3Mo with higherBotvalue or¢former elements (Nb and Mo) addition. The value of «n1¹n2« correlates to the
magnitude of shape recovery ability, which means their large magnitude on Ti-6Mo-2Al-1Sn as seen in Figs. 611.
Ti-6Mo, Ti-6Mo-2Al-1Sn and Ti-6Nb-3Mo showed the ultimate tensile strength, total elongation and reduction of area of approximately 705, 682 and 718 MPa, and 31, 42 and 28%, and 42, 44 and 33%, respectively. These values of 680 720 MPa on the tensile strength agrees roughly with the estimated ones from the contour lines of the tensile strength indicated in Fig. 2. The relation between the electronic parameter and behavior in plastic deformation or dislocation characteristics has been reported in the open literature.42)
4.4 Precipitation of isothermal½ phase
Three alloys were isothermal aged at 573 K for 21.6 ks after the cold work by 90% rolling and solution heat treatment at 1173 K for 3.6 ks. The precipitation of½ phase was observed by XRD, as shown in Fig. 12. Ti-6Mo alloy showed also the precipitation of isothermal ½ phase, in addition to athermal½phase as shown in Fig. 5. In contrast, there was not a peak from isothermal ½ phase in this XRD condition, in both Ti-6Mo-2Al-1Sn and Ti-6Nb-3Mo alloys.
1 2 3 4 5 6 7
Number of cycles, n
Ti-6Mo Ti-6Mo-2Al-1Sn Ti-6Nb-3Mo
Change
of shape r
ecovery rate**
0.0 0.1 0.2 0.3 0.4 0.5 0.6 0.7 0.8 0.9 1.0
(17)
(14) (15) (14)
(17) (46)
(42)
(26) (26) (26) (25) (26)
( :26, :56, :31)
(41) (40) (41)
(25)* (55)*
[image:7.595.62.278.70.204.2](15)*
Fig. 10 Relation between the shape recovery rate and number of cycles in cyclic loading-unloading-heating at 513 K. *The value (%) of shape recovery rate defined in Fig. 7, at each cycle. **The value of shape recovery rate atfirst cycle was set 1.0.
Ti-6Mo-2Al-1Sn n1
n2
n1 n2
[image:7.595.313.540.72.209.2]n1 n2
[image:7.595.307.548.282.355.2]Fig. 11 Nominal stress-strain curves to failure on 90%cold-worked and heat-treated Ti-6Mo, Ti-6Mo-2Al-1Sn and Ti-6Nb-3Mo specimens.
Table 2 Young’s modulus, reduction of area, andnvalues for 6Mo, Ti-6Mo-2Al-1Sn, Ti-6Nb-3Mo alloys.
Alloys
Young’s modulus (GPa)
Reduction
of area (%) n1 n2 «n1¹n2«
Ti-6Mo 93 41.7 0.105 0.033 0.072
Ti-6Mo-2Al-1Sn 90 44.3 0.269 0.038 0.231
Figure 13 shows the change of hardness due to the precipitation of ½ phase caused by the isothermal aging. Three alloys had same level in hardness before aging, but the increase of hardness values by aging depending on the amount of½phase in each alloy. In particular, Ti-6Mo alloy showed the increase of 1.9 times in hardness values, compared with others. It is found that Ti-6Mo alloy has poor thermal stability for shape memory behavior caused by the much precipitation of½phase, as seen in Figs. 9 and 10 showing larger change in stress and larger decrease in strain, respectively.
4.5 Proposal of promising alloys usingMdt-Botdiagram
There were the indications of ¢/¢+¡/¡ phase bounda-ries, tensile strength contour, Ms temperature line and shape memory appearance at 293 K in the Mdt-Bot diagram as shown in Fig. 2. Previously proposed Ti-6Mo base alloy28) showed poor thermal stability in shape memory behavior because of the much precipitation of ½ phase. The phase boundary of¢/¢+½+(¡AA)43)is near to the limit line of the
left side (lowerMdtand higherBotsides) in the appearance region of the shape memory at 293 K by a dotted line in Fig. 2. In contrast, the ¢ type Ti alloys were deformed by
either slip or twin mechanism.3941) This ¢/¢+½+(¡AA)
phase boundary is also close to the slip/twin deformation boundary.43) It is considered that more ¢ and ¡AA (or ¡)
stabilization in alloys are useful for the suppression of ½ phase even in¢+½+(¡AA) region in Fig. 2, compared with Ti-6Mo alloy. Figure 1 indicated some vectors of Ti-M binary alloys for selection and additional amount of alloying elements. Therefore, the Ti-6Nb-3Mo alloy as the more ¢ stabilized one showed higher Bot(2.817) and Mdt (2.431), compared with Ti-6Mo of the base alloy (Bot: 2.806, Mdt: 2.417). In contrast, the Ti-6Mo-2Al-1Sn alloy showed lower
Bot(2.794) andMdt(2.409), as the¡AA(or¡) stabilized one, compared with Ti-6Mo. Both design alloys showed objective properties such as ultimate tensile strength, shape memory ability, good thermal stability and As temperatures above 400 K. In particular, Ti-6Mo-2Al-1Sn showed improved thermal stability and constant shape memory rate of approximately 40% even after 4 cycles in loading-unload-ing-heating tests.
Promising alloys may be proposed successfully in order to obtain various objectives, even by the selection of ubiquitous alloying elements such as Al and Sn as ¡ (or ¡A) phase stabilizer using this vector concept on the basis of the properties-variation inMdt-Botdiagram.
5. Conclusions
(1) Both Ti-6Mo-2Al-1Sn and Ti-6Nb-3Mo alloys were proposed in order to improve thermal stability for shape memory behavior of the 6Mo base alloy. The Ti-6Nb-3Mo as a¢ phase stabilized alloy had higherBot
(2.817) and Mdt (2.431), compared with the Ti-6Mo base alloy (Bot: 2.806,Mdt: 2.417). In contrast, the Ti-6Mo-2Al-1Sn alloy meaning the¡AAphase stabilization showed lowerBot(2.794) and Mdt (2.409), compared with Ti-6Mo.
(2) The design alloys showed the As temperatures above 490 K. The constant values of 40 and 25% in shape recovery rate after 4 cycles in loading-unloading-heating tests were measured on both Ti-6Mo-2Al-1Sn and Ti-6Nb-3Mo with a little of½ phase, respectively. Both alloys showed good thermal stability in cyclic tests at 520 K, compared with Ti-6Mo.
(3) Design alloys showed tensile strengths ranging from 682 to 718 MPa and fracture elongation ranging from 28 to 42%, which meant to the approximately achieve-ment in the objective for the tensile properties. (4) It may be find from this study that promising alloys
are proposed successfully in order to obtain various objectives, using this vector concept on the basis of the properties-variation described inMdt-Botdiagram.
REFERENCES
1) P. J. S. Buenconsejo, H. Y. Kim, H. Hosoda and S. Miyazaki:Acta Mater.57(2009) 10681077.
2) K. Matsugi, T. Kashiwagi, Y. B. Choi and G. Sasaki:Mater. Trans.52
(2011) 21892196.
3) M. Ikeda, S. Y. Komatsu and Y. Nakayama:Mater. Trans.45(2004) 11061112.
4) C. Baker:Metal Sci. J.5(1971) 92.
(211)
(110)
(002)
: : :
(a)
(b)
(002) (110)
(110)
(200)
(211)
(211) (c)
Intensity
, arbitrary unit
30 40 50 60 70 80
Diffraction angle (CuKα),2θ/π/180rad
(200)
(200)
[image:8.595.64.275.68.274.2](001) (002) (220)
Fig. 12 XRD profiles of (a) Ti-6Mo, (b) Ti-6Mo-2Al-1Sn and (c) Ti-6Nb-3Mo alloys aged at 573 K for 21.6 ks after cold-work and heat-treatment.
40 50 60 70 80 90
Ti-6Mo Ti-6Mo-2Al-1Sn Ti-6Nb-3Mo after aging
before aging
Alloys
Hardness of Rockwell on
A
scale, (H
R
[image:8.595.63.278.327.460.2]A)
5) S. Guo, B. Chen, Q. Meng, R. Zhao and X. Zhao:Progress Natural Sci. Mater. Int.23(2013) 16.
6) T. Peradze, I. Stamateli, J. Cederstrom, T. Berikashvili, A. Razov and K. Gorga: Int. J. Appl. Electromagn. Mech.23(2006) 3943. 7) A. Suzuki, M. Ogawa and T. Shimizu:Electric Furnace Steel75(2004)
127131.
8) J. Fu, A. Yamamoto, H. Y. Kim, H. Hosoda and S. Miyazaki: Acta Biomater.17(2015) 5667.
9) M. Morinaga, N. Yukawa and H. Adachi: Tetsu-to-Hagane72(1986) 555562.
10) K. Matsugi, Y. Murata, M. Morinaga and N. Yukawa:Mater. Sci. Eng. A172(1993) 101110.
11) M. Morinaga, N. Yukawa, T. Maya, K. Sone and H. Adachi:Proc. 6th World Conf. on Titanium, (1988) pp. 16011606.
12) M. Morinaga, J. Saito and M. Morishita:J. JILM42(1992) 614621. 13) M. Morinaga, Y. Murata and H. Ezaki: Proc. Int. Symp. Material Chemistry in Nuclear Environment, (Tsukuba, March, 1992) pp. 241 252.
14) R. Ninomiya, H. Yukawa and M. Morinaga:J. JILM44(1994) 171 177.
15) K. Matsugi, H. Mamiya, Y. B. Choi, G. Sasaki, O. Yanagisawa and H. Kuramoto:Int. J. Cast Metals Res.21(2008) 156161.
16) Material Properties Handbook, Titanium Handbook, ed. by T. W. During, (ASM, Metal Park, OH, ASM, 1994).
17) S. K. Sadrnezhaad and S. B. Raz:Metall. Mat. Trans. B36(2005) 395 403.
18) J. P. Kuang, R. A. Harding and J. Campbell:Mater. Sci. Technol.16
(2000) 10071016.
19) T. Volkmann, W. Loser and D. M. Herlach:Metall. Mat. Trans. A28
(1997) 461469.
20) S. Asai: Ferrum7(2002) 4448.
21) N. Sakaguchia, M. Niinomi, T. Akahori, J. Takeda and H. Toda:Mater. Sci. Eng. C25(2005) 370376.
22) J. I. Kim, H. Y. Kim, T. Inamura, H. Hosoda and S. Miyazaki:Mater. Sci. Eng. A403(2005) 334339.
23) Y. L. Hao, S. J. Li, S. Y. Sun and R. Yang:Mater. Sci. Eng. A441
(2006) 12118.
24) S. J. Kim and J. I. Kim:Mater. Res. Bull.48(2013) 51255130. 25) P. Xue, Y. Li, F. Zhanga and C. Zhoua:Scr. Mater.101(2015) 99102. 26) K. Matsugi, Y. Murata, M. Morinaga and N. Yukawa:Proc. 7th Int Conf. on Superalloys, ed. by S. D. Antolovich, R. W. Stusrud, R. A. MacKay, D. L. Anton, T. Khan, R. D. Kissinger and D. L. Klarstrom, (TMS, Warrendale, 1992) pp. 307316.
27) K. Matsugi, T. Endo, Y.-B. Choi and G. Sasaki:Mater. Trans.51(2010) 740748.
28) K. Matsugi, M. Nakata, Y. B. Choi and G. Sasaki: J. JFS.84(2012) 432437.
29) M. A. Hady, K. Hinoshita and M. Morinaga: Scr. Mater.55(2006) 477480.
30) E. Sukedai, H. Matsumoto and H. Hasgimoto: J. E. M. 51(2002) S143S147.
31) H. Y. Kim, H. Satoru, J. I. Kim, H. Hosoda and S. Miyazaki:Mater. Trans.45(2004) 24432448.
32) Y. L. Zhou, M. Niinomi and T. Akahori:Mater. Sci. Eng. A371(2004) 283290.
33) Z. Yu, G. Wang, X. Ma, Y. Zhang and M. S. Dargusch:Mater. Sci. Eng. A513514(2009) 233238.
34) S. Miyazaki: Kagaku-to-Kyoiku60(2012) 310313.
35) M. Nakata: Master Degree Thesis, Hiroshima University, (2011). 36) T. Peradze, I. Stamateli, J. Cederstrom, T. Berikashvili, A. Razov and
K. Gorgadze: Int. J. Appl. Eletromag. Mech.23(2006) 3943. 37) B. S. Hickman:J. Mater. Sci.4(1969) 554563.
38) H. Y. Kim, H. Hosoda and S. Miyazaki:J. JILM55(2005) 613617. 39) S. Hanada: Bull. JIM25(1986) 755764.
40) X. H. Min, S. Emura, T. Nishimura, K. Tsuchiya and K. Tsuzaki:Mater. Sci. Eng. A527(2010) 54995506.
41) M. Morinaga, M. Kato, T. Kamimura, M. Fukumoto, I. Harada and K. Kubo: Proc. 7th World Conf. on Titanium, TMS, (1992) pp. 217224. 42) K. Matsugi, S. Yamamura, Z. F. Xu, Y. B. Choi, K. Sugio, G. Sasaki
and N. Oda:Mater. Trans.56(2015) 16751682.